Development and validation by accuracy profile of a method for the
analysis of monoterpenes in indoor air by active sampling and thermal
desorption-gas chromatography-mass spectrometry
Christelle Marlet, Georges Lognay
Department of Analytical Chemistry, University of Liège - Gembloux Agro-Bio Tech, Belgium
ABSTRACT
The technique of thermal desorption (TD)-GC/MS was evaluated for the measurement of monoterpenes in indoor air. The validation strategy was intentionally oriented towards routine use and the reliability of the method rather than extreme performance. For this reason, validation by accuracy profile was chosen. The accuracy profile procedure, which is based on the concept of total error (bias + standard deviation), guarantees that a known proportion of future results obtained with the method will be within acceptance limits. For all the compounds tested in the present study, α-pinene, α-terpineol, β-pinene, d-limonene, ∆3-carene, camphene, 1,8-cineole, p-cymene, linalool, but not in the case of carvone, the accuracy profile procedure established that at least 95% of the future results obtained would be within the ±15% acceptance limits of the validated method over the whole defined concentration range. Other parameters, such as selectivity, recovery, repeatability, stability of the molecules of interest and the effect of temperature, were also determined. The performance of the described method was finally evaluated by the analysis of indoor air from new timber frame constructions.
Keywords : Monoterpenes ; Accuracy profile ; Thermal desorption ; Air sampling ; Tenax TA ; Wood construction
1. Introduction
European builders are becoming increasingly interested in timber frame construction. This kind of construction offers many advantages: rapid construction, better insulation, lower energy costs, and lower levels of waste and pollution. Furthermore, in comparison with other forms of construction, wooden houses allow a reduction in carbon footprint and in the impact on the environment.
In addition, indoor air quality is essential for the well being of inhabitants, in view of the fact that most people spend more than 90% of their time in an indoor environment [1].
The presence of volatile organic compounds such as monoterpenes (α-pinene, β-pinene, ∆3-carene, p-cymene and d-limonene) is frequent in indoor air. They are naturally occurring compounds that are mainly released into indoor air from building materials such as wood, paints and varnishes, cleaning agents and cosmetics [2,3]. In recent years, some studies have reported that concentrations of indoor air monoterpenes have greatly increased, obviously due to the more frequent usage of natural products in the construction of houses, buildings and upholstery [4,5]. The main compounds emitted by wood and derivatives are terpenes [6-8]. α-Pinene is the most perceptually abundant compound of all the spruce wood volatiles [9].
Some papers have discussed high concentrations of α-pinene, β-pinene, ∆3-carene, p-cymene and d-limonene and others as being responsible for causing occasional irritation of the skin, eyes and mucus membranes in humans [10]. Prolonged exposure could probably also explain other symptoms such as allergic and non-allergic contact dermatitis, chronic impairment of lung function and airway irritation [11-18]. Many other studies have dealt with the reactions of monoterpenes with oxidative agents such as O3, NO2 and OH radical generating airborne particulate matter as well as secondary pollutants such as formaldehyde, acetaldehyde and acetone [19-22]. Preconcentration on solid adsorbents followed by thermal desorption and GC analysis has become a well-accepted VOC analysis technique in a wide range of applications. Most techniques described in the literature are for compounds in the C5-C10 volatility range [23]. This technique would also seem suitable for monoterpene
analysis. However, few studies have dealt only with a combination of monoterpenes in indoor environments [2]. The main studied monoterpenes are α-pinene, β-pinene, ∆3-carene and d-limonene because they are frequently included in VOC mixtures [6,24-27].
This paper presents the development and the validation of a TD-GC-MS method for the determination of monoterpenes in the indoor environment applied to timber frame constructions. The monoterpenes studied were chosen after a first screening in a timber frame construction and a literature survey. The TD-GC-MS method was validated using the accuracy profile procedure. This procedure is a simple decision tool based on the notion of the total error (bias and standard deviation) of the method allowing the assessment of the method's validity. Thus, the procedure simplifies the validation approach of an analytical method [28,29]. The objective is to reach a known level of guarantee for the results produced during field experiments. For each studied monoterpene, an accuracy profile was determined on a predicted range. The sampling method was also validated and applied to indoor air in timber frame and wood constructions.
2. Material and methods
2.1. Chemicals
The following reference compounds were purchased from Sigma-Aldrich (Belgium): α-pinene, α-terpineol, β-pinene, d-limonene, ∆3-carene, camphene, carvone, 1,8-cineole, p-cymene, linalool and n-butyl-benzene. The purity of the reference compounds was verified by Fast GC following Heuskin et al. [30] and by TD-GC-MS. The list of terpenes and their purity established by TD-GC-MS is shown in Table 1.
"Analytical reagent grade" methanol, used as the solvent for the preparation of standards, was obtained from Fisher Scientific (Belgium).
Table 1 Monoterpenes description.
Compounds IUPAC name Molecular formula m/z (quantification) Purity (%)
Base peak M° + α-Pinene Trimethyl-2,6,6-bicyclo(3,1,1)hept-2-ene C10H16 93 136 98.8 ± 0.6 Camphene 2,2-Dimethyl-3-methylene-bicyclo(2,2,1)heptane C10H16 94 136 96.9 ± 0.3 β-Pinene Trimethyl-2,6,6-bicyclo(3,1,1)hept-1-ene C10H16 95 136 98.9 ± 0.6 ∆3-Carene 3,7,7-Trimethylbicyclo(4,1,0)hept-3-ene C10H16 96 136 98 ± 1 d-Limonene 1-Methyl-4-prop-1-en-2-yl-cyclohexene C10H16 97 136 98.4 ± 0.2 p-Cymene 4-Isopropyltoluene C10H14 98 136 98.6 ± 0.2 1,8-Cineole 1,3,3-Trimethyl-2-oxabicyclo(2,2,2)octane C10H18O 99 136 98.3 ± 0.1 Linalool 2,6-Dimethyl-2,7-octadien-6-ol C10H18O 100 136 95 ± 2 α-Terpineol Alpha-4-trimethyl-3-cyclohexene-1-methanol C10H18O 101 136 98 ± 1 Carvone 2-Methyl-5-(1-methylethenyl)- C10H14O 82 150 97.7 ± 0.2 2.2. Adsorbent
The sampling tubes used for the monoterpene sampling, were of stainless steel type (89 mm length, 6.4 mm outer diameter (O.D.), 5 mm internal diameter (I.D.)) with Tenax TA (polymer of 2,6-diphenyl-p-phenylene oxide) of 60-80 mesh size as the sorbent. They were supplied by Markes Int. Ltd. (UK). Tenax TA is the most widely used sorbent in indoor analysis. It has high thermal stability and low water adsorption. With a specific area of 35 m2/g, it is a weak sorbent and it can adsorb a broad range of compounds (C6-C26). It is recommended for aromatics except benzene, apolar components (BP > 100 °C) and less volatile polar molecules with BP >150°C [31]. However, in the present research, it was observed, as has been the case with some other authors, that Tenax TA can produce artifacts such as benzene, toluene, benzaldehyde and acetophenone [32,33]. Nevertheless, in this study no artifacts were observed in the zone of the studied terpenes. The suitability of Tenax TA for monoterpenes tested independently of their functional groups has been demonstrated elsewhere [2]. Moreover, the selection of the sorbent material is based on the ISO 16017-1:2000 standard [34], which recommends the use of Tenax TA as the sorbent.
2.3. Standard preparation
The preparation of a standard is crucial for the accuracy of the method. Therefore, a precise amount has to be deposited into the sorbent tube. A literature survey revealed various suggested methods including the vapor spiking of the standard gas, the vaporization of the standard solution and the liquid spiking of the sorbent with calibration solution. The first two of these methods are notoriously difficult and expensive [35,36]. So, the third method, the liquid spiking technique, was chosen and optimized here.
Spiking of the calibration tubes (injection volume of 1 µl) was performed with a Calibration Solution Loading Rig (CSLR™) from Markes Int. Ltd. The loading time was 2 min to eliminate the solvent and to ensure a homogeneous distribution and the quantitative retention of terpenes on the sorbent beds. During high
concentration standard loading (100 ng), a second tube was connected onto the loading tube in order to estimate potential breakthrough. This parameter was calculated as the percentage of monoterpene mass found in the back tube relative to the total mass in both tubes. Triplicate determinations were carried out on each investigated compound. This test demonstrated that there was no breakthrough.
Daily, stock solutions of each monoterpene were prepared gravimetrically in methanol at a concentration of 10 µg/µl. Following this, stock solutions of monoterpenes were blended at a concentration of 200 ng/µl. This solution was used to prepare new calibration and validation standards. An internal standard, n-butyl-benzene, was also prepared gravimetrically and diluted using methanol. This was added to the calibration and validation standards in order to achieve the same concentration, fixed at 25 ng/µl. Methanol was used because the Tenax TA sorbent has very little affinity for this polar solvent and does not interfere with GC-MS analysis [2].
2.4. TD-GC-MS analysis
Analysis of adsorbed VOCs was performed by thermal desorption (TD) and GC-MS. The thermal desorber was a Unity™ TD Markes (Markes Int. Ltd.) equipped with an autosampler (Markes mod. ULTRA™ 50:50). The thermal desorber provides a two-stage mechanism. Thermal desorption of the spiking and sampling tubes was carried out at 280°C for 15 min with helium (99.9999%-mol, Alphagaz 2, Air Liquide, Belgium) at a flow rate of 30 ml min-1 (primary desorption). The analytes were transferred from the tube into a cold trap (Carbopack and Tenax TA 1:1 mixture) maintained at -10°C by the Peltier effect. After the primary desorption, the cold trap was rapidly heated from -10°C to 300°C at 100°C s-1 (secondary desorption) and then maintained at this temperature for 3 min. The analytes were injected onto a capillary column via a transfer line heated at 200°C (outlet split flow: 12.6 ml min-1).
GC-MS analyses were carried out on a Thermo Trace GC Ultra coupled with a Thermo Trace MS Finnigan mass selective detector (Thermo Electron Corp) and equipped with a capillary column Rtx 502.2 (RESTEK) (30 m × 0.25 mm ID, 1.4 µ m film thickness). The oven temperature program was initiated at 40°C, held for 5 min then raised first at 4°C min-1 to 75°C, raised in a second ramp at 3°C min-1 to 115°C, then at 13°C min-1 up to 250°C with a final hold of 2.5 min. The temperature program was optimized for a mixture of 50 VOCs (Supelco, Sigma-Aldrich) to test the column resolution, and more precisely the separation of compounds between C6 and C16 according to the ISO16000-6: 2004 standard [37]. The flow rate was fixed at 1.6 ml min-1.
Full scan mode was adopted for the detection of terpenes and VOCs (scanned mass range from 35 amu to 300 amu, EI mode at 70 eV). The source and the transfer line were maintained at 230°C and 250°C, respectively. A 2 min solvent delay time was applied to avoid saturation of the detector. Analysis time was 40 min.
Qualitative identification of terpenes was based on retention and MS data. Two selected ions: the molecular ion (M°+) and the base peak (see Table 1) were used for quantitative purposes.
Quantification of field samples was conducted by the internal standard mode, as suggested by several authors, in order to compensate for measurement uncertainties during analysis [38-40]. n-Butyl-benzene was chosen as the internal standard for monoterpene analysis [30]. The internal standard was loaded after indoor air sampling and just before the chromatographic runs. According to Demeestere et al. [38], the subsequent loading of other analytes (gaseous or liquid) into the same sorbent tube does not affect the response of the previously loaded ones. Our results are in line with these observations.
For quality control, every 7 samples, a tube spiked with standard solution was analyzed in order to control any drift.
2.5. Statistical processing: accuracy profile
The accuracy profile procedure allows us to easily evaluate the capability of an analytical method to quantify samples with a known accuracy and a fixed risk according to that method's objective. Too many validation procedures are limited to the calculation of statistical criteria and do not propose effective techniques to decide whether a method is capable of accurately quantifying an analyte. This approach, not only simplifies the validation process of an analytical method, but also allows the monitoring of risk related to its utilization [29]. This validation procedure, well described in the literature [28,29,41-49], can be summarized as follows: 1. Define the validation domain of the analytical method in terms of concentration levels and its objective in terms of acceptance limits.
2. Define the experimental design for calibration and validation. The calibration and validation design is characterized by the numbers of series, the number of replicates by series and level, and the number of concentration levels.
3. Prepare the calibration and validation standards.
4. Analyze the calibration standards. A calibration curve should be drawn for each series.
5. Analyze the validation standards and calculate the concentration of validation standards using the regression equation obtained in the previous step.
6. Determine the precision, the trueness and the tolerance interval.
7. Draw the accuracy profile as the mean bias, the tolerance and acceptance limits as a function of concentration, on relative values (Fig. 1).
8. Determine the linearity of the method by plotting calculated validation concentrations versus theoretical concentration.
Fig. 1. Schematic representation of an accuracy profile. The dotted lines are the upper and lower acceptance
limits set at 15%, the dashed lines are the upper and lower β-expectation tolerance limits and the continuous line is the relative error. The intersections between the tolerance limit and the acceptance limit define the lower limit of quantification (LLOQ) and the upper limit of quantification (ULOQ). Adapted from [45].
2.6. Air sampling
Before first use, Tenax TA tubes were conditioned by flushing with helium (flow rate of 100 ml min-1 ) at 300°C for 2 h and 320°C for 30 min. They were then sealed with Swagelok fittings and PTFE ferrules to prevent contamination. Moreover, before sampling, the tubes were systematically reconditioned for a period of 30 min at 300°C under a flow rate of helium of 100 ml min-1.
The pump (Escort™ Elf, Sigma-Aldrich) was calibrated with a Humonics Optiflow Flowmeter before and after each active air sampling. The tubes were connected to a Twin Port Sampler (Escort™ Elf, Sigma-Aldrich), linked to a sampling pump. Previously, some studies have determined that the monoterpene breakthrough volume is up to several liters [50,51]. However, we chose to use low sampling flow rates (50 ml min-1) and a
short sampling period (30 min), resulting in a total sample volume of 1500 ml in order to avoid exceeding the breakthrough volume. These short-term sampling periods allowed a rapid screening. Afterwards, the tubes were sealed with Swagelok fittings and PTFE ferrules and stored at 20°C until use.
3. Results and discussion
The first part of this section discusses the performance evaluation of the TD-GC-MS analysis of monoterpenes. The second part describes the accuracy profile validation of the method. The last part presents the results of the analysis of indoor air samples taken from three new wood constructions.
3.1. TD-GC-MS performance
3.1.1. Selectivity
Selectivity was tested by comparing chromatograms of different blank samples, indoor air samples and calibration standards. A small amount of interference (minor peaks of bleeding siloxanes) was observed in the retention times of monoterpenes (Fig. 2). Chromatographic conditions were optimized in order to obtain a satisfactory resolution for each peak of interest.
3.1.2. Evaluation of blank level
The limit of detection (LOD) was firstly determined from the standard deviation of the blank; this corresponds to three times the standard deviation of five blank measurements, expressed in mass or concentration units, while the limit of quantification (LOQ) is 10 times the same deviation. The selected terpenes yielded LODs in the 0.006-0.475 ng range and LOQs in the 0.019-1.585 ng range. These values correspond to LODs in actively sampled air of between 0.004 and 0.317 µg/m3 when using a 30 min sampling time at 50 ml min-1. These values are shown in Table 2.
Nevertheless, these LODs were only considered as estimations. The ISO 16017-1:2000 standard [34] specifies that "the sorbent tube blank level is acceptable if interfering peaks are not greater than 10% of the typical areas of the analytes of interest". As the minimum level studied was 1 ng, the area corresponding to 0.1 ng was considered as the limit value for the acceptance of the blank.
As a result of the accuracy profile, the lower limits of quantification (LLOQ) and upper limits of quantification (ULOQ) can also be defined graphically, by the intersection between the tolerance limit and the acceptance limit. These new values are in perfect agreement with the definition of LLOQ, i.e. the smallest quantity of the analyzed substance that can be measured with a defined accuracy (trueness + precision) [28]. These limits, obtained with the internal standard, are shown in Table 2. They seem relatively high compared to the quantification limits obtained by the dispersion of the blank but they are more objective and are in agreement with values presented in the literature [2].
Table 2 Limit of determination (LOD), limit of quantification (LOQ), lower limit of quantification (LLOQ) and
upper limit of quantification (ULOQ) of the method expressed in ng and µg/m3 for each monoterpene.
Compounds Retention time (min) LOD = 3xS LOQ = 10 x S LLOQ ULOQ
ng µg/m3 ng µg/m3 ng µg/m3 ng α-Pinene 21.01 0.043 0.029 0.143 0.095 10.0 6.7 >100 Camphene 22.24 0.015 0.010 0.049 0.033 11.0 7.4 >100 β-Pinene 24.04 0.006 0.004 0.019 0.012 8.3 5.6 >100 ∆3-Carene 25.75 0.016 0.010 0.052 0.034 4.8 3.2 >100 d-Limonene 26.91 0.475 0.317 1.585 1.057 6.7 4.5 >100 p-Cymene 27.26 0.024 0.016 0.078 0.052 5.6 3.8 >100 1,8-Cineole 27.61 0.037 0.025 0.123 0.082 7.8 5.2 >100 Linalool 29.91 0.079 0.052 0.262 0.175 5.7 3.8 >100 α-Terpineol 32.59 0.070 0.047 0.233 0.155 4.6 3.1 >100 Carvone 33.91 0.357 0.238 1.191 0.794 5.0 3.4 >100
Fig. 2. GC-MS chromatogram of a blank tube (a), a tube loaded with standards (b) and an indoor air sample
tube (c). Monitored monoterpenes: (1) α-pinene, (2) camphene, (3) β-pinene, (4) ∆3-carene, (5) d-limonene, (6) p-cymene, (7) 1,8-cineole, (8) linalool, (9) α-terpineol, (10) carvone and (11) n-butyl-benzene (internal standard).
3.1.3. Recoveries of monoterpenes after thermal desorption
Recoveries were determined by performing two repeated desorptions on each tube at 280°C. After the first desorption, the cartridge was cooled down to ambient temperature and was then desorbed again directly under the same conditions. Analytes should ideally be desorbed completely during the first desorption step. The amounts recovered in the first desorption are expressed as a percentage of the total recovered amount for two spiking amounts, 1 ng and 100 ng. These values are shown in Table 3. Except for carvone, the recovery was very good, higher than 98.0%. Under the conditions employed, desorption was considered to be complete and there were no memory effects in the subsequent heating cycles.
3.1.4. Repeatability
A repeatability study was conducted by the consecutive analysis of eight tubes spiked with the same amount of a standard work solution (10 ng). The values of repeatability (% relative standard deviation (RSD)) are reported in Table 3. All the monoterpenes measured showed a repeatability of lower than 15%, which complies with ISO 16000-6 performance criteria [37].
Table 3 Recovery and repeatability of the method.
Compounds Recovery (N = 3) Repeatability (N = 8)
% (1 ng) % (100 ng) % α-Pinene 99.9 ± 0.1 100 1.5 Camphene 99.6 ± 0.4 100 2.7 β-Pinene 99.9 ± 0.1 100 2.7 ∆3-Carene 99.9 ± 0.1 100 1.9 d-Limonene 98.8 ± 0.1 100 1.4 p-Cymene 99.7 ± 0.1 100 2.3 1,8-Cineole 99.6 ± 0.7 100 3.2 Linalool 98.6 ± 0.1 100 2.7 α-Terpineol 99.6 ± 0.2 100 4.2 Carvone 91 ± 4 100 4.1
3.1.5. Stability of the sampling device
The stability of Tenax TA sorbent was tested for two successive series and two concentration levels. For the first series, 15 tubes were prepared with 50 ng absolute amount of each analyte. For the second series, the same tubes were spiked with 5 ng of the different terpenes. The tubes were sealed with Swagelok fittings and PTFE ferrules. For each series, three tubes were directly analyzed, while six tubes were stored at 18.5 ± 0.6°C and six at 3.7 ± 0.4°C. These last tubes were analyzed at regular intervals of 3 and 7 days respectively.
The mean recoveries were distributed from 94.6% to 107.6% (Table 4). These results are in line with the National Institute for Occupational Health and Safety (NIOSH, US) recommendations (the difference should be lower than 10% between the measured values and the initial ones) [52].
Three-way and a two-way analyses of variance (ANOVA, P = 0.05), for the series of three and two variables, respectively, were used to evaluate the effect of the different variables: storage time (days 3 and 7), storage temperature (3.7°C and 18.5°C) and analyte loading (5 ng and 50 ng) on the recoveries of analytes on Tenax TA (Table 5). Anova testing did not indicate a time, a temperature or, for some compounds, a concentration
dependency on the recoveries on Tenax TA. The concentration dependency could result from the "series" effect because the assays were made in two separated sets of measurements. The temperature was therefore fixed at 18.5°C for the next field experiments and samples were analyzed as soon as possible.
The present results showed that Tenax TA was a suitable sorbent for TD-GC-MS analysis of monoterpene hydrocarbons, and thus corroborated previous studies [52-54]. In contrast with the findings of Coeur et al. [55], the present results revealed neither a time nor a temperature effect on the storage of the investigated molecules.
Table 4 Mean recovery values for Tenax TA at different storage time, storage temperature and analyte. Mean ± standard deviation
Mass (ng)
Temperature (°C)
Time
(day) α-Pinene Camphene β-Pinene ∆3
-Carene d-Limonene p-Cymene 1,8-Cineole Linalool α-Terpineol Carvone 5 4 3 102 ± 3 102 ± 4 102 ± 3 102 ± 4 97 ± 3 108 ± 6 102 ± 4 103 ± 3 108 ± 4 104 ± 12 4 7 104 ± 4 104 ± 4 103 ± 5 102 ± 7 97 ± 3 107 ± 7 104 ± 5 99 ± 3 102 ± 4 102 ± 11 20 3 99 ± 2 100 ± 4 97 ± 2 98 ± 3 102 ± 16 104 ± 3 100 ± 2 98 ± 3 102 ± 3 95 ± 6 20 7 102 ± 2 102 ± 4 100 ± 3 101 ± 3 96 ± 2 106 ± 3 102 ± 2 96.9 ± 0.5 100 ± 4 99 ± 6 50 4 3 98 ± 2 - 100 ± 2 97 ± 1 98 ± 2 98.7 ± 0.8 - - - - 4 7 101 ± 2 - 100 ± 2 98 ± 1 102 ± 2 101.5 ± 0.8 - - - - 20 3 98 ± 1 - 98 ± 1 96.2 ± 0.5 99 ± 1 102.2 ± 0.8 - - - - 20 7 100 ± 1 - 100 ± 1 97.6 ± 0.5 101 ± 1 100.1 ± 0.8 - - - -
Table 5 Recovery dependency of analyte loading, storage temperature and storage time.
Variable α-Pinene Camphene β-Pinene ∆3-Carene d-Limonene p-Cymene 1,8-Cineole Linalool α-Terpineol Carvone
Loaded mass b - a b a c - - - -
Storage temperature a a a a a a a a a a
Storage time b a a a a a a a a a
a Not significantly different at the P = 0.05 probability level. b
Significantly different at the P = 0.05 probability level.
c Significantly different at the P = 0.01 probability level.
3.1.6. Desorption temperature effect
The chosen desorption temperature must be set below the maximum temperature of the sorbent and the upper temperature limit of stability for the compound of interest. Two temperatures were tested, 250°C and 280°C. No difference between the two chromatograms obtained and no occurrence of degradation products were observed. So, the temperature of 280°C was chosen for the desorption step. Furthermore, the chromatograms obtained by TD-GC-MS and GC-MS were similar with no observed artifacts.
3.2. TD-GC-MS validation
3.2.1. Validation domain and acceptance limits
The study was focused on the indoor air of new timber frame constructions. As few investigations have been carried out regarding this kind of housing condition, a first screening was performed in a wood construction and compared with some of the results presented in the literature for different buildings [2,25,26,56]. In agreement with these studies, the molecules were chosen and the "1-100 ng" working range was adopted. This corresponded to a range of 0.67-67.00 µg terpene m-3 when the sampling volume was fixed at 1.5 1. This domain was the same for calibration and validation standards.
In the absence of any official reference, a compromise was made in the choice of acceptance limits between the TO-17 standard [31] (accuracy should be lower than 30%) and the ISO 16000-6 standard [37] (RSD should be lower than 15% between two samples). The acceptance limits were set at ±15% for all monoterpenes. If the method is validated, the analyst can guarantee that at least 95% of measurements will fall between ±15% of the actual value of the sample.
3.2.2. Experimental design
The validation experiments had to be carried out according to a design which took into account the main sources of variation and allowed the establishment of the intermediate precision. The calibration design consisted of 3 days, with two replicates a day and four concentrations (1-5-25-100 ng). The validation process was designed over 3 days, with two replicates a day and seven concentrations (1-2-5-10-25-50-100 ng). The number of trials for calibration design was lower than validation design so as to reduce the analysis time. Indeed, the calibration standards would be analyzed before each series of routine samples.
3.2.3. Preparation of calibration and validation standards
There are two types of standard for elaborating an accuracy profile. Calibration standards allow us to define the response function (peak area - concentration), while validation standards allow us to estimate the total error and the tolerance interval from the response function. The calibration and validation standards were prepared here according to the procedure described in Section 2.3. This step was repeated for each series in order to take into account this source of uncertainty in the global error of measurement.
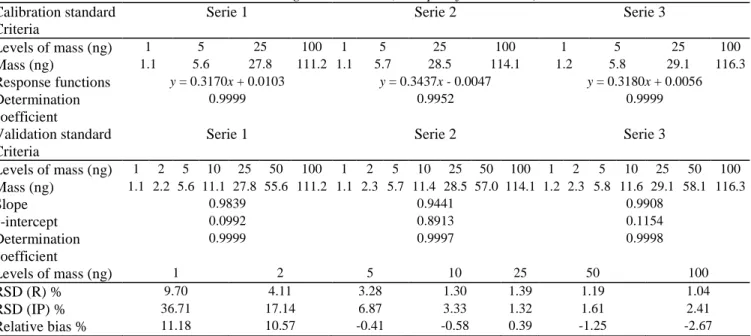
Table 6 Statistical data and results obtained during the validation (example of d-limonene). Calibration standard
Criteria
Serie 1 Serie 2 Serie 3
Levels of mass (ng) 1 5 25 100 1 5 25 100 1 5 25 100 Mass (ng) 1.1 5.6 27.8 111.2 1.1 5.7 28.5 114.1 1.2 5.8 29.1 116.3 Response functions y = 0.3170x + 0.0103 y = 0.3437x - 0.0047 y = 0.3180x + 0.0056 Determination coefficient 0.9999 0.9952 0.9999 Validation standard Criteria
Serie 1 Serie 2 Serie 3
Levels of mass (ng) 1 2 5 10 25 50 100 1 2 5 10 25 50 100 1 2 5 10 25 50 100 Mass (ng) 1.1 2.2 5.6 11.1 27.8 55.6 111.2 1.1 2.3 5.7 11.4 28.5 57.0 114.1 1.2 2.3 5.8 11.6 29.1 58.1 116.3 Slope 0.9839 0.9441 0.9908 y-intercept 0.0992 0.8913 0.1154 Determination coefficient 0.9999 0.9997 0.9998 Levels of mass (ng) 1 2 5 10 25 50 100 RSD (R) % 9.70 4.11 3.28 1.30 1.39 1.19 1.04 RSD (IP) % 36.71 17.14 6.87 3.33 1.32 1.61 2.41 Relative bias % 11.18 10.57 -0.41 -0.58 0.39 -1.25 -2.67
RSD (R): Repeatability relative standard deviation. RSD (IP): Intermediate precision relative standard deviation.
3.2.4. Response functions
The analysis of the calibration standards allowed us to determine the response functions of each monoterpene for each series. The most adapted response to describe the relationship existing between amount ratio (x) and area ratio (y) was a linear function: y = ax + b; this was obtained by internal standardization. As an example, the regression parameters of the equations for limonene are given in Table 6.
3.2.5. Alignment and back-calculation
As the standards were prepared by gravimetric method, the introduced quantities were not the same from one series to the next. It was necessary to carry out an alignment on the mean concentration, in accordance with [29]: This alignment consisted in transforming observed instrumental responses (yijk → yijk,c) in order to align them on
this mean concentration. It was carried out by interpolation, by adding to the observed response, the difference between the considered response function value, at the mean concentration, and this function value, at the introduced concentration. In validation, the alignment was applied to the responses obtained with the validation samples, using the response functions achieved with the calibration standards. Thus, the alignment of the nij
repetitions of the j concentration level of the i series was carried out as follows:
The estimated concentrations of the validation standards were then back calculated by series, using the equations of response functions.
3.2.6. Precision, trueness and tolerance interval
Finally, for each concentration level, the trueness and the precision of the method were estimated and then the limits of the β-content tolerance interval (TI) representing the accuracy were calculated. These limits would include a large proportion (95%) of results.
The precision of the method was evaluated on the whole range (1-100 ng) with the study of validation standards by measuring the standard deviation and the relative standard deviation of repeatability and intermediate precision [45]. The data recorded for limonene are given as an example in Table 6. The calculated RSDs were lower than 4% from 10 ng to 100 ng. These revealed weak dispersions.
The trueness of the method refers to the closeness of agreement between a conventionally accepted value and a mean experimental one [28,29]. The trueness was given for each monoterpene by the calculation of the relative bias (%) at each concentration level. Table 6 shows that, for limonene, the relative biases are centered on 0% from 5 ng to 100 ng, which attests a weak bias of the method in this range. For quantities lower than 5 ng, the relative biases are higher. The same observations are made for all other monoterpenes.
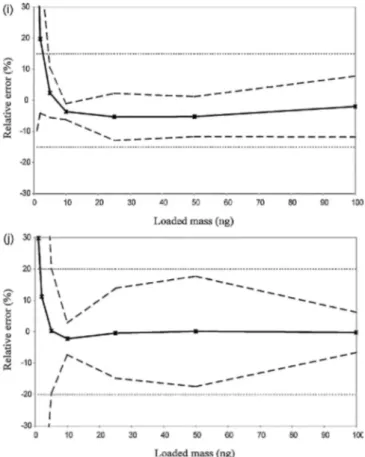
Fig. 3. Accuracy profile of the monitored monoterpenes: (a) α-pinene, (b) camphene, (c) β-pinene, (d) ∆3-carene, (e) d-limonene, (f) p-cymene, (g) 1,8-cineole, (h) linalool, (i) α-terpineol and (j) carvone.
3.2.7. Accuracy profile
Accuracy, assessed from the accuracy profile, is the expression of the sum of the trueness and the precision. It represents the closeness of agreement between the measured value and the conventional "true" value.
The accuracy profiles for the studied monoterpenes are illustrated in Fig. 3. The trueness is represented by the relative bias (%) and the precision is symbolized by the lower tolerance limit (LTL) and the upper tolerance limit (UTL) calculated with intermediate precision relative standard deviation (RSD (IP)).
When considering these profiles, it can be concluded that the method is valid for the quantification of all monoterpenes because all tolerance intervals are included within the acceptance limits of ±15%. One exception is carvone, where the acceptance limits were set at ±20%. Also, the limits of quantification are higher than the lowest limits of the validation domain (1 ng). Table 2 presents the lower limit of quantification (LLOQ) for each monoterpene determined by the intersection between the acceptance limits and the tolerance intervals. For the chosen acceptance limits (15% and 20% for carvone) and probability (95%), the method was validated on the range defined between the new LLOQ and 100 ng. A probability of 99% could also be chosen. In this way, the risk of having data outside the acceptance limits is only 1%. With the results calculated from this study, a decrease in risk led to an increase in the LLOQ and, consequently, to a decrease in the validated range of concentrations. Furthermore, papers dealing with the accuracy profile procedure have obtained a probability of 95% [41-49].
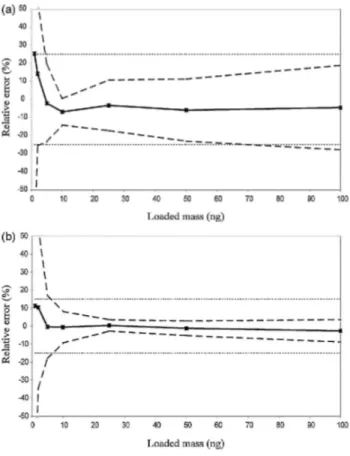
Fig. 4 presents two accuracy profiles for limonene computed from the same experimental assays but under different conditions: Fig. 4a shows the linear calibration model without internal standard; Fig. 4b shows the linear calibration model with internal standard. From Fig. 4, it can be concluded that the method is valid when both quantification techniques are used. However, the tolerance intervals are narrower and better centered around the 0% of total error line when the internal standard is used: it reduces the total error of the measurement and improves the performance of the analytical procedure. These results confirm the observations of Demeestere et al., Su et al., and Cuadros-Rodriguez et al. [38-40]. Therefore, the internal standard was used for routine analysis.
Fig. 4. Comparison of two different accuracy profiles for d-limonene using linear calibration model with or
without internal standard: (a) external standardization: (b) internal standardization.
3.2.8. Linearity of results
The linearity of an analytical method rests on its ability within a definite range to obtain results that are directly proportional to the concentrations (quantities) of the analytes in the sample [28,29]. For all series, a linear model was fitted on the back-calculated concentrations of the validation standards as a function of the introduced concentrations. The regression equation is presented in Table 6. In order to assess the linearity, the absolute expectation tolerance intervals were used [29]. Linearity for limonene was also demonstrated since the β-expectation tolerance limits were included in the absolute acceptance limits for the new previously defined concentration range (Fig. 5).
Fig. 5. Linear profile of the analytical method for d-limonene. The dashed lines on this graph correspond to the
accuracy profile, i.e. the β-expectation tolerance limits expressed in absolute values. The dotted lines represent the acceptance limits at ±15% expressed in the mass unit. The continuous line is the identity line y = x.
3.3. Indoor air sample analysis
To evaluate the performance of the analytical method, several real indoor air samples were taken in three new wood constructions and analyzed according to the described procedure.
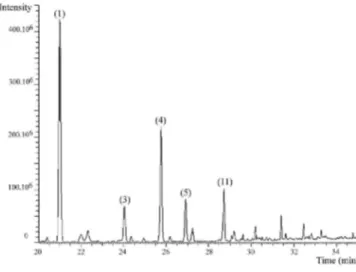
An indoor air chromatogram of a new wood frame construction is shown in Fig. 6. The four terpenes, α-pinene, β-pinene, ∆3-carene and d-limonene, could be clearly identified among other volatile organic compounds. Table 7 shows the monoterpene concentrations (µg/m3) of the samples and the respective sampling relative humidity and temperature conditions, obtained in three buildings. Site 1 was a timber frame construction, while the other two were wood frame constructions. Some compounds were found with a concentration higher than the defined range (italic characters). Other compounds were also detected, but these were below the defined range. In this case, the label "<LLOQ" was indicated. Where the label "<LOD" appears, the compound was not found in the presented analytical conditions. α-Pinene was the main compound found at the three sites, although ∆3 -carene, d-limonene and β-pinene were also detected there.
The parameters studied were the recovery, reproducibility and breakthrough of the sampling. Sampling was carried out according to the sampling procedure.
To evaluate the performance of the monoterpene recoveries from tubes in real samples, a subsequent re-analysis of the already desorbed sampled tube was carried out at the same temperature (280°C) in order to remove any remaining analytes from the tube. Tube recovery percentages of 100% were recorded for identified
monoterpenes.
Experiments made in triplicate (tubes placed in parallel coupled in series to back tubes) were carried out in the field in order to evaluate sampling reproducibility (% RSD) and breakthrough (calculated as the percentage of monoterpene mass found in the back tube relative to the total mass in both tubes) respectively. Results of triplicates are shown in Table 7. For three active samples taken inside of each new timber frame construction, the relative standard deviation (RSD) was lower than 15%, as recommended by the ISO 16000-6: 2004 standard [37]. The typical recommended VOC breakthrough value is <5% [31] of the detected target compounds. In the present study, no breakthrough was observed.
Fig. 6. GC-MS chromatogram of an indoor airsample from a new wood construction. Monoterpenes identified:
Table 7 Samples monoterpenes concentrations (µg/m3), standard deviation and sampling temperature (°C) and relative humidity (%) conditions.
Compounds Site 1 (CB2) Site 2 (CB3) Site3 (CB4)
Cx (µ g/m3) RSD (%) Cx (µ g/m3) RSD (%) Cx (µ g/m3) RSD (%)
α-Pinene 50 ± 2 4.5 160 ± 10 6.1 369 ± 26 7.2
Camphene <LLOQ - <LLOQ - <LLOQ -
β-Pinene <LLOQ - 24.0 ± 0.3 1.1 93 ± 3 3.1
∆3 -Carene 10 ± 1 7.0 69 ± 2 2.5 246 ± 10 4.0
d-Limonene 239 ± 10 4.1 22.2 ± 0.2 1.0 24.6 ± 0.9 3.6
p-Cymene <LLOQ - <LLOQ - <LLOQ -
1,8-Cineole <LLOQ - <LLOQ - <LOD -
Linalool <LLOQ - <LLOQ - <LLOQ -
α-Terpineol <LLOQ - <LLOQ - <LOD -
Carvone <LLOQ - <LLOQ - <LOD -
Temperature (°C) 12 ± 2 11 ± 1 14 ± 2
Relative humidity (%) 55 ± 5 63 ± 8 54 ± 6
4. Conclusions
The validation of an analytical method is the ultimate step before its implementation in routine use. The proposed method showed excellent performance in the present study in agreement with several standards [31,34,37]. The method presented here a good selectivity and repeatability and small blank levels. The recoveries and the stability of the sampling device were also been evaluated.
But the study of the performance method is not sufficient to define the capability of the method in routine use. In order to guarantee the ability of the method to provide accurate results, an accuracy profile (a visual decision tool) was used for the validation method. An accuracy profile was drawn for each monoterpene. In all cases, the tolerance limits were inside the acceptance limits. The accuracy profile gave the guarantee that at least 95% of the future results obtained with the validated method would be within the ±15% acceptance limits over the whole defined concentration range. Thus, the method was validated over the whole defined concentration range. This validation procedure considers the total error, including systematic and random error for one series but also between each series. So, this procedure presents the advantage of giving information about the maximal error risk and does not require the use of arbitrary standards. Furthermore, several decisions, such as the use of an internal standard, were made in order to design operating procedures that would be easy to apply in routine samplings.
Monoterpenes are widely present in new wood constructions. High levels of α-pinene, d-limonene and ∆3-carene were found in the houses studied here. Consequently, it is necessary to have accurate methods for evaluating their levels, their evolution and their implication in reactional mechanisms. Indeed, previous studies [19-22] have demonstrated that monoterpenes reactivity with oxidative agents (O3, NOx, OH) leads to aldehyde and ketone
formation.
Ongoing studies are being undertaken to improve validation over a wider concentration range and will be applied to systematic investigations of the indoor air of eco-buildings. This validation procedure could also be used for other compounds in the field of indoor air quality.
Appendix A.
References
[1] P.J. Franklin, Peadiatr. Respir. Rev. 8 (2007) 281.
[2] J. Hollender, F. Sandner, M. Möller, W. Dott, J. Chromatogr. A 962 (2002) 175. [3] R.J. Meesters, M. Duisken, H. Jähnigen, J. Hollender, J. Chromatogr. A 875 (2008) 444.
[4] S.K. Brown, M.R. Sim, M.J. Abramson, C.N. Gray, Indoor Air-Int. J. Indoor Air Qual. Climate 4(1994) 123. [5] C.J. Weschler, Atmos. Environ. 43 (2009) 153.
[6] T. Aoki, S.I. Tanabe, Atmos. Environ. 41 (2007) 3139.
[7] A.T. Hodgson, D. Beal, J.E.R. Mcllvaine, Indoor Air 12 (2002) 235. [8] M.G.D. Baumann, S.A. Batterman, G.Z. Zhang, Forest Prod. J. 49 (1999) 49. [9] P. Omrani, E. Masson, A. Pizzi, H.R. Mansouri, Polym. Degrad. Stab. 93 (2008) 794. [10] R.J. Meesters, M. Duisken, J. Hollender, Xenobiotica37 (2007) 604.
[11] G. Hedenstierna, R. Alexandersson, K. Wimander, G. Rosen, Int. Arch. Occup. Environ. Health 51 (1983) 191. [12] A.A. Falk, M.T. Hagberg, A.E. Lot, E.M. Wigaeus-Hjelm, Z.P. Wang, Scand. J. Work Environ. Health 16 (1990) 372. [13] A. Falk, A. Lot, M. Hagberg, E.W. Hjelm, Z. Wang, Toxicol. Appl. Pharmacol. 110 (1991) 198.
[14] A. Falk-Filipsson, A. Lot, M. Hagberg, E.W. Hjelm, Z. Wang, J. Toxicol. Environ. Health 38 (1993) 77. [15] U. Johard, K. Larsson, A. Lot, A. Eklund, Am. J. Ind. Med. 23 (1993) 793.
[16] K.A. Eriksson, N.L. Stjernberg, J.O. Levin, U. Hammarstrom, M.C. Ledin, Scand. J. Work Environ. Health 22 (1996) 182.
[17] K.A. Eriksson, J.O. Levin, T. Sandstrom, K. Lindstrom-Espeling, G. Linden, N.L. Stjernberg, Scand J. Work Environ. Health 23 (1997) 114.
[18] J.P. Kasanen, A.L. Pasanen, P. Pasanen, J. Liesivuori, V.M. Kosma, Y. Alarie, J. Toxicol. Environ. Health A 57 (1999) 89. [19] G. Sarwar, R. Corsi, D. Allen, C. Weschler, Atmos. Environ. 37 (2003) 1365.
[20] J.K. Nøjgaard, M. Bilde, C. Stenby, O.J. Nielsen, P. Wolkoff, Atmos. Environ. 40 (2006) 1030. [21] G. Sarwar, R. Corsi, Atmos. Environ. 41 (2007) 959-973.
[22] M.S. Zuraimi, C.J. Weschler, K.W. Tham, M.O. Fadeyi, Atmos. Environ. 41 (2007) 5213. [23] D. Helmig, F. Bocquet, J. Pollmann, T. Revermann, Atmos. Environ. 38 (2004) 557. [24] A.T. Hodgson, A.F. Rudd, D. Beal, S. Chandra, Indoor Air 10 (2000) 178. [25] S.K. Brown, Indoor Air 12 (2002) 55.
[26] J.S. Park, K. Ikeda, Indoor Air 16 (2006) 129.
[27] H. Järnström, K. Saarela, P. Kalliokoski, A.P. Pasanen, Atmos. Environ. 40 (2006) 7178.
[28] P. Hubert, J.J. Nguyen-Huu, B. Boulanger, E. Chapuzet, P. Chiap, N. Cohen, P.A. Compagnon, W. Dewé, M. Feinberg, M. Lallier, M. Laurentie, N. Mercier, G. Muzard, C. Nivet, L. Valat, STP Pharma. Pratiques 13 (2003) 101.
[29] P· Hubert, J.J. Nguyen-Huu, B. Boulanger, E. Chapuzet, P. Chiap, N. Cohen, P.A. Compagnon, W. Dewé, M. Feinberg, M. Lallier, M. Laurentie, N. Mercier, G. Muzard, C. Nivet, L. Valat, STP Pharma. Pratiques 16 (2006) 34.
[30] S. Heuskin, B. Godin, P. Leroy, Q. Capella, J.P. Wathelet, F. Verheggen, E. Haubruge, G. Lognay, J. Chromatogr. A 1216 (2009) 2768. [31] TO-17, Compendium of Methods for the Determination of Toxic Volatile Organic Compounds (VOCs) in Ambient Air, US
Environmental Protection Agency (EPA), Cincinnati, OH, 1999.
[32] M. De Bortoli, H. Knöppel, E. Pecchio, H. Schauenburg, H. Vissers, Indoor Air 2 (2004) 216.
[33] A. Ribes, G. Carrera, A. Gallego, X. Roca, M.J. Berenger, X. Guardino, J. Chromatogr. A 1140 (2007) 44.
[34] EN ISO1 6017-1, Indoor, Ambient And Workplace air - Sampling and Analysis Of Volatile Organic Compounds By Sorbent Tube/Thermal Desorption/Capillary Gas Chromatography - Part 1 : Pumped Sampling, 2000.
[35] E. Woolfonden, Diffusive Monitor 15 (2006) 20.
[36] N.A. Martin, N. Barber, J.K. Black, R.P. Lipscombe, C.A. Taig, Atmos. Environ. 41 (2007) 7666.
[37] EN ISO16000 6, Indoor air - Determination of volatile Organic Compounds in Indoor and Test Chamber Air By Active Sampling on Tenax TA® Sorbent, Thermal Desorption And Gas Chromatography Using MS/FID, 2004.
[38] K. Demeestere, J. Dewulf, K. De Roo, P. De Wispelaere, H. Van Langenhove, J. Chromatogr. A 1186 (2008) 348. [39] Y.C. Su, C.C. Chang, J.L. Wang, J. Chromatogr. A 1201 (2008) 134.
[40] L. Cuadros-Rodríguez, M.G. Bagur-González, M. Sánchez-Viñas, A. Gonzáles-Casado, A.M. Gómez-Sáez, J. Chromatogr. A 1158 (2007) 33.
[41] M. Feinberg, Spectra Analyse 249 (2006) 16.
[42] R.D. Marini, P. Chiap, B. Boulanger, S. Rudaz, E. Rozet, J. Crommen, Ph. Hubert, Talanta68 (2006) 1166.
[43] E. Rozet, R. Morello, F. Lecomte, G.B. Martin, P. Chiap, J. Crommen, K.S. Boos, Ph. Hubert, J. Chromatogr. B 844 (2006) 251. [44] E. Rozet, B. Mertens, W. Dewe, A. Ceccato, B. Govaerts, B. Boulanger, P. Chiap, B. Streel, J. Crommen, P. Hubert, J. Pharm. Biomed. Anal. 42 (2006) 64.
[45] E. Rozet, V. Wascotte, N. Lecouturier, V. Préat, W. Dewé, B. Boulanger, P. Hubert, Anal. Chim. Acta 591 (2007) 239.
[46] E. Rozet, C. Hubert, A. Ceccato, W. Dewé, E. Ziemons, F. Moonen, K. Michail, R. Wintersteiger, B. Street B. Boulanger, Ph. Hubert, J. Chromatogr. A 1158 (2007) 126.
[47] L. Dencausse, A. Galland, J.L. Clamou, J. Basso, Int. J. Cosmet. Sci. 30 (2008) 373. [48] M. Feinberg, J. San-Redon, A. Assié, J. Chromatogr. B 877 (2009) 2388.
[49] H. Kharbouche, F. Sporkert, S. Troxler, M. Augsburger, P. Mangin, C. Staub, J. Chromatogr. B 877 (2009) 2337. [50] V. Simon, M.L. Riba, A. Waldhart, L. Torres, J. Chromatogr. A 704 (1995) 465.
[51] R.H. Brown, Analyst 121 (1996) 1171.
[52] J. Volden, Y. Thomassen, T. Greibrokk, S. Thorud, P. Molander, Anal. Chim. Acta 530(2005)263. [53] W. Schrader, J. Geiger, D. Klockow, E. Korte, Environ. Sci. Technol. 35 (2001) 2717.
[54] A.L. Sunesson, M. Sundgren.J.O. Levin, K. Eriksson, R. Carlson, J. Environ. Monit. 1 (1999) 45. [55] C. Coeur, V. Jacob, I. Denis, R. Foster, J. Chromatogr. A 786 (1997) 185.