https://doi.org/10.1051/0004-6361/202038008 c A. Boccaletti et al. 2020
Astronomy
&
Astrophysics
L
ETTER TO THEE
DITORPossible evidence of ongoing planet formation in AB Aurigae
A showcase of the SPHERE/ALMA synergy
?A. Boccaletti
1, E. Di Folco
2, E. Pantin
3, A. Dutrey
2, S. Guilloteau
2, Y. W. Tang
4, V. Piétu
5, E. Habart
6, J. Milli
8,
T. L. Beck
7, and A.-L. Maire
91 LESIA, Observatoire de Paris, Université PSL, CNRS, Sorbonne Université, Univ. Paris Diderot, Sorbonne Paris Cité, 5 place Jules Janssen, 92195 Meudon, France
e-mail: anthony.boccaletti@obspm.fr
2 Laboratoire d’Astrophysique de Bordeaux, Université de Bordeaux, CNRS, B18N, Allée Geoffroy Saint-Hilaire, 33615 Pessac, France
3 Laboratoire CEA, IRFU/DAp, AIM, Université Paris-Saclay, Université Paris Diderot, Sorbonne Paris Cité, CNRS, 91191 Gif-sur-Yvette, France
4 Academia Sinica, Institute of Astronomy and Astrophysics, 11F of AS/NTU Astronomy-Mathematics Building, No.1, Sec. 4, Roosevelt Rd, Taipei, Taiwan
5 IRAM, 300 rue de la piscine, Domaine Universitaire, 38406 Saint-Martin d’Hères, France
6 Institut d’astrophysique spatiale, CNRS UMR 8617, Université Paris-Sud 11, Bât 121, 91405 Orsay, France 7 Space Telescope Science Institute, 3700 San Martin Drive, Baltimore, MD 21218, USA
8 CNRS, IPAG, Univ. Grenoble Alpes, 38000 Grenoble, France
9 STAR Institute, Université de Liège, Allée du Six Août 19c, 4000 Liège, Belgium Received 23 March 2020/ Accepted 29 April 2020
ABSTRACT
Context.Planet formation is expected to take place in the first million years of a planetary system through various processes, which remain to be tested through observations.
Aims.With the recent discovery, using ALMA, of two gaseous spiral arms inside the ∼120 au cavity and connected to dusty spirals, the famous protoplanetary disk around AB Aurigae presents a strong incentive for investigating the mechanisms that lead to giant planet formation. A candidate protoplanet located inside a spiral arm has already been claimed in an earlier study based on the same ALMA data.
Methods.We used SPHERE at the Very Large Telescope to perform near-infrared high-contrast imaging of AB Aur in polarized and unpolarized light in order to study the morphology of the disk and search for signs of planet formation.
Results.SPHERE has delivered the deepest images ever obtained for AB Aur in scattered light. Among the many structures that are yet to be understood, we identified not only the inner spiral arms, but we also resolved a feature in the form of a twist in the eastern spiral at a separation of about 30 au. The twist of the spiral is perfectly reproduced with a planet-driven density wave model when projection effects are accounted for. We measured an azimuthal displacement with respect to the counterpart of this feature in the ALMA data, which is consistent with Keplerian motion on a 4 yr baseline. Another point sxce is detected near the edge of the inner ring, which is likely the result of scattering as opposed to the direct emission from a planet photosphere. We tentatively derived mass constraints for these two features.
Conclusions.The twist and its apparent orbital motion could well be the first direct evidence of a connection between a protoplanet candidate and its manifestation as a spiral imprinted in the gas and dust distributions.
Key words. stars: individual: AB Aur – protoplanetary disks – planet-disk interactions – techniques: image processing – techniques: high angular resolution
1. Introduction
Planets are believed to form in protoplanetary disks over a few million years. Images at all wavelengths exhibit a variety of struc-tures, such as asymmetries, clumps, rings, or spirals. Most of these features, which hypothetically betray the presence of planets via gravitational or hydrodynamical effects, have been observed in disks orbiting Herbig Ae/Be stars because of their suitable
? Based on data collected at the European Southern Observatory under programs 0104.C-0157, and 2104.C-5036.
brightness, particularly in the near-infrared (NIR) (see for ins-tance Grady et al. 2001; Clampin et al. 2003; Fukagawa et al. 2006;Isella et al. 2010;Christiaens et al. 2014). Planet formation is generally favored (Zhu 2015) over instabilities in a massive self-gravitating disk (Rice et al. 2005). In the early stage of planet formation, hydrodynamical simulations indicate that the accre-tion process generates at the planet locaaccre-tion an inner and outer spiral pattern due to Lindblad resonances induced by disk-planet interactions (Gressel et al. 2013). While this crucial step is well-documented by theoretical works (Dong et al. 2015;Bae & Zhu 2018), observational evidence is rare and not fully conclusive.
Open Access article,published by EDP Sciences, under the terms of the Creative Commons Attribution License (https://creativecommons.org/licenses/by/4.0),
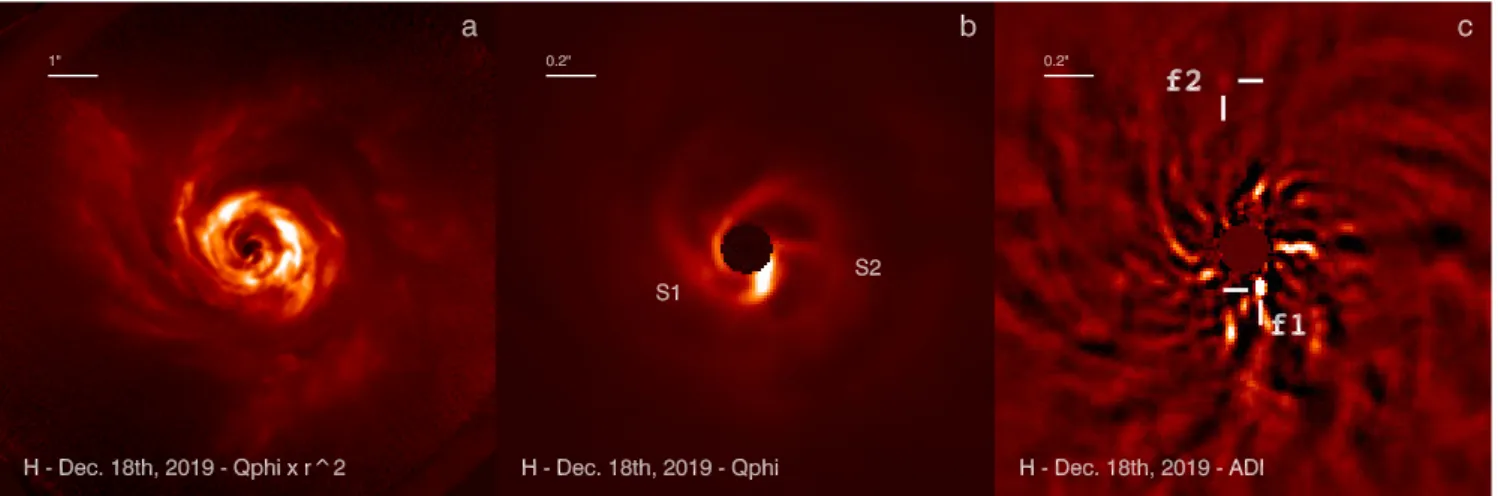
Fig. 1.Images of the AB Aur system obtained with SPHERE in polarized light (a, b) and unpolarized light (c). A large field of view (1000
) is shown in panel a, where the polarized intensity has been multiplied with the square of the stellocentric distance (Qφ× r2) to visually enhance the outer part of the disk. A narrower field of view (200
) of the Qφmap is displayed in panel b, in which the inner spirals are labelled S1 and S2. Comparable ADI-processed image is shown in panel c for total intensity in the H band filter. Features f1 and f2 are discussed in Sect.4. North is up, east is left.
Recently, Muro-Arena et al. (2020) identified a kinked spiral in the protoplanetary disk SR 21, suggesting that it may be a promising system for potentially witnessing ongoing planet formation.
With a spectral type A0 (2.4 ± 0.2 M ,DeWarf et al. 2003),
AB Aurigae is one of the closest (d = 162.9 ± 1.5 pc, Gaia Collaboration 2018), and one of the most intensively stud-ied Herbig Ae star. Optical scattered light images of its proto-planetary disk have been obtained in the visible (Grady et al. 1999;Fukagawa et al. 2004), and in the NIR (Perrin et al. 2009; Hashimoto et al. 2011), revealing a moderately inclined (i ∼ 30◦), flared disk and prominent spiral patterns extending from 200 to 450 au. In fact, AB Aurigae exhibits among the most spec-tacular spirals imaged so far in scattered light and high-contrast polarimetric imaging.
Millimetric observations have also been key in constraining the distribution of gas and dust in the AB Aur system. Using the IRAM Plateau de Bure Interferometer, Piétu et al. (2005) reported the presence of a large CO and dust rotating disk with a central cavity of an inner radius of ∼70 au. Surprisingly, Tang et al.(2012) found counter-rotating CO spirals in the outer disk, which has been explained by projection effects of accretion flows arising from above the disk’s midplane. The high accretion rate (∼10−7M yr−1,Salyk et al. 2013) measured for this 1 Myr
object reinforces this interpretation.
More recently, Tang et al. (2017) studied the CO 2-1 and dust continuum distribution at very high angular scale (0.0800
or 13 au) using ALMA and revealed two spectacular CO spi-rals residing inside the large disk cavity. The authors specu-lated that these spirals are driven by planet formation and could be generated by two planets respectively located at ∼30 and 60–80 au from the star. Motivated by these results, we con-ducted Very Large Telescope (VLT)/SPHERE observations of the AB Aurigae system and present them in this Letter. Here, we describe the observations, analyze the data and discuss the pos-sible origin of the inner spiral pattern.
2. Observations
AB Aur (V = 7.05, H = 5.06, K = 4.23) has been observed with SPHERE (Beuzit et al. 2019) in polarimetry (Dec. 2019) and in spectro-photometry (Jan. 2020). The first data set was
obtained with the infrared camera IRDIS (Dohlen et al. 2008; de Boer et al. 2020) using Pupil Tracking (PT) in the H band, which allows us to retrieve, at the same time, the polarized inten-sity of the disk and the total inteninten-sity by making use of dif-ferential polarimetric imaging (DPI) and of angular differential imaging (ADI). The second epoch used the IRDIFS-EXT mode of SPHERE, which combines IRDIS in the K1K2 filters, and the spectrograph (IFS, Claudi et al. 2008) in low-resolution mode YJH (R = 30), also processed with ADI. The observing log is provided in TableA.1.
Both DPI and ADI increase the contrast by rejecting the starlight, exploiting either the fact that the stellar light is unpo-larized or that off-axis objects rotate with the field in PT mode. While DPI provides unbiased polarimetric images of disks, ADI induces very strong photometric and astrometric artifacts owing to the self-subtraction effect (Milli et al. 2012). The data were processed at the SPHERE Data Center following Pavlov et al. (2008), Delorme et al. (2017), Maire et al. (2016). The cali-brated data cubes were then processed with SpeCal for total intensity data (Galicher et al. 2018) and with a custom pipeline for polarimetric data (as in Bhowmik et al. 2019). The total intensity data were reduced with Principal Component Analysis (Soummer et al. 2012), whereas for polarimetry, we calculated the azimuthal Stokes parameters Qφ and Uφ maps follow-ing Schmid et al. (2006). For a sanity check, we compared our polarimetric reductions with those of the IRDAP pipeline (van Holstein et al. 2020), which implements a careful treatment of the instrumental polarization. We found that since the instru-mental effects are much fainter than the disk structures we fur-ther discuss below, the Qφimages are identical in both pipelines.
The first epoch is significantly better in terms of starlight rejec-tion, therefore the following sections are mainly based on these observations.
3. Disk morphology
As the disk is moderately inclined, the ADI process strongly and irremediably attenuates the disk signal (Fig.1c). Therefore, the following description is based on the polarimetric H-band Qφ
image (Figs.1a, b). The disk is visible all across the IRDIS 1100×
1100field of view. We identify three main regions: the dust ring, the outer spirals, and the inner spirals.
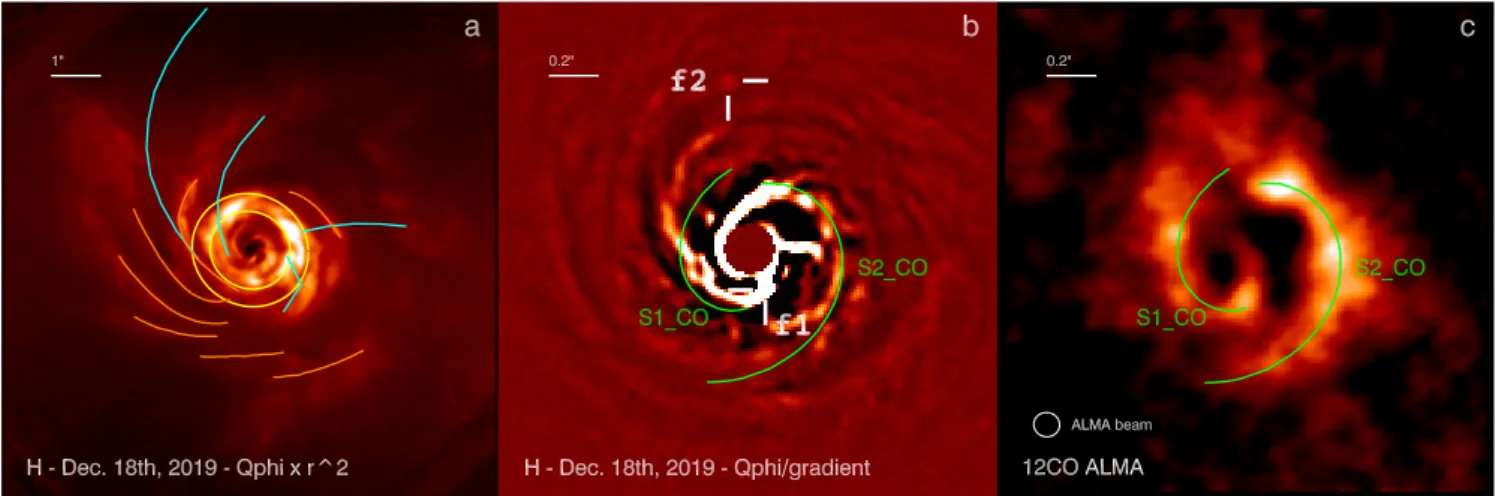
Fig. 2.Full-field polarimetric image (same as in Fig.1, Qφ× r2) displayed in panel a, on top of which several structures previously detected are overlaid:Hashimoto et al.(2011) spirals (orange lines), out of plane accreting spirals fromTang et al.(2012; blue lines), and the dust ring (yellow ellipses) from the 0.9 mm ALMA image (Tang et al. 2017). The inner spiral arms (S1_CO, S2_CO) detected byTang et al.(2017) are superimposed to the SPHERE polarimetric image Qφ, further processed with a gradient algorithm to enhance the inner spirals (b), and the ALMA CO map (c), in a 200
field of view. Features f1 and f2 are discussed in Sect.4. North is up, east is left.
The position of the ring detected with ALMA in the contin-uum (Tang et al. 2017) is shown in Fig.2a. In the sub-mm, it encompasses an elliptical region oriented at about 60◦ north to
east, from a minimal radius of 0.7700 to a maximal separation of 1.1900, corresponding to a ring of ∼140 au on average (yellow
ellipses in Fig.2a). The aspect ratio is consistent with an incli-nation of 30◦. In scattered light, the ring is not homogeneous
with brighter parts in the west and the northeast, as opposed to the smooth 1.3 mm image, which instead peaks to the south-west. SPHERE resolves some structures in the ring that were already reported in scattered light byOppenheimer et al.(2008) and Hashimoto et al. (2011). In particular, a depleted region in the polarized flux, formerly reported by Oppenheimer et al. (2008), is also observed at PA= 343◦ although the contrast is
low and its visibility is mostly a matter of intensity cut. We do not detect any point-source at this location, confirming the find-ings ofPerrin et al.(2009).
Outward of the ring, there are several spiral-like structures which, given the sensitivity achieved with SPHERE DPI, could in fact be the trace of one single grand spiral with several ramifi-cations. This pattern likely starts from the south and rolls clock-wise while it gets broader with manifold branches (Fig.1a). It is particularly pronounced at the east and matches well to all the spirals identified in 2009 H-band data by Hashimoto et al. (2011) at Subaru (orange lines in Fig.2a), indicating no percep-tible motion in ten years, as already concluded byLomax et al. (2016) on a shorter timescale. Therefore, this pattern is unlikely to be driven by planets inside the ring. Out-of-plane CO spirals (Tang et al. 2012), which have no obvious counterpart in scat-tered light, are indicated in cyan (Fig.2a).
Inward of the ring (<0.600), we detect two main spirals (S1 and S2 in Fig.1b), starting as close as the edge of the coron-agraphic mask (about 95 mas in radius) and in good agreement with the CO spirals identified by Tang et al.(2017, and shown as green lines labeled S1_CO and S2_CO in Figs.2b, c). The angular resolution brought by SPHERE evidences that the two inner spirals seem to intersect at the south of the star exactly at the location of an intensity peak (ρ = 0.2100, PA= 177.7◦), which itself is found at a very similar position than the CO peak. S2 matches well the western CO spiral, while S1 seems to devi-ate from the eastern CO spiral. We suspect that this mismatch is due to the difference of angular resolution, which for ALMA is
about 0.1100, while SPHERE provides in H band a resolution of
0.0400. As a consequence, it is difficult to disentangle S1 from S2 at the north in the CO map. S2 is more diffuse than S1 and appears larger in the west. High-pass filtering of the polarimet-ric image (Fig.2b) shows higher complexity with clumps and several arms.
While the CO map contains a cavity inward of the CO spirals the SPHERE observations reveal a third component (PA ∼ 270◦ in Fig.1b) connecting the center of the image to S2, as a kind of “bridge” of 25−30 au long. This is not a post-processing artifact since this feature is seen both in the polarimetry image and in the total intensity ADI image, and was in fact already distinguish-able inHashimoto et al.(2011), but also in the gas line HCO+ (Rivière-Marichalar et al. 2019). Whether it is a true connection or a projection effect cannot be determined with these observa-tions alone. On each side of the “bridge”, the polarized intensity is rather low, even lower than in between the spiral arms. Inter-estingly, in the direction of this feature the intensity of the spiral S2 and of the ring is fainter, possibly tracing a shadow pattern. If so, it will favor a feature near the midplane of the disk. Finally, S1 shows an increase of its width at PA ∼ 115◦ as a compact
clump that is ∼0.1200 long (Figs. 1b and 2b), complementary images are displayed in AppendixA.
4. Point-like sources
Many structures are observed in the disk but two features have a strong interest. The first one (f1) is the strongest signal in Figs.1b and c, south of the coronagraphic mask edge, and a sec-ond one (f2) is a nearly point source further out to the north. Interestingly, both show up in DPI and ADI images (Fig. 3). They are also detected at the second epoch in total intensity (ADI), but with a much lower signal to noise ratio (Fig.A.1).
We extracted the photometry and astrometry with SpeCal. The positions of the sources are based on the ADI reduction using the PCA 5 modes algorithm (Fig.2b) and the negative fake planet injection method (for details seeGalicher et al. 2018), but the values are consistent within error bars for all algorithms. f1 is located at ρ = 0.160 ± 0.00600, PA = 203.9 ± 2.9◦. It coin-cides with the root of the eastern spiral identified as S1 in the ALMA image, where the two spirals S1 and S2 observed with SPHERE appear to intersect. The shape of this feature in the Qφ
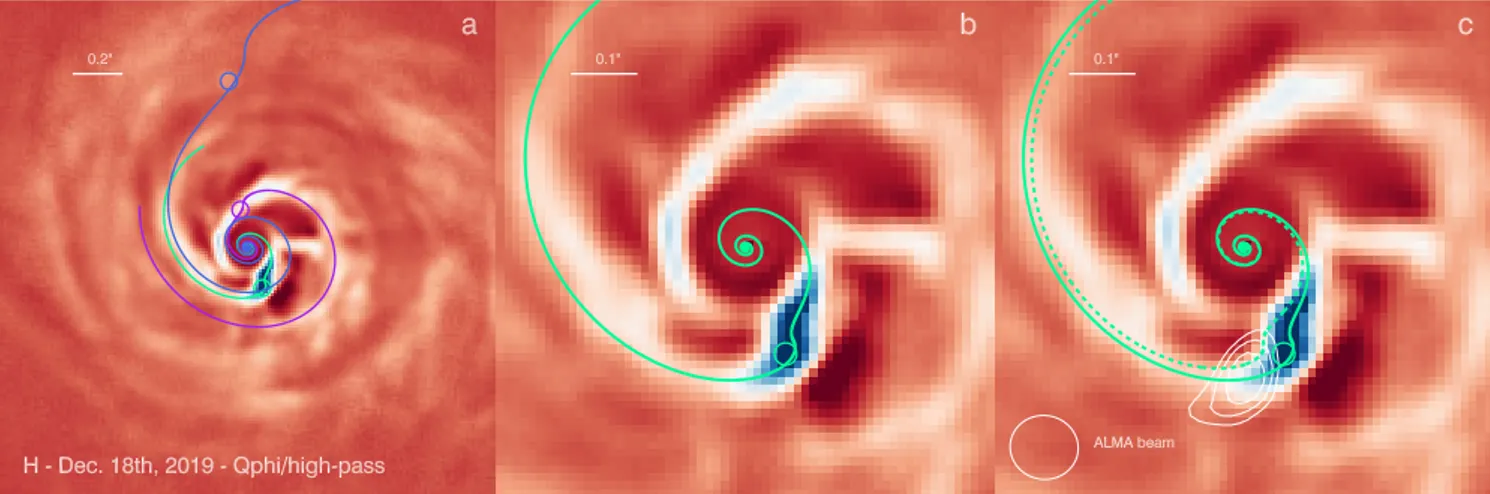
intensity has been high-pass filtered and multiplied with the stellocen-tric distance (Qφ× r).
image (Fig.3a) is remarkable and we discuss it further in the next section. The second source, f2, lies at the very edge of the dust ring inside the cavity, in the prolongation of the eastern spiral. Its position is ρ= 0.681 ± 0.00600, PA= 7.6 ± 1.8◦.
Feature f1 is elongated while f2 is nearly point-like. This characteristic is confirmed by the photometric analysis. The con-trast relative to the star derived from IRDIS data in the H band and measured at f1 is quite variable from one ADI reduction to another, ranging from 6.5±0.8×10⁻⁴to 6.8±0.6×10⁻⁵,
depend-ing on the effectiveness (ability to suppress the starlight) of the ADI algorithm.
Similarly, the photometry in the K1K2 IRDIS image obtained at the second epoch varies from one ADI reduction to the other, but with a small difference of contrast between the two narrow band filters: 3.4 ± 0.5 × 10⁻⁴and 4.3 ± 0.5 × 10⁻⁴, respectively. Whether it is indicative of a red color remains to be confirmed with higher quality data in the K band. Overall, we cannot consider the total intensity contrast measurements of f1 reliable as it cannot be assimilated to a point source. On the other hand, f2 has a stable contrast in the H band of 4.9 ± 0.5 × 10⁻⁶,
and 4.8 ± 0.8 × 10⁻⁶in K1K2, indicative of a bona-fide point
source, but with a grey color. Photometric measurements with the IFS (not shown here) in the YJH bands are not much more conclusive regarding f1, while f2 is actually not detected.
The fact that f1 and f2 are detectable in polarimetry and total intensity strongly suggests that these signals cannot result from the photosphere of some protoplanets. Instead, they are likely to be the telltale of dust particles detected from scatter-ing or from other thermally induced mechanisms.
5. Spirals
The presence of spiral arms in protoplanetary disks has been usually associated to the indirect clues of planets provided that the disks are not massive enough to undergo self-gravity (Muto et al. 2012;Boccaletti et al. 2013;Benisty et al. 2015, for instance). This link with a gravitational perturber has never been definitely established, except for the prominent spiral arms in HD 100453, very likely launched by a stellar M-dwarf compan-ion (Dong et al. 2016). In that respect, the ALMA observations of AB Aur (Tang et al. 2017) are likely the only case, together with GG Tau A (Phuong et al. 2020), to provide a strong suspi-cion for the presence of a protoplanet associated to spiral arms.
To model the morphology of the inner spirals we rely on the formulation of Muto et al.(2012) described in AppendixB. A
the plane of the sky and are known to some level of accu-racy. Therefore, the solutions presented here provide qualita-tive results, which may not be unique. We note, in particular, a degeneracy between the inclination, the disk scale-height, and the radial distance of the putative planet, whereas the flaring index has only a weak impact on the shape of the projected spi-ral.
To account for S1 we considered two cases for which we forced a planet to be located close to the positions of the features discussed in Sect.4. A planet located at rc= 0.18400, θ0= 196.8◦
(in the orbital plane of the disk) reproduces the shape of the spi-ral and is also in accordance with the location of f1 as seen in Figs.4a, and b (green line). The analytical model of Eq. (B.1), while simple, matches the “S” shape expected for a spiral den-sity wave surprisingly well as it goes on to trigger the accretion of gas onto a protoplanet. On the contrary, imposing the planet location at f2 matches only the external part of the spiral S1 (blue line in Fig.4a). For comparison, the contours of the CO peak in the ALMA image is shown in Fig.4b. Being localized at the surface, the spiral twists appear slightly offset from the perturber positions (circles), which are in the midplane.
For the western spiral S2, since there is no obvious features nor strong signal which we can consider as a source, we blindly searched for the best matching model. The purple line in Fig.4a corresponds to rc = 0.17200, θ0 = 6.0◦. This model reproduces
well the external part of the western spiral, which presents a more diffuse aspect or broader shape than the eastern one, but it fails to match the innermost, eastern arm which is less tightly wound as it approaches the occulting spot (0.100< r < 0.1600).
6. Discussions
We provide a further exploratory analysis of the two identified objects, noting that they have both been detected in polarimetry and total intensity.
The object labeled f1 is fitting the source of the S1 spiral which at this location features an “S” shape, suggestive of the stationary pattern composed of inward and outward spiral den-sity waves excited by the gravitational potential of an accreting protoplanet (see Kley & Nelson 2012, for a review). The spi-rals are trailing, as predicted by theory, since the near side is the southeast part of the disk (Fukagawa et al. 2004) and the resolved velocity field (Piétu et al. 2005) implies that the disk rotates counterclockwise. However, it is not a straightforward exercise to determine whether the signal is from pure scattering (polarized) or a mix of scattering and emission (usually unpo-larized).Zhu(2015) has calculated the spectral energy distribu-tion emitted from an accreting circumplanetary disk, which can be compared to our photometric measurements, assuming the
Fig. 4.Same data as Fig.3with three different models of spirals matching S1 (green and blue lines) and S2 (purple line). The positions of the perturbers are indicated with a circle (panel a). Panel b: zoom in version of panel a, where only the best model reproducing the spiral twist in S1 is shown. Panel c: the contours of the CO map at the location of the candidate protoplanet are overlaid, together with the spiral model offset by 14.1◦
(dashed green line), corresponding to the 4 yr timelapse between ALMA and SPHERE observations.
signal of f1 is dominated by emission. The luminosity varies as the product of the planet mass with the accretion rate, and also depends on the inner radius of the circumplanetary disk. These three parameters necessarily lead to a high degree of degeneracy. Although it is difficult to overcome the ADI bias in total inten-sity measured for the particular case of f1, as it is not point-like, we measured a minimum contrast of 6.5 × 10⁻⁴in the H band.
If we assume a moderate accretion rate of 10−8M yr−1 as in
Zhu(2015), it translates into a planet mass of 4 − 13MJ. We note
that the accretion rates estimated for PDS 70b are orders of mag-nitude lower (Haffert et al. 2019;Hashimoto et al. 2020), which then would imply stellar mass for f1. As a consequence, the flux of f1 is likely not to be dominated by thermal emission.
On the contrary, the object f2 is not directly associated to a spiral, so we assume its flux can be attributed to pure scat-tering. Mass constraints can be derived from dynamical argu-ment. Indeed, the inner edge of the disk cavity at ∼140 au can be sculpted by the chaotic zone of a planetary mass object. Assum-ing a circular orbit for the sake of simplicity,Wisdom (1980) provides a relation between the planet/star mass ratio, and the inner edge/planet distance ratio, from which we derived a mass of ∼3 MJ. The AB Aur cavity is very large, such that, if resulting
from dynamical interplay with planets, several bodies including f1 should be involved.
Finally, the object f1 appears rotated counterclockwise from the CO peak in the ALMA image which, considering the stellar mass, the 4 yr interval, and the physical stellocentric distance of f1, is in excellent agreement with the expected rotation (14.1 ± 1.1◦in the orbital plane) of the spiral due to the Keplerian motion
of the protoplanet candidate (Fig.4c). However, the peak of the CO emission is at a radial distance slightly larger than expected. There are a few technical reasons accounting for this difference, which remain to be investigated thoroughly. Nevertheless, to our knowledge, this is the first time that we can confidently associate the rotation of a spiral pattern with the orbital motion of a planet candidate, which reinforces our confidence in the nature of the detected spiral twist.
In conclusion, the SPHERE observations of AB Aur in scat-tered light combined to the ALMA data in the thermal regime provide strong evidence that we are actually witnessing ongo-ing planet formation revealed by its associated spiral arms. Fur-ther observations would be required to confirm this result and to derive better mass estimates for potential planets in this location.
Acknowledgements. French co-authors acknowledge financial support from the Programme National de Planétologie (PNP) and the Programme National de Physique Stellaire (PNPS) of CNRS-INSU in France. This work has made use of the SPHERE Data Centre, jointly operated by OSUG/IPAG (Grenoble), PYTHEAS/LAM/CESAM (Marseille), OCA/Lagrange (Nice) and Observatoire de Paris/LESIA (Paris). We thank P. Delorme (SPHERE Data Centre) for his efficient help during the data reduction process. YWT acknowledges support through MoST grant 108-2112-M-001-004-MY2. ALM acknowledges the finan-cial support of the F.R.S-FNRS through a postdoctoral researcher grant.
References
Bae, J., & Zhu, Z. 2018,ApJ, 859, 118
Benisty, M., Juhasz, A., Boccaletti, A., et al. 2015,A&A, 578, L6
Beuzit, J. L., Vigan, A., Mouillet, D., et al. 2019,A&A, 631, A155
Bhowmik, T., Boccaletti, A., Thébault, P., et al. 2019,A&A, 630, A85
Boccaletti, A., Pantin, E., Lagrange, A. M., et al. 2013,A&A, 560, A20
Christiaens, V., Casassus, S., Perez, S., van der Plas, G., & Ménard, F. 2014,ApJ, 785, L12
Clampin, M., Krist, J. E., Ardila, D. R., et al. 2003,AJ, 126, 385
Claudi, R., Beuzit, J. L., Feldt, M., et al. 2008,Eur. Planet. Sci. Congr., 2008, 875
de Boer, J., Langlois, M., van Holstein, R. G., et al. 2020,A&A, 633, A63
Delorme, P., Meunier, N., Albert, D., et al. 2017,Proc. SF2A, 347
DeWarf, L. E., Sepinsky, J. F., Guinan, E. F., Ribas, I., & Nadalin, I. 2003,ApJ, 590, 357
di Folco, E., Dutrey, A., Chesneau, O., et al. 2009,A&A, 500, 1065
Dohlen, K., Langlois, M., Saisse, M., et al. 2008, inProc. SPIE, eds. I. S. McLean, & M. M. Casali, 118
Dong, R., Zhu, Z., Rafikov, R. R., & Stone, J. M. 2015,ApJ, 809, L5
Dong, R., Zhu, Z., Fung, J., et al. 2016,ApJ, 816, L12
Fukagawa, M., Hayashi, M., Tamura, M., et al. 2004,ApJ, 605, L53
Fukagawa, M., Tamura, M., Itoh, Y., et al. 2006,ApJ, 636, L153
Gaia Collaboration (Brown, A. G. A., et al.) 2018,A&A, 616, A1
Galicher, R., Boccaletti, A., Mesa, D., et al. 2018,A&A, 615, A92
Grady, C. A., Woodgate, B., Bruhweiler, F. C., et al. 1999,ApJ, 523, L151
Grady, C. A., Polomski, E. F., Henning, T., et al. 2001,AJ, 122, 3396
Gressel, O., Nelson, R. P., Turner, N. J., & Ziegler, U. 2013,ApJ, 779, 59
Haffert, S. Y., Bohn, A. J., de Boer, J., et al. 2019,Nat. Astron., 3, 749
Hashimoto, J., Tamura, M., Muto, T., et al. 2011,ApJ, 729, L17
Hashimoto, J., Aoyama, Y., Konishi, M., et al. 2020,AJ, 159, 222
Isella, A., Natta, A., Wilner, D., Carpenter, J. M., & Testi, L. 2010,ApJ, 725, 1735
Juhasz, A., benisty„ M., Pohl, A., et al. 2015,MNRAS, 451, 1147
Kadam, K., Vorobyov, E., Regály, Z., Kóspál, Á., & Ábrahám, P. 2019,ApJ, 882, 96
Kley, W., & Nelson, R. P. 2012,ARA&A, 50, 211
Li, D., Pantin, E., Telesco, C. M., et al. 2016,ApJ, 832, 18
Lomax, J. R., Wisniewski, J. P., Grady, C. A., et al. 2016,ApJ, 828, 2
Maire, A.-L., Langlois, M., Dohlen, K., et al. 2016,Proc. SPIE, 9908, 990834
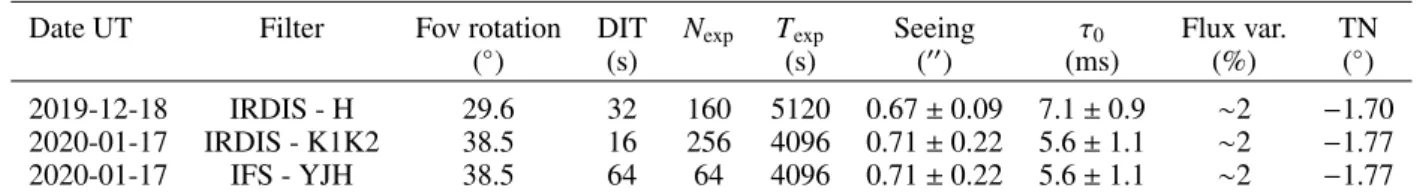
exp exp 0
(◦) (s) (s) (00) (ms) (%) (◦)
2019-12-18 IRDIS - H 29.6 32 160 5120 0.67 ± 0.09 7.1 ± 0.9 ∼2 −1.70
2020-01-17 IRDIS - K1K2 38.5 16 256 4096 0.71 ± 0.22 5.6 ± 1.1 ∼2 −1.77
2020-01-17 IFS - YJH 38.5 64 64 4096 0.71 ± 0.22 5.6 ± 1.1 ∼2 −1.77
Notes. The table lists (left to right columns): the date of observations in UT, the filters combination, the amount of field rotation in degrees, the individual exposure time (DIT) in seconds, the total number of exposures, the total exposure time in seconds, the DIMM seeing measured in arcseconds, the correlation time τ0in milliseconds, the variation of the flux during the sequence in %, and the true north (TN) offset in degrees.
Fig. A.1.Complementary images of the AB Aur system. (a) ADI image (H band) in a large field of view (1000
) multiplied with the square of the stellocentric distance. (b) High-pass filtering (gradient) of the DPI image to enhance the spirals S1 and S2. (c) Second epoch ADI observations in the K1K2 filters.
Appendix B: Expression of a spiral arm
According to the theory of density waves generated by a gravitational perturber (Rafikov 2002) in protoplanetary disks, Muto et al. (2012) proposed an approximate linear relation to describe the shape of a spiral θ(r), as a function of the planet location (rc, θ0) and disk properties, as follows:
θ(r) = θ0− sgn(r − rc) hc × r rc !1+β( 1 1+ β − 1 1 − α+ β r rc !−α) − 1 1+ β− 1 1 − α+ β !# , (B.1)
where hcis the disk aspect ratio at the planet location, α and β
are the power-law exponents of the angular frequency and tem-perature profile dependence with r. In this paper, we assumed α = 1.5 for the Keplerian velocity and β = 0.25 to account for the temperature profile which varies as r−2β.
This formulation is now commonly used to interpret high-contrast images in which spiral patterns are observed, but it involves a number of assumptions, in particular, the idea that small grains observed in scattered light are coupled to the gas and that a single planet induces a single spiral arm. Clearly, this is not always supported by hydro-dynamical simulations, which result in much more complex morphologies. In a more realistic situation, a planet could produce several spiral arms (Dong et al. 2015) or planet formation could inevitably lead to multiple cores and, hence, to manifold spirals (Kadam et al. 2019).