J. Dairy Sci. 94 :4152–4163 doi: 10.3168/jds.2010-4108
© American Dairy Science Association®, 2011 .
ABSTRACT
The objective of this study was to assess the pheno-typic and genetic variability of production traits and milk fatty acid (FA) contents throughout lactation. Genetic parameters for milk, fat, and protein yields, fat and protein contents, and 19 groups and individual FA contents in milk were estimated for first-parity Holstein cows in the Walloon Region of Belgium using single-trait, test-day animal models and random regressions. Data included 130,285 records from 26,166 cows in 531 herds. Heritabilities indicated that de novo synthe-sized FA were under stronger genetic control than FA originating from the diet and from body fat mobiliza-tion. Estimates for saturated short- and medium-chain individual FA ranged from 0.35 for C4:0 to 0.44 for C8:0, whereas those for monounsaturated long-chain individual FA were lower (around 0.18). Moreover, de novo synthesized FA were more heritable in mid to late lactation. Approximate daily genetic correlations among traits were calculated as correlations between daily breeding values for days in milk between 5 and 305. Averaged daily genetic correlations between milk yield and FA contents did not vary strongly among FA (around −0.35) but they varied strongly across days in milk, especially in early lactation. Results indicate that cows selected for high milk yield in early lactation would have lower de novo synthesized FA contents in milk but a slightly higher content of C18:1 cis-9, indi-cating that such cows might mobilize body fat reserves. Genetic correlations among FA emphasized the combi-nation of FA according to their origin: contents in milk of de novo FA were highly correlated with each other (from 0.64 to 0.99). Results also showed that genetic correlations between C18:1 cis-9 and other FA varied strongly during the first 100 d in milk and reinforced the statement that the release of long-chain FA inhibits FA synthesis in the mammary gland while the cow is in negative energy balance. Finally, results showed that the FA profile in milk changed during the lactation
phenotypically and genetically, emphasizing the rela-tionship between the physiological status of cow and milk composition.
Key words: fatty acid , genetic correlation , milk fat , random regression
INTRODUCTION
Fat is one of the most variable components of bovine milk. In recent years, the detailed study of milk fat composition has been increasing because of 2 major con-cerns. First, milk composition reflects the metabolism and the environment of the cow. Milk fat composition is thought to be related to the energy status of the cow: negative energy balance is associated with an increase in C16:0 and C18:0, which suggests mobilization of body fat reserves (Stoop et al., 2009). In addition, Chilliard et al. (2009) investigated the effect of 3 different physi-cal forms of linseed fatty acids (FA) on cow dairy per-formance, and milk FA secretion and composition, and their relationship with methane eructed by cows. They observed strong correlations between the concentration of some FA in milk fat and methane eructed by dairy cows, indicating that milk FA profile can be considered a potential indicator of in vivo methane output in ru-minants. Second, milk is a consumer product and its composition influences its economic value as well as its nutritional, technological, and sensory qualities. Some FA are known to have potential beneficial effects (e.g., the anticarcinogenic properties of C18:2 cis-9,trans-11; Moate et al., 2007) or potential deleterious effects (e.g., the hypercholesterolemic effects of C16:0; Grummer, 1991) on human health. Moreover, Palmquist et al. (1993) indicated that an increasing C18:2 content made butter softer, but milk with more than 20% of C18:2 was not acceptable regarding sensory quality. In such milks, off-flavors were predominantly of an oxidized type, whereas significant oxidized flavor was absent in freshly drawn milk.
Because of these multiple interests, better knowledge of the sources of variation of milk fat composition is the first step to enhance the wide use of this information by the dairy industry and dairy farmers. Several studies reported feeding effects on milk fat composition
Phenotypic and genetic variability of production traits and milk fatty acid
contents across days in milk for Walloon Holstein first-parity cows
C. Bastin ,*1 N. Gengler ,*† and H. Soyeurt *†
* University of Liège, Gembloux Agro-Bio Tech, Animal Science Unit, B-5030 Gembloux, Belgium † National Fund for Scientific Research (F.R.S.-FNRS), B-1000 Brussels, Belgium
Received December 20, 2010. Accepted March 31, 2011.
VARIABILITY IN PRODUCTION TRAITS AND MILK FATTY ACID CONTENTS
mer, 1991; Chilliard et al., 2001) but only a few studies have investigated genetic effects on milk FA profiles (Karijord et al., 1982; Bobe et al., 2008; Stoop et al., 2008). These studies were generally based on a limited number of records because the reference analysis for milk FA, gas chromatography, requires skilled staff and is expensive and time-consuming. However, recent studies (Soyeurt et al., 2006, 2011; Rutten et al., 2009) confirmed the potential of using mid-infrared spectrom-etry to quantify FA contents in cow milk. Because of its use by regular milk recording and its proven robustness (Soyeurt et al., 2011), this technology offers the pos-sibility of investigating genetic variability of milk FA on large data sets containing repeated records per cow. Such data sets allow the use of random regression mod-els to assess the evolution of genetic parameters within the lactation. Although changes in genetic parameters over lactation have been previously suggested (Mele et al., 2009), few authors have investigated the evolution of heritabilities and genetic correlations among produc-tion traits and FA contents across a lactaproduc-tion (Soyeurt et al., 2008). However, such studies present an opportu-nity to better understand the genetic effects on milk FA contents toward the global objective of selecting dairy cows on the milk FA profile.
Therefore, the objective of this research was to esti-mate the genetic parameters of milk, fat, and protein yields, fat and protein contents, and 19 groups and in-dividual FA contents in milk predicted by mid-infrared spectrometry for first-parity cows in the Walloon Region of Belgium using random regression test-day animal models. The potential relationship between the energy status of the cow and the phenotypic and genetic vari-abilities of FA throughout lactation was also considered in the discussion of the results. This study is part of a larger project titled RobustMilk (www.robustmilk.eu) aimed at developing genetic evaluation for FA contents in milk and allowing dairy farmers to select cows that produce milk with a desirable FA profile.
MATERIALS AND METHODS Data Editing
Daily milk yield (kg), fat yield (kg), protein yield (kg), fat content (g/dL of milk), and protein content (g/dL of milk) of Holstein cattle were extracted from the edited database used for the Walloon genetic evalu-ation of production traits and that included records since 1974. This database included cows with known birth dates. Cows presenting unlikely ages for a given lactation were excluded. Production records ranged between 5 and 365 DIM. Only first-lactation records
where observations were from 3 to 85 kg for milk yield, from 1 to 7% for protein content, and from 1.5 to 9% for fat content were used for the calculations.
In the Walloon Region of Belgium, milk samples are collected through milk recording, which is organized by the Walloon Breeding Association (Ciney, Belgium). The samples are analyzed by using a mid-infrared MilkoScan FT6000 spectrometer (Foss, Hillerød, Den-mark) by the milk laboratory Comité du Lait (Battice, Belgium) to quantify fat and protein contents. The stor-age of spectral data generated during the mid-infrared analysis was undertaken in 2005 at an experimental level. Since January 2007, most of the spectral data of milk recording samples have been included in the spec-tral database. Data for FA contents in milk (g/dL) used in this study (Table 1) were predicted by applying the calibration equations developed by Soyeurt et al. (2011) on the spectral database. It should be noted that not all FA contents are predicted with the same accuracy by mid-infrared spectrometry. Therefore, to give indi-cations of the accuracy of the predicted FA contents, the coefficient of determination of the cross-validation (R2cv) and the ratio of the standard deviation of the data used to build the calibration equation (i.e., GC data) to the standard error of the cross-validation (RPD) are provided in Table 1 (further details are provided in Soyeurt et al., 2011). The prediction can be considered reliable if the RPD is >3 (Williams, 2007). Based on this criterion, predictions for 19 of the 29 pre-dicted groups and individual FA obtained by Soyeurt et al. (2011) were used. An exception was the group of polyunsaturated fatty acids (PUFA) with a RPD close to 3 (2.6). This group was included in the analysis because of its usefulness to perform a first screening of the studied dairy cow population and to provide pre-liminary genetic parameters.
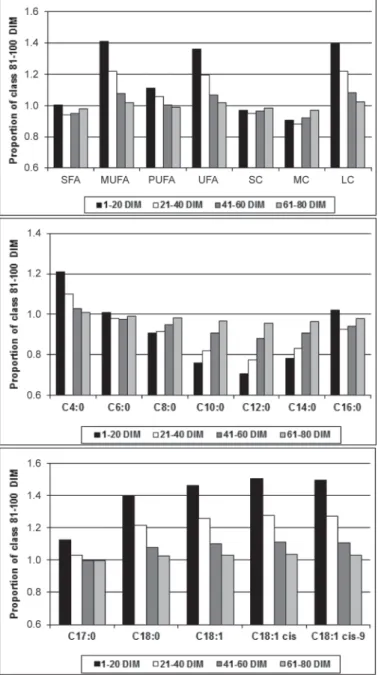
All of the 19 predicted individual FA or groups of FA are listed in Table 1. The 7 major FA groups are saturated (SFA), unsaturated (UFA), monounsatu-rated (MUFA), PUFA, short-chain fatty acids (SC) including FA with 4 to 10 carbons, medium-chain fatty acids (MC) including FA with 12 to 16 carbons, and long-chain fatty acids (LC) including FA with 17 to 22 carbons. To eliminate potentially abnormal records, FA values below the first percentile and above the 99th percentile were deleted. Percentiles were calculated us-ing the PROC UNIVARIATE in SAS (SAS Institute Inc., Cary, NC). Descriptive statistics of data after the preliminary edits are presented in Table 1. The pat-tern of average FA contents in milk at the classes of DIM 1–20, 21–40, 41–60, and 61–80 as a proportion of those occurring at class 81–100 DIM is shown in Figure 1. Class 81–100 DIM was chosen as standard because
BASTIN ET AL.
trends of FA concentrations in milk across the lactation were more variable during the first 100 DIM and more stable after that threshold.
For the estimation of variance components, cows were required to have all production and FA records for at least 3 test-days. Herds with fewer than 12 test dates across the data set were deleted. Moreover, re-cords were deleted for a given herd × test-day if fewer than 5 records were available. Descriptive statistics of the data set after this second editing are shown in Table 1. Finally, the data set for the variance compo-nents estimation included 130,285 records from 26,166 cows in 531 herds collected between January 2007 and October 2010. Pedigree data were extracted from the database used for the official Walloon genetic evalua-tion and were limited to animals born after 1985. The final pedigree file included 73,749 animals.
Model and Genetic Parameter Estimation
The applied model was based on the official Wal-loon genetic evaluation model for production traits as described by Croquet et al. (2006). Variances and heri-tabilities were estimated for the 24 studied traits using
single-trait random regression animal test-day models. The following model was used:
y = Xβ + Q(Wh + Zp + Za) + e,
where y was the vector of observations for 1 of the 24 studied traits; β was the vector of the following fixed effects: herd × test-day, gestation stage, minor lactation stage (classes of 5 DIM), and major lactation stage (classes of 73 DIM) × age at calving × season of calving; h was the vector of herd × period of calving random regression coefficients; p was the vector of per-manent environmental random regression coefficients;
a was the vector of additive genetic random regression coefficients; e was the vector of residuals; X, W, and
Z were incidence matrices assigning observations to ef-fects; and Q was the covariate matrix for second-order Legendre polynomials.
Random effects were assumed to be normally dis-tributed and residual variances were assumed to be independent and constant over the lactation. Variance components estimation was performed using average information REML (AI-REML; Misztal, 2010). Priors of variance components were estimated by expectation
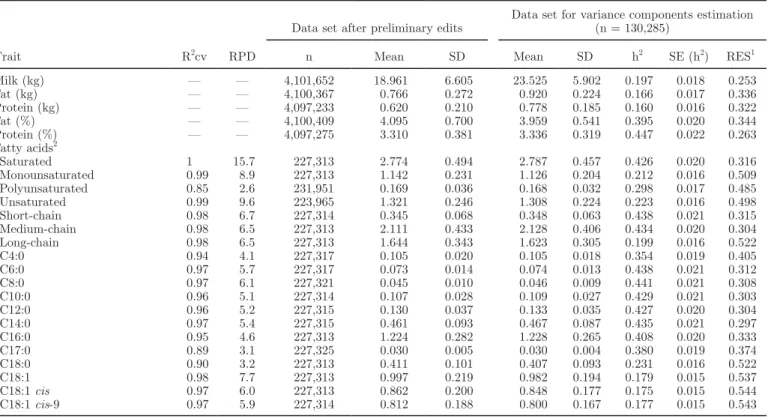
Table 1. Descriptive statistics of the data set after preliminary edits and of the data set used for variance components estimation
Trait R2cv RPD
Data set after preliminary edits
Data set for variance components estimation (n = 130,285)
n Mean SD Mean SD h2 SE (h2) RES1
Milk (kg) — — 4,101,652 18.961 6.605 23.525 5.902 0.197 0.018 0.253 Fat (kg) — — 4,100,367 0.766 0.272 0.920 0.224 0.166 0.017 0.336 Protein (kg) — — 4,097,233 0.620 0.210 0.778 0.185 0.160 0.016 0.322 Fat (%) — — 4,100,409 4.095 0.700 3.959 0.541 0.395 0.020 0.344 Protein (%) — — 4,097,275 3.310 0.381 3.336 0.319 0.447 0.022 0.263 Fatty acids2 Saturated 1 15.7 227,313 2.774 0.494 2.787 0.457 0.426 0.020 0.316 Monounsaturated 0.99 8.9 227,313 1.142 0.231 1.126 0.204 0.212 0.016 0.509 Polyunsaturated 0.85 2.6 231,951 0.169 0.036 0.168 0.032 0.298 0.017 0.485 Unsaturated 0.99 9.6 223,965 1.321 0.246 1.308 0.224 0.223 0.016 0.498 Short-chain 0.98 6.7 227,314 0.345 0.068 0.348 0.063 0.438 0.021 0.315 Medium-chain 0.98 6.5 227,313 2.111 0.433 2.128 0.406 0.434 0.020 0.304 Long-chain 0.98 6.5 227,313 1.644 0.343 1.623 0.305 0.199 0.016 0.522 C4:0 0.94 4.1 227,317 0.105 0.020 0.105 0.018 0.354 0.019 0.405 C6:0 0.97 5.7 227,317 0.073 0.014 0.074 0.013 0.438 0.021 0.312 C8:0 0.97 6.1 227,321 0.045 0.010 0.046 0.009 0.441 0.021 0.308 C10:0 0.96 5.1 227,314 0.107 0.028 0.109 0.027 0.429 0.021 0.303 C12:0 0.96 5.2 227,315 0.130 0.037 0.133 0.035 0.427 0.020 0.304 C14:0 0.97 5.4 227,315 0.461 0.093 0.467 0.087 0.435 0.021 0.297 C16:0 0.95 4.6 227,313 1.224 0.282 1.228 0.265 0.408 0.020 0.333 C17:0 0.89 3.1 227,325 0.030 0.005 0.030 0.004 0.380 0.019 0.374 C18:0 0.90 3.2 227,313 0.411 0.101 0.407 0.093 0.231 0.016 0.522 C18:1 0.98 7.7 227,313 0.997 0.219 0.982 0.194 0.179 0.015 0.537 C18:1 cis 0.97 6.0 227,313 0.862 0.200 0.848 0.177 0.175 0.015 0.544 C18:1 cis-9 0.97 5.9 227,314 0.812 0.188 0.800 0.167 0.177 0.015 0.543 1
RES was defined as the daily ratio of residual variance to the total variance averaged across the entire lactation.
2For fatty acids, the coefficient of determination of the cross-validation (R2cv) and the ratio of the standard deviation of the data used to build
the calibration equation to the standard error of cross-validation (RPD; Soyeurt et al., 2011) are also presented as an indication of prediction accuracy.
VARIABILITY IN PRODUCTION TRAITS AND MILK FATTY ACID CONTENTS
maximization REML (EM-REML; Misztal, 2010) us-ing sus-ingle-trait random regression models on a reduced data set (about 68,000 records from 16,000 cows).
Daily variances were estimated and daily heritabili-ties were defined as the ratio of the genetic variance to the total variance for each day between 5 and 305 DIM. The daily ratio of residual variance to the total variance (RES) was also calculated for every trait. Standard
errors of daily variance and heritability estimates were calculated using the method presented by Fischer et al. (2004) based on variance estimates from the average information inverse matrix of the AI-REML output file. Average daily variances, heritabilities, RES, and their standard errors were defined as the average across the entire lactation.
Approximate daily genetic correlations were com-puted between traits using the following method. First, daily breeding values (EBVd) for each DIM between 5 and 305 and for cows with records were calculated as following: EBVdhtk a z m hkm tm = =
∑
0 2 ,where EBVdhtk was the daily breeding value of cow k, for
trait h, for each DIM t between 5 and 305; ahkm was the
random regression coefficient for the additive genetic effects; ztm was the covariate for Legendre polynomials
associated with DIM t; and zt0 = 1.0, zt1 = 3.0 0.5
x, zt2 =
5.00.5 (1.5x2 – 0.5), where x = 2[(t – 5)/300] – 1.
Second, daily genetic correlations between 2 traits were estimated as correlations between EBVd values of the 2 traits of interest for each DIM from 5 to 305. Finally, average daily correlations were defined as the average correlations across the entire lactation. For simplification, these correlations are called genetic correlations throughout this paper although they are correlations among EBVd values.
RESULTS AND DISCUSSION Data
Means and standard deviations of FA traits were similar between the data set after preliminary edits and the data set used for variance components estimation (Table 1). However, for milk, fat, and protein yields, means were higher in the final data set. This could be explained by the fact that the first data set included more years of data for milk, fat, and protein yields (years 1974–2010). Therefore, the mean was influenced by lower production in the past compared with the final data set (years 2007–2010).
On average, contents of individual FA in milk were in agreement with previous studies based on Walloon data (Soyeurt et al., 2007). Concerning the saturation of milk fat, values in Table 1 indicate that SFA was the most represented group of FA in milk, followed by MUFA and PUFA. This is in accordance with literature data indicating that typical milk fat from dairy cows contains approximately 70% SFA, 25% MUFA, and
Figure 1. Concentration of group and individual fatty acids in milk
[saturated (SFA), monounsaturated (MUFA), unsaturated (UFA), short-chain (SC), medium-chain (MC), long-chain (LC) fatty acids, C4:0, C6:0, C8:0, C10:0, C12:0, C14:0, C16:0, C17:0, C18:0, C18:1, C18:1 cis, and C18:1 cis-9] at the following classes of DIM: 1–20, 21–40, 41–60, and 61–80 as a proportion of their concentration at class 81–100 DIM.
BASTIN ET AL.
5% PUFA (Grummer, 1991). Concerning chain length, our results showed that the MC group was the most represented in milk, followed by LC and SC. This was expected because C14:0 and C16:0 are 2 of the major FA in milk (Jensen et al., 1991).
Variation of FA Contents in Milk over DIM
Figure 1 shows the pattern of FA contents in milk at different lactation stages until 100 DIM. It indicates that UFA, especially MUFA, were more variable than SFA throughout the lactation. Furthermore, LC were more variable than MC and SC. The evolution of phe-notypic milk FA contents across the lactation can be related to the cows’ physiology and notably to the en-ergy balance status. Three points are striking in Figure 1. First, at initiation of lactation, cows are in negative energy balance, causing mobilization of adipose FA and incorporation of these FA in milk (Palmquist et al., 1993). The FA stored as triglycerides in ruminant adipose tissue are mainly C16:0, C18:0, and C18:1 cis-9 (Chilliard et al., 2000). Figure 1 clearly shows the release of C18:0 and C18:1 cis-9 in early lactation (until around 80 DIM). Barber et al. (1997) also indicated that the FA composition of milk has a much higher proportion of C18 FA when lipolysis is high.
Second, concomitant with the release of adipose FA in milk, the high uptake of LC inhibits de novo syn-thesis of FA by mammary gland tissue (Palmquist et al., 1993) through the inhibition of acetyl-coenzyme A carboxylase, which catalyzes the synthesis of malonyl-CoA, a catabolic intermediate in FA synthesis. Figure 1 confirms this statement, as almost all C4:0 to C14:0 FA and approximately one-half of the C16:0 FA in milk are derived from de novo synthesis (Grummer, 1991). It shows further that the proportions of C8:0, C10:0, C12:0, and C14:0 were lower in early than later stages of lactation. As discussed by Palmquist et al. (1993), de novo synthesis is inhibited to different degrees in a pattern that shows increasing inhibition from C8:0 to C12:0. Furthermore, the synthesis of C4:0 is not inhibited, which is consistent with its origin from path-ways independent of the inhibitable acetyl-coenzyme A carboxylase pathway (Palmquist et al., 1993). The increasing inhibition with higher chain length is con-sistent with the condensation of acetyl units with a preformed 4-carbon primer. The formation of C6:0 re-quiring one acetyl unit addition via malonyl coenzyme A would be influenced less than longer chain FA, which would require increasing numbers of acetyl unit addi-tions (Palmquist et al., 1993).
Third, C16:0 did not show the same pattern in early lactation as LC or MC. This is probably due to its
double origin from de novo synthesis and circulating blood lipids (Grummer, 1991).
These results were in accordance with Kay et al. (2005), who showed that the week of lactation mark-edly affected the content of most individual milk FA. They indicated that as long as lactation progressed, the proportion of de novo (sum of C4:0 to C14:1) and mixed origin (sum of C16:0 to C16:1) FA increased, whereas preformed FA (sum of >C17:0) decreased.
Variances and Heritabilities
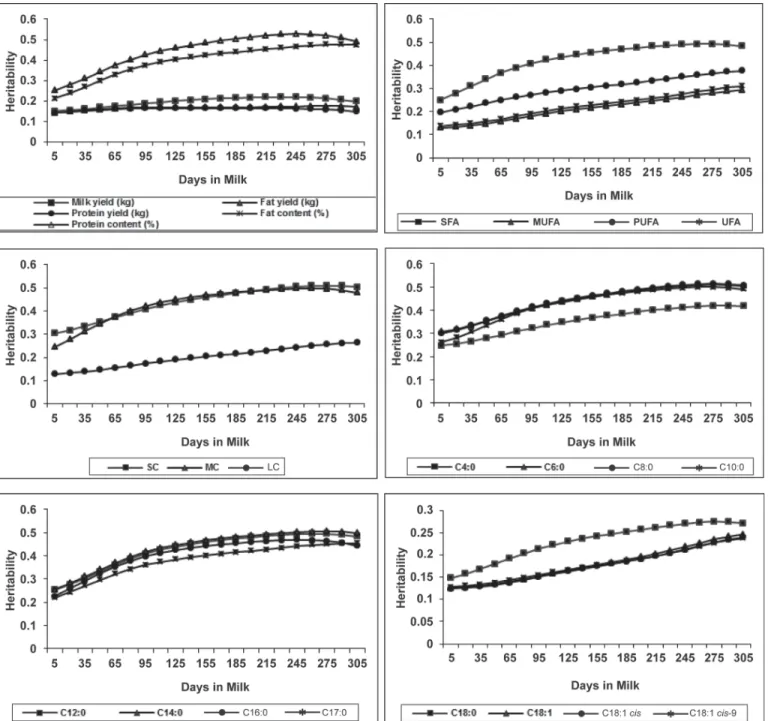
Average daily heritabilities for milk, fat, and protein yields were 0.197, 0.166, and 0.160, respectively (Table 1). Average daily heritabilities for fat and protein contents were higher than for yields: 0.395 and 0.447, respectively. These estimates were similar to averaged daily heritabilities (0.24 for milk yield, 0.37 for fat con-tent, and 0.46 for protein content) provided by H. Soy-eurt (unpublished data). Standard errors ranged from 0.015 to 0.022 (Table 1). Figure 2 depicts the evolution of heritabilities for milk, fat, and protein yields, and fat and protein contents over DIM, and shows that the latter 2 traits were more heritable in mid (around 180 DIM) to late lactation.
Concerning FA groups, estimates indicate that SFA were more heritable than UFA (Table 1). Heritabilities were 0.426 for SFA, 0.223 for UFA, 0.212 for MUFA, and 0.298 for PUFA. Furthermore, at the group level, heritability estimates decreased with FA chain length; averaged daily heritabilities were 0.438 for SC, 0.434 for MC, and 0.199 for LC. Heritabilities of the individual FA were in line with estimates of the FA groups: heri-tabilities of saturated short- and medium-chain indi-vidual FA ranged from 0.354 for C4:0 to 0.441 for C8:0, whereas heritabilities for monounsaturated long-chain individual FA were around 0.175 (Table 1).
The general pattern of the heritability estimates from this study was in line with results presented by Soyeurt et al. (2007), Bobe et al. (2008), and Stoop et al. (2008). These authors indicated that SFA and de novo synthesized FA had higher heritabilities than MUFA and PUFA. However, heritabilities estimated in this study were generally higher than those from Soy-eurt et al. (2007) on the same type of data. They were also higher than estimates from Karijord et al. (1982), Bobe et al. (2008), and Mele et al. (2009). However, a comparison of heritability estimates among studies is difficult for several reasons. First, definition of FA traits differed across studies: in the current research as well as in that of Soyeurt et al. (2007, 2008), FA contents were expressed in grams per deciliter of milk. Bobe et al. (2008) used FA traits expressed in grams
VARIABILITY IN PRODUCTION TRAITS AND MILK FATTY ACID CONTENTS
per liter of milk or in weight percentage (i.e., FA weight as a proportion of total fat weight), whereas Stoop et al. (2008) and Mele et al. (2009) expressed FA traits in weight percentage, and Karijord et al. (1982), who conducted one of the first studies in genetic variability of milk FA profile, estimated genetic parameters of FA concentrations in fat (g/100 g of fat). These studies suggested that the concentrations of FA in milk are
generally more heritable than those in milk fat. This is expected because the fat content of bovine milk is strongly heritable (Arnould and Soyeurt, 2009). Fur-thermore, the calibration equations from studies of Soyeurt et al. (2007, 2008) for the FA predictions were different and became more reliable with time due to the use of larger calibration data sets including greater variability of FA profile.
Figure 2. Daily heritabilities of milk, fat, and protein yields, fat and protein contents, and groups and individual fatty acid contents:
satu-rated (SFA), monounsatusatu-rated (MUFA), unsatusatu-rated (UFA), short-chain (SC), medium-chain (MC), long-chain (LC) fatty acids, C4:0, C6:0, C8:0, C10:0, C12:0, C14:0, C16:0, C17:0, C18:0, C18:1, C18:1 cis, and C18:1 cis-9.
BASTIN ET AL.
A second reason was the difference in the model used for estimating genetic parameters (e.g., sire or animal model, herd as random or fixed effect, inclusion of ran-dom regressions). Finally, Mele et al. (2009) indicated that differences in heritabilities among studies could be due to differences in the analytical methodology used for measuring FA contents. Most of the previously cited studies (Bobe et al., 2008; Stoop et al., 2008; Mele et al., 2009) used gas chromatography, whereas the cur-rent study used mid-infrared spectrometry. Therefore, Mele et al. (2009) suggested that the error variance of a trait might vary due to the analytical methodol-ogy used. However, the study presented by Stoop et al. (2008) and conducted on FA contents in fat measured by gas chromatography indicated RES values similar to our results (Table 1). Their average RES estimate for individual FA was 0.38, whereas our RES estimate was 0.39.
Our results indicated further that SC and MC are expected to be under stronger genetic control than LC (Table 1), which could be explained by the different ori-gin of milk FA. On the one hand, short- and medium-chain FA (C4:0 to C14:0, and almost half of C16:0) are synthesized de novo in the mammary gland. Therefore, the 2 key enzymes (acetyl-coenzyme A carboxylase and FA synthetase) involved in this metabolic pathway seem to be partially under genetic control. Figure 2 also indicates that SFA, SC, and MC are more heritable in mid to late lactation stage. Heritability among DIM for C4:0 to C16:0 showed a similar pattern of the curve.
On the other hand, the remaining C16:0 and almost all of the longer chain FA are excreted from the blood in the udder. Blood lipids may be derived from the digestion and absorption of dietary fat or from mobili-zation from adipose tissue (Grummer, 1991). Because LC concentration in milk is more dependent on diet intake than SC and MC, LC had lower heritabilities than FA synthesized de novo. However, these heritabili-ties were not zero, indicating that processes involved in the inclusion of LC in milk fat (i.e., biohydrogenation in the rumen, absorption of LC in the intestine, or mo-bilization of FA from adipose tissue) could be partially under genetic control. This confirmed the statement of Roche et al. (2009), who indicated that early lactation lipolysis is genetically controlled. Furthermore, PUFA are not synthesized by ruminants so their concentration in milk is closely related to the absorbed quantities in the intestine, which are themselves related to the PUFA diet intake and to their biohydrogenation in the rumen (Chilliard et al., 2001). Higher heritabilities for PUFA than for MUFA could indicate that processes involved in the inclusion of PUFA in milk are more ge-netically controlled than those involved in the produc-tion of MUFA in milk. Furthermore, Figure 2 indicates
that the heritability of MUFA, which mostly included C18:1 cis-9, is more stable among DIM than other FA, for which the shape of the heritability curve seems to follow the curve of fat content heritability.
Approximate Genetic Correlations Among Production Traits and FA
Approximation of Genetic Correlations. In this
study, approximate daily genetic correlations among traits were estimated as correlations among daily breeding values. As presented by Calo et al. (1973), correlations between breeding values do not fully re-flect the genetic relationships between 2 traits and they might underestimate it. The range of estimates and the pattern of the curves obtained in this study were compared with the genetic correlations obtained by Soyeurt et al. (2008), who used multivariate random regression models on the same population. Estimates were, on average, in the same range for both studies but the correlations were less variable along the lacta-tion. For instance, correlations between milk yield and SFA content in milk ranged between −0.20 and −0.55 in Soyeurt et al. (2008) and between −0.42 and −0.33 in this study (data not shown). Correlations between MUFA and SFA content in milk ranged between −0.10 and 0.80 in the study of Soyeurt et al. (2008) and be-tween 0.44 and 0.64 in this study (data not shown). These approximate genetic correlations will be called genetic correlations in the discussion below.
Genetic Correlations Between Production and FA. Averaged daily genetic correlations between milk yield and FA were negative (Table 2), which was expected because of the dilution effect. Average daily correlations between milk yield and FA contents did not vary strongly and approached −0.35. These cor-relations indicate that selection for improved milk yield would affect almost equally all FA contents in milk on average throughout the lactation and could therefore explain the results of Kay et al. (2005) and Bobe et al. (2007), who indicated that selection for milk yield had little effect on milk FA composition.
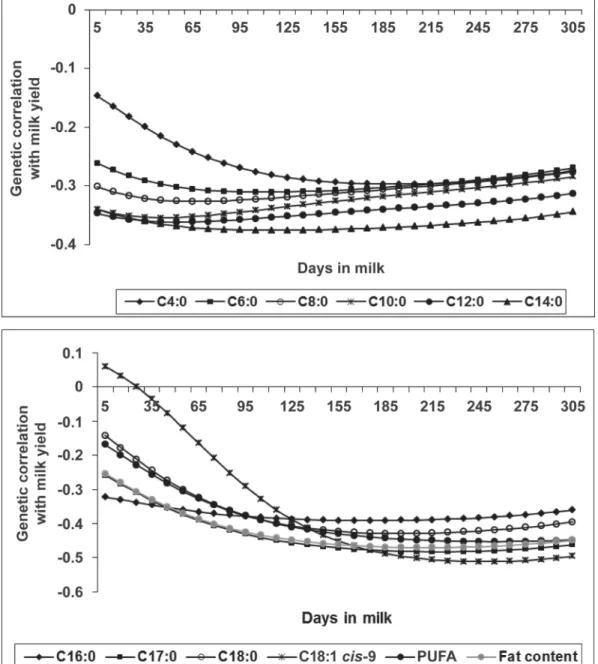
However, given our results, the genetic relationships between milk yield and FA contents in milk varied across DIM; Figure 3 depicts the genetic correlations between milk yield and fat content, all individual FA, and PUFA. These FA were chosen because they were representative of the complete data set. Trends for SC, MC, LC, SFA, MUFA, and UFA depended strongly on the individual FA tendencies. Results in Figure 3 show that the genetic relationship between fat content and milk yield was negative and decreased from −0.25 at 5 DIM to −0.44 at 215 DIM. Figure 3 also indicates that selection for higher milk yield in early lactation
VARIABILITY IN PRODUCTION TRAITS AND MILK FATTY ACID CONTENTS
(before 100 DIM) would affect the FA contents in milk differently: C4:0, C18:0, and PUFA would decrease but less strongly than C6:0 to C17:0. Genetic correlations with milk yield at 5 DIM were −0.15 for C4:0, −0.14 for C18:0, and −0.17 for PUFA, whereas they ranged from −0.26 for C6:0 to −0.34 for C14:0. In contrast, the genetic correlation between milk yield and C18:1 cis-9 was slightly positive in early lactation (0.06 at 5 DIM) and became negative around 35 DIM. Similarly, ge-netic correlations between milk yield and C17:0, C18:0, C18:1 cis-9, and PUFA seemed to be stable after 160 DIM and were around −0.45. The genetic correlation between milk yield and C16:0, however, did not change much across DIM. The genetic correlation between milk yield and PUFA was −0.17 in early lactation and decreased to −0.45 at 305 DIM. These results indicate that selection for higher milk yield in early lactation would (1) decrease the FA contents in milk synthesized de novo in the mammary gland, with a weaker influ-ence on C4:0; (2) hardly affect the content of C18:1 cis-9; and (3) negatively affect C18:0 and PUFA but with a weaker influence than on short- and medium-chain FA. Furthermore, selection for higher milk yield in late lactation would decrease the fat content and consequently all FA contents in milk, with a greater influence on long-chain saturated and unsaturated FA. Finally, even if selection for higher milk yield at spe-cific DIM would affect the milk FA profile differently, the results indicated that, on average, throughout the lactation, selection for improved milk yield would affect all FA contents in milk almost equally.
Genetic correlations between fat content and FA contents in milk (Table 2) were positive and moderate to high; from 0.67 for C18:1 cis to 0.97 for SFA. There-fore, increasing fat content would logically increase all underlying FA contents in milk. The high correlations between fat content and SFA, MC, or C16:0 were ex-pected because these FA are some of the major FA in fat. These results indicated that selecting for higher fat content would increase SFA, SC, and MC contents in milk more than it would increase MUFA, PUFA, or LC.
Genetic correlations of FA contents in milk with fat and protein yields were weaker than with milk, positive with fat yield, and negative with protein yield (Table 2). Furthermore, genetic correlations between protein content and FA contents were positive and ranged from 0.18 to 0.60. Because FA contents are highly correlated with fat content, positive correlations between protein content and FA contents could be explained by the genetic correlation between fat and protein contents (0.54; data not shown) and negative correlations be-tween protein yield and FA contents by the genetic cor-relation between fat content and protein yield (−0.22; data not shown).
Results in Table 2 were in line with the estimates given by Soyeurt et al. (2007), although their genetic correlations between milk yield and FA contents in milk were lower compared with those in the current study. These differences could be due to different data sets (i.e., the inclusion of cows with production data but without FA information in their study), the use of more reliable calibration equations for predicting FA
Table 2. Averaged daily genetic correlations between production traits and fatty acid contents in milk (g/dL);
average daily genetic correlations were calculated as the correlations between daily breeding values of cows having records and averaged for DIM between 5 and 305
Fatty acid Milk (kg) Fat (kg) Protein (kg) Fat (%) Protein (%) Saturated −0.40 0.29 −0.21 0.97 0.49 Monounsaturated −0.39 0.15 −0.20 0.76 0.48 Polyunsaturated −0.39 0.13 −0.15 0.72 0.60 Unsaturated −0.40 0.15 −0.19 0.77 0.52 Short-chain −0.32 0.32 −0.13 0.87 0.48 Medium-chain −0.38 0.29 −0.18 0.95 0.54 Long-chain −0.42 0.15 −0.27 0.79 0.38 C4:0 −0.27 0.34 −0.15 0.81 0.30 C6:0 −0.30 0.34 −0.13 0.87 0.43 C8:0 −0.31 0.31 −0.11 0.85 0.50 C10:0 −0.32 0.27 −0.11 0.81 0.55 C12:0 −0.34 0.24 −0.11 0.81 0.60 C14:0 −0.37 0.28 −0.13 0.89 0.59 C16:0 −0.37 0.28 −0.21 0.92 0.43 C17:0 −0.43 0.24 −0.21 0.96 0.57 C18:0 −0.37 0.17 −0.32 0.75 0.18 C18:1 −0.38 0.12 −0.22 0.70 0.39 C18:1 cis −0.36 0.12 −0.20 0.67 0.38 C18:1 cis-9 −0.35 0.13 −0.20 0.68 0.38
BASTIN ET AL.
contents in the present study, and the model used (this study included different effects and random regressions in the model). Furthermore, correlations presented here are approximate genetic correlations because they are correlations between breeding values.
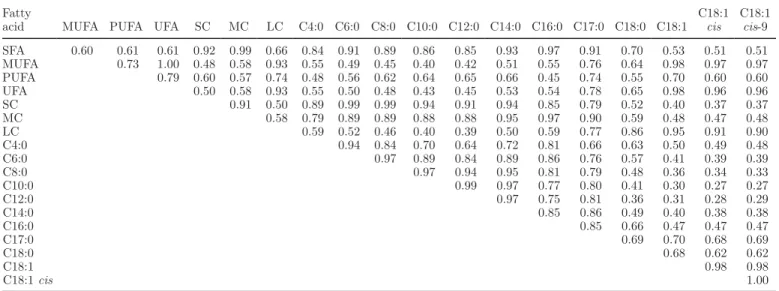
Genetic Correlations Among FA. All averaged
daily genetic correlations were positive and ranged between 0.27 and 1.00 (Table 3). Individual FA were highly correlated with the group(s) to which they be-longed. Such correlations were higher if the individual
FA was highly represented in the group (e.g., genetic correlation between C18:1 and C18:1 cis-9 was 0.98). Contents in milk of all de novo FA (C4:0 to C16:0) were strongly positively correlated with each other; the correlations ranged between 0.64 and 0.99. The correlations tended to be stronger between FA with a similar chain length (e.g., 0.99 between C10:0 and C12:0 vs. 0.64 between C4:0 and C12:0). In contrast, C4:0 to C16:0 were less strongly correlated with C18:1, C18:1 cis, and C18:1 cis-9; the correlations ranged from
Figure 3. Daily genetic correlations between milk yield (kg) and fat content (%), and contents (g/dL) of the following individual fatty acids
or groups of fatty acids: C4:0, C6:0, C8:0, C10:0, C12:0, C14:0, C16:0, C17:0, C18:0, C18:1 cis-9, and polyunsaturated fatty acids (PUFA). Daily genetic correlations were calculated as correlations between daily breeding values of cows with records.
VARIABILITY IN PRODUCTION TRAITS AND MILK FATTY ACID CONTENTS
0.27 to 0.50. Genetic correlations among FA permit the identification of the different groups of FA according to their origin: de novo synthesized FA and FA extracted from circulating blood lipids. Although differences ex-isted in the definition of FA traits and in the model used, our results support the direction of associations among FA reported by previous studies. Soyeurt et al. (2007) presented similar tendencies in genetic re-lationships among FA and grouped the FA according to their origin. Stoop et al. (2008) estimated genetic correlations among FA expressed in weight percentage and indicated that genetic correlations among C4:0 to C14:0 were high and positive, as were those among un-saturated C18, but correlations of C4:0 to C14:0 with unsaturated C18 were generally low.
Correlations between FA did not differ strongly over DIM (data not shown) except between C18:1 cis-9 and most of the other individual FA (Figure 4). Results indicate that at the beginning of lactation, the genetic correlations between C18:1 cis-9 and C8:0 to C14:0 were close to zero and then increased until 125 DIM. Genetic correlations between C18:1 cis-9 and C6:0 and C16:0 were 0.20 and 0.27, respectively, in early lactation and then increased to 0.42 and 0.51 at 125 DIM. Contrarily, the genetic relationship between C18:1 cis-9 and C4:0, C17:0, C18:0, and PUFA did not vary strongly over the lactation.
CONCLUSIONS
The FA profile in milk changed throughout lacta-tion phenotypically and genetically. Although genetic
correlations between traits were approximated in this study, the relationship was strong between the physi-ological status of the cow and its milk composition. As suggested in previous studies, C18:1 cis-9 could be an indicator of mobilization of body reserves. Our results also reinforce the value of studying the relationships between body energy status traits and changes in FA throughout the lactation using multivariate models. Moreover, heritabilities of FA contents in milk ranged between 0.175 for C18:1 cis and 0.441 for C8:0 and in-dicated that de novo synthesized FA are under stronger genetic control than FA originating from the diet and from body fat mobilization. Nevertheless, genetic cor-relations among FA were moderate to high (especially between FA of similar origins) and suggest that select-ing for certain FA would affect the complete FA profile in milk. Finally, these results indicated that selection for FA content in milk is feasible; however, the inclusion of these traits in breeding programs requires additional work as well as the consultation of the stakeholders from the dairy industry. Two steps are then needed: (1) the definition of clear breeding objectives related to these new traits and (2) the definition of selection indexes giving appropriate weights to FA to select all traits toward their desirable value.
ACKNOWLEDGMENTS
This research received financial support from the Eu-ropean Commission, Directorate-General for Agricul-ture and Rural Development, under Grand Agreement 211708 and from the Commission of the European
Table 3. Averaged daily genetic correlations among fatty acids in milk (g/dL); average daily genetic correlations were calculated as the
correlations between daily breeding values of cows having records and averaged for DIM between 5 and 3051
Fatty
acid MUFA PUFA UFA SC MC LC C4:0 C6:0 C8:0 C10:0 C12:0 C14:0 C16:0 C17:0 C18:0 C18:1 C18:1 cis C18:1 cis-9 SFA 0.60 0.61 0.61 0.92 0.99 0.66 0.84 0.91 0.89 0.86 0.85 0.93 0.97 0.91 0.70 0.53 0.51 0.51 MUFA 0.73 1.00 0.48 0.58 0.93 0.55 0.49 0.45 0.40 0.42 0.51 0.55 0.76 0.64 0.98 0.97 0.97 PUFA 0.79 0.60 0.57 0.74 0.48 0.56 0.62 0.64 0.65 0.66 0.45 0.74 0.55 0.70 0.60 0.60 UFA 0.50 0.58 0.93 0.55 0.50 0.48 0.43 0.45 0.53 0.54 0.78 0.65 0.98 0.96 0.96 SC 0.91 0.50 0.89 0.99 0.99 0.94 0.91 0.94 0.85 0.79 0.52 0.40 0.37 0.37 MC 0.58 0.79 0.89 0.89 0.88 0.88 0.95 0.97 0.90 0.59 0.48 0.47 0.48 LC 0.59 0.52 0.46 0.40 0.39 0.50 0.59 0.77 0.86 0.95 0.91 0.90 C4:0 0.94 0.84 0.70 0.64 0.72 0.81 0.66 0.63 0.50 0.49 0.48 C6:0 0.97 0.89 0.84 0.89 0.86 0.76 0.57 0.41 0.39 0.39 C8:0 0.97 0.94 0.95 0.81 0.79 0.48 0.36 0.34 0.33 C10:0 0.99 0.97 0.77 0.80 0.41 0.30 0.27 0.27 C12:0 0.97 0.75 0.81 0.36 0.31 0.28 0.29 C14:0 0.85 0.86 0.49 0.40 0.38 0.38 C16:0 0.85 0.66 0.47 0.47 0.47 C17:0 0.69 0.70 0.68 0.69 C18:0 0.68 0.62 0.62 C18:1 0.98 0.98 C18:1 cis 1.00
1Groups of studied fatty acids are saturated (SFA), monounsaturated (MUFA), polyunsaturated (PUFA), unsaturated (UFA), short-chain (SC),
BASTIN ET AL.
Communities, FP7, KBBE-2007-1. This paper does not necessarily reflect the view of these institutions and in no way anticipates the Commission’s future policy in this area. Hélène Soyeurt, as a postdoctoral researcher, and Nicolas Gengler, as a research associate, acknowl-edge the support of the National Fund for Scientific Research (Brussels, Belgium) for these positions and for the additional grants 2.4507.02F(2) and F4552.05 (2.4.623.08.F). Additional financial support was pro-vided by the Ministry of Agriculture of Walloon Region
of Belgium (Service Public de Walonie, Direction gé-nérale opérationnelle “Agriculture, Ressources naturel-les et Environnement” – DGA-RNE) through research projects D31-1207 and D31-1224. Authors are grateful to University of Liège (SEGI facility) for the use of NIC3 supercomputer, to Bernd Buske (Animal Science Unit, Gembloux Agro-Bio Tech, University of Liège, Belgium) for manuscript review, and to the RobustMilk team (Teagasc Moorepark Dairy Production Research Centre, Fermoy, Co. Cork, Ireland; Sustainable
Live-Figure 4. Daily genetic correlations between the content in milk (g/dL) of C18:1 cis-9 and the content in milk (g/dL) of the following
indi-vidual fatty acids or groups of fatty acids: C4:0, C6:0, C8:0, C10:0, C12:0, C14:0, C16:0, C17:0, C18:0, and polyunsaturated fatty acids (PUFA). Daily genetic correlations were calculated as correlations between daily breeding values of cows with records.
VARIABILITY IN PRODUCTION TRAITS AND MILK FATTY ACID CONTENTS
stock Systems Group, Scottish Agricultural College, Bush Estate, Penicuik, Midlothian, United Kingdom; Walloon Agricultural Research Centre, Valorisation of Agricultural Products, Gembloux, Belgium; Animal Science Unit, Gembloux Agro-Bio Tech, University of Liège, Gembloux, Belgium) involved in the creation of the fatty acid calibration equations used in this study.
REFERENCES
Arnould, V. M.-R., and H. Soyeurt. 2009. Genetic variability of milk fatty acids. J. Appl. Genet. 50:29–39.
Barber, M. C., R. A. Clegg, M. T. Travers, and R. G. Vernon. 1997. Lipid metabolism in the lactating mammary gland. Biochim. Bio-phys. Acta 1347:101–126.
Bobe, G., G. L. Lindberg, A. E. Freeman, and D. C. Beitz. 2007. Short communication: Composition of milk protein and milk fatty acids is stable for cows differing in genetic merit for milk production. J. Dairy Sci. 90:3955–3960.
Bobe, G., J. A. Minick Bormann, G. L. Lindberg, A. E. Freeman, and D. C. Beitz. 2008. Short communication: Estimates of genetic variation of milk fatty acids in US Holstein cows. J. Dairy Sci. 91:1209–1213.
Calo, L. L., R. E. McDowell, L. D. VanVleck, and P. D. Miller. 1973. Genetic aspects of beef production among Holstein-Friesians pedi-gree selected for milk production. J. Anim. Sci. 37:676–682. Chilliard, Y., A. Ferlay, and M. Doreau. 2001. Contrôle de la qualité
nutritionnelle des matières grasses du lait par l’alimentation des vaches laitières: Acides gras trans, polyinsaturés, acide linoléique conjugué. INRA Prod. Anim. 14:323–335.
Chilliard, Y., A. Ferlay, R. M. Mansbridge, and M. Doreau. 2000. Ruminant milk fat plasticity: Nutritional control of saturated, polyunsaturated, trans and conjugated fatty acids. Ann. Zootech. 49:181–205.
Chilliard, Y., C. Martin, J. Rouel, and M. Doreau. 2009. Milk fatty acids in dairy cows fed whole crude linseed, extruded linseed, or linseed oil, and their relationship with methane output. J. Dairy Sci. 92:5199–5211.
Croquet, C., P. Mayeres, A. Gillon, S. Vanderick, and N. Gengler. 2006. Inbreeding depression for global and partial economic indexes, pro-duction, type, and functional traits. J. Dairy Sci. 89:2257–2267. Fischer, T. M., A. R. Gilmour, and H. J. J. van der Werf. 2004.
Computing approximate standard errors for genetic parameters derived from random regression models fitted by average informa-tion REML. Genet. Sel. Evol. 36:363–369.
Grummer, R. R. 1991. Effect of feed on the composition of milk fat. J. Dairy Sci. 74:3244–3257.
Jensen, R. G., A. M. Ferris, and C. J. Lammi-Keefe. 1991. The com-position of milk fat. J. Dairy Sci. 74:3228–3243.
Karijord, Ø., N. Standal, and O. Syrstad. 1982. Sources of variation in composition of milk fat. Z. Tierzücht. Züchtungsbiol. 99:81–93. Kay, J. K., W. J. Weber, C. E. Moore, D. E. Bauman, L. B.
Han-sen, H. Chester-Jones, B. A. Crooker, and L. H. Baumgard. 2005. Effects of week of lactation and genetic selection for milk yield on milk fatty acids composition in Holstein cows. J. Dairy Sci. 88:3886–3893.
Mele, M., R. Dal Zotto, M. Cassandro, G. Conte, A. Serra, A. Buc-cioni, G. Bittante, and P. Secchiari. 2009. Genetic parameters of conjugated linoleic acid, selected milk fatty acids, and milk fatty acid unsaturation of Italian Holstein-Frisian cows. J. Dairy Sci. 92:392–400.
Misztal, I. 2010. BLUPF90 family of programs. University of Geor-gia, Athens. Accessed March 25, 2010. http://nce.ads.uga. edu/~ignacy/newprograms.html.
Moate, P. J., W. Chalupa, R. C. Boston, and I. J. Lean. 2007. Milk fatty acids. I. Variation in the concentration of individual fatty acids in bovine milk. J. Dairy Sci. 90:4730–4739.
Palmquist, D. L., A. D. Beaulieu, and D. M. Barbano. 1993. Feed and animal factors influencing milk fat composition. J. Dairy Sci. 76:1753–1771.
Roche, J. R., N. C. Friggens, J. K. Kay, M. W. Fisher, K. J. Stafford, and D. P. Berry. 2009. Invited review: Body condition score and its association with dairy cow productivity, health, and welfare. J. Dairy Sci. 92:5769–5801.
Rutten, M. J. M., H. Bovenhuis, K. A. Hettinga, H. J. F. van Valen-berg, and J. A. M. Van Arendonck. 2009. Predicting bovine milk fat composition using infrared spectroscopy based on milk samples collected in winter and summer. J. Dairy Sci. 92:6202–6209. Soyeurt, H., P. Dardenne, F. Dehareng, G. Lognay, D. Veselko, M.
Marlier, C. Bertozzi, P. Mayeres, and N. Gengler. 2006. Estimating fatty acids content in cow milk using mid-infrared spectrometry. J. Dairy Sci. 89:3690–3695.
Soyeurt, H., F. Dehareng, N. Gengler, S. McParland, E. Wall, D. P. Berry, M. Coffey, and P. Dardenne. 2011. Mid-infrared prediction of bovine milk fatty acids across multiple breeds, production sys-tems, and countries. J. Dairy Sci. 94:1657–1667.
Soyeurt, H., F. Dehareng, P. Mayeres, C. Bertozzi, and N. Gengler. 2008. Genetic parameters of saturated and monounsaturated fatty acid content and the ratio of saturated to unsaturated fatty acids in bovine milk. J. Dairy Sci. 91:3611–3626.
Soyeurt, H., A. Gillon, S. Vanderick, P. Mayeres, C. Bertozzi, and N. Gengler. 2007. Estimation of heritability and genetic correlations for the major fatty acids in bovine milk. J. Dairy Sci. 90:4435– 4442.
Stoop, W. M., H. Bovenhuis, J. M. L. Heck, and J. A. M. van Aren-donk. 2009. Effect of lactation stage and energy status on milk fat composition of Holstein-Friesian cows. J. Dairy Sci. 92:1469–1478. Stoop, W. M., J. A. M. van Arendonk, J. M. L. Heck, H. J. F. van
Valenberg, and H. Bovenhuis. 2008. Genetic parameters for major fatty acids and milk production traits of Dutch Holstein-Friesians. J. Dairy Sci. 91:385–394.
Williams, P. 2007. Near-infrared technology—Getting the best out of light. PDK Grain, Namaimo, Canada.