The Effectiveness of Private Motorized Trips Indicators in Reducing Car Usage
Article in International Journal for Traffic and Transport Engineering (IJTTE) · December 2012DOI: 10.7708/ijtte.2012.2(4).05 CITATIONS 5 READS 29 3 authors, including:
Some of the authors of this publication are also working on these related projects:
Kuala Lumpur Low Carbon Society BlueprintView project
Happy citiesView project Mehdi Moeinaddini Universiti Teknologi Malaysia 35PUBLICATIONS 383CITATIONS
SEE PROFILE
Muhammad Zaly Shah Universiti Teknologi Malaysia 74PUBLICATIONS 483CITATIONS
THE EFFECTIVENESS OF PRIVATE MOTORIZED TRIPS
INDICATORS IN REDUCING CAR USAGE
Mehdi Moeinaddini1, Zohreh Asadi-Shekari2, Muhammad Zaly Shah3
1, 2, 3 Universiti Teknologi Malaysia, Faculty of Built Environment, Department of Urban and Regional Planning, 81310 Skudai, Johor, Malaysia
Received 11 July 2012; accepted 10 September 2012
Abstract: Neighborhoods with similar design may have different travel behavior due to the
impacts of socio-economic indicators. There are also some effective indicators such as residents’ income, age, and self-selection factors related to this case that cannot be evaluated easily, which question the reliability of previous efforts to describe the effects of private motorized trips indicators on car usage universally. On the other hand, private motorized trips indicators are effective factors that influence travel behavior but these indicators have not been evaluated in considerable studies. This paper introduces a multiple-linear regression analysis to estimate the relationship of private motorized trips indicators and car usage in various cities in different parts of the world with various socio-economic contexts. So, the results of this study are reliable enough to illustrate this relationship with international scale. The significant private motorized trips factors are also identified in this research for being utilized in car reduction strategies in urban areas.
Keywords: private motorized trips indicators, private car usage, sustainable urban transport
planning, multiple-linear regression.
1 Corresponding author: [email protected]
1. Introduction
Adequate urban planning paradigm and comprehensive strategies that encourage green travel modes and decline private motorized usage are utilized in various communities to decrease private car trips (Asadi-Shekari et al., 2012). Land use, street network, public transport and private motorized are main indicators that influence travel behavior besides socio-economic factors. Understanding the relationship between effective travel behavior factors and private motorized trips leads to achieve adequate planning paradigm and comprehensive strategies.
The relationship between land use and travel behavior is evaluated in ample studies (e.g. Handy and Mokhtarian, 2005; Kuzmyak and Pratt, 2003; Morris, 2004). The effects of density, diversity and design (3Ds) on trip mode and generation are examined by Cervero and Kockelman (1997). This work was extended to the 4Ds by adding destinations accessibility (Ewing and Cervero, 2001; Cervero, 2002; DKS, 2007; Ewing and Cervero, 2010). On the other hand, some studies proposed that the effects of built environment indicators on travel behavior are limited (Boarnet and Crane, 2001; Handy et al., 2005; Stead, 2001).
These kinds of studies suggest that built environment characters cannot describe travel behaviors completely. They propose various socio-economic indicators that produce different travel behaviors for similar neighborhoods. Although these efforts pay more attentions to the socio-economic indicators, urban form still affects travel behavior (Naess, 2009).
Travel behavior is also affected by street density and pattern (Cervero and Kockelman, 1997; Bento et al., 2005; DKS, 2007). Grid streets patterns decrease vehicle miles of travelled (VMT) and car usage and increase walking since they provide more connected roads (Crane, 1996; Ryan and McNally, 1995; Plaut and Boarnet, 2003). Block size, length and density are results of street patterns. Block size also affect walking trips (Boarnet et al., 2011; Hess et al., 1999; Joh et al., 2009; Targa and Clifton, 2005). Moreover, various studies assert that there is a relationship between intersection density and VMT (e.g. Chapman and Frank, 2004; Ewing et al., 2009; Frank and Engelke, 2005; Frank et al., 2009; Chatman, 2008). Litman (2009) believes that public transport is important to reduce vehicle kilometres travelled and Nelson et al. (2007) found that rail transit system in Washington DC has congestion reduction benefits to motorists. Schimek (1996) also proposed that better public transport facilities in Toronto’s urban region produce higher transit and lower car usage. Preferring public transport to private car for developing sustainability and reducing the frequency of car usage is contemplated in ample studies in case of public transport mobility benefits.
Population growth and industrialization increase private motorized vehicle in
urban areas. So, congestion pricing was established in 1980s and 1990s to reduce the car usage. Some of these strategies have been successfully performed such as the toll rings in Norway (Larsen, 1995), the Area Licensing Scheme in Singapore (Behbehani et al., 1984), Congestion Pricing in Stockholm (2006) and London Congestion Charging (2003). This strategy increases cost of travel by private motorized and encourage people to use other alternative travel modes. Individuals like a way that decreases their personal costs (Loukopoulos et al., 2004; Salomon and Mokhtarian, 1997). Travel behaviour is also affected by private motorized indicators. With more and cheaper car ownership and facilities, car usage can be increased due to rise of convenience. There are few studies that evaluate the effectiveness of private motorized trips indicators (e.g. distance of a private motorized trip, cost and proportion of private cars passengers) to reduce private motorized trips. Therefore, this paper tries to cover private motorized indicators to find the effectiveness of these factors to reduce car usage. Identifying the relationship between private motorized factors and usage in different socio-economic contexts leads to more effective design strategies to reduce private motorized trips. On the other hand, self-selection and socio-economic indicators are evaluated by previous efforts to have more reliable results but these studies just cover some cities of a selected country or some neighborhoods from a single city. Socio-economic indicators that affect travel behavior are various between different neighborhoods and they have limitations for evaluation. Therefore, travel behavior in various socio-economic contexts cannot be illustrated by previous efforts. Various cities with different
socio-economical backgrounds are evaluated in this paper so the results are reliable enough to be used in different parts of the world.
2. Material and Method
This paper attempts to find the relationship between private motorized trips indicators and daily private motorized trips. The indicators that present private motorized trips are private passenger vehicles per thousand inhabitants, average annual distance travelled per one private passenger vehicle, average distance of a private motorized trip and cost of one private motorized passenger kilometre for the traveller. Daily private motorized trip is also illustrated by percentage of daily trips by private motorized modes.
The strength of relationship in this research is found by estimating multiple-linear regression model due to the scale of measurement, the number of groups, the nature of the relationship between groups, the number of variables, and the assumptions of statistical test.
The data were selected from International Association of Public Transport (UITP) data collection. Selecting 36 cities from various parts of the world is significant in evaluating this relationship in various socio-economic backgrounds (Table A.1). Various economical and social indicators make different socio-economic contexts for these cities. For instance, maximum gross domestic product (GDP) per inhabitant between these cities is related to Munich (45800 EUR) but for Moscow, this value is 6060 EUR (Table A.2). In addition, these cities are selected from various countries with different cultures. There are European countries besides Singapore, Hong Kong, Russia and UAE. These countries have
different human development index (HDI). Norway has the best HDI ranking that is one and Russia has the least that is 66 in this selected cities (Table A.2). Therefore, this study estimates the relationship between private motorized trips indicators and daily private motorized trips in various socio-economic contexts. This issue leads to achieve results that can be used in different socio-economic backgrounds.
3. Analysis Result
In multiple-linear regression models the first assumption is a normal distribution for all variables so all variables were tested by Shapiro-Wilk normality test in SPSS. This is the most reliable test for non-normality for small to medium-sized samples (Shapiro and Wilk, 1965).
The results show that the average annual distance travelled per one private passenger vehicle is not normally distributed (Shapiro-Wilk Sig is less than 0,05 for these variables). Transforming these variables to natural logarithm solves the non-normality problem (Cuesta et al., 2008).
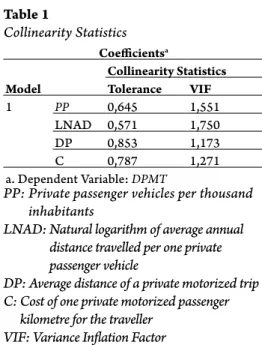
The second assumption is the existence of a linear relationship between independent and dependent variables without outliers. This assumption and heteroscedasticity were tested by scatter plots. No or little multicollinearity is the other assumption for multiple-linear regression models. All Pearson’s Bivariate correlation coefficients are smaller than 1 and Tolerances in Table 1 are greater than 0,1 and VIFs are less than 10. This shows that, there was no multicollinearity problem in this model and thus independent variables are independent from each other.
Table 1 Collinearity Statistics Coefficientsa Model Collinearity Statistics Tolerance VIF 1 PP 0,645 1,551 LNAD 0,571 1,750 DP 0,853 1,173 C 0,787 1,271 a. Dependent Variable: DPMT
PP: Private passenger vehicles per thousand inhabitants
LNAD: Natural logarithm of average annual distance travelled per one private passenger vehicle
DP: Average distance of a private motorized trip C: Cost of one private motorized passenger
kilometre for the traveller VIF: Variance Inflation Factor
Little or no autocorrelation in data also should be considered in multi-linear regression models. Autocorrelation occurs when residuals are not independent. Durbin-Watson value which is presented in Table 2 shows this independency (values less than 1 and greater than 3 may cause concern for the model). R2 value (Table 2) shows that
more than 66 percentage of the variables can be explained by the model. The value of standard error of the estimate (Table 2) indicates that this model is powerful for prediction. Table 3 is the ANOVA results of this model. It is very unlikely that the F-ratio in this table has happened by chance, so this model is significantly good at predicting the outcome variables (alpha is 0,05).
Model Summaryb
Model R R Square Adjusted RSquare Std. Error of the Estimate Durbin-Watson
1 0,817a 0,667 0,624 7,6557 2,066
a. Predictors: (Constant), PP, LNAD, DP, C b. Dependent Variable: DPMT
R Square: Coefficient of Determination
ANOVAb
Model Sum of Squares df Mean Square F Sig.
1 Regression 3643,806 4 910,951 15.543 0.000a
Residual 1816,882 31 58,609
Total 5460,687 35
a. Predictors: (Constant), PP, LNAD, DP, C b. Dependent Variable: DPMT
df: Degrees of freedom
F: The ratio of the Model Mean Square to the Error Mean Square Sig: The observed significance levels for the F statistics
Table 2
Model Summary
Table 3
Table 4 indicates positive coefficients for the private passenger vehicles per thousand inhabitants and the natural logarithm of average annual distance travelled per one private passenger vehicle. This table also shows negative coefficients for the average distance of a private motorized trip and cost of one private motorized passenger kilometre for the traveller. All these coefficients are significant using t-test (alpha is 0,05). Therefore, the final private motorized trips model can be defined as follows (refer Eq. (1) and Table 4):
DPMT = -150,874 + 0,062PP + 24,040LNAD –
2,898DP – 0,396C (1)
where:
DPMT - Percentage of daily trips by private
motorized modes
PP - Private passenger vehicles per thousand
inhabitants
LNAD - Natural logarithm of average annual
distance travelled per one private passenger vehicle
DP - Average distance of a private motorized trip C - Cost of one private motorized passenger
kilometre for the traveller
The model shows that cities with fewer private passenger vehicles per thousand inhabitants have lower percentage of daily trips by private motorized modes. More private passenger vehicles can be the result of car dependent urban development or car dependent culture so strategies that reduce car dependency can be effective to have fewer private passenger vehicles. The model also indicates that cities with higher cost of one private motorized passenger kilometre for the traveller have lower percentage of daily trips by private motorized modes. More costs can discourage car users and decrease private motorized trips. Furthermore, the model shows fewer percentage of daily trips by private motorized modes for cities with lower average annual distance travelled per one private passenger vehicle. On the other hand, the model indicates that increase average distance of a private motorized trip decreases private motorized daily trips. More walking and cycling facilities and walkable destinations (mix land use) can reduce private motorized trips for closer destinations and increase average distance of a private motorized
Coefficientsa Model
Unstandardized
Coefficients Standardized Coefficients
t Sig. B Std. Error Beta 1 (Constant) -150,874 50,850 -2,967 0,006 PP 0,062 0,011 0,734 5,689 0,000 LNAD 24,040 5,039 0,654 4,770 0,000 DP -2,898 0,627 -0,519 -4,622 0,000 C -0,396 0,155 -0,298 -2,553 0,016 a. Dependent Variable: DPMT B: Regression coefficient
t: The ratio of the sample regression coefficient to its standard error Sig: The observed significance levels for the t statistics
Table 4
trip. Further distance means more traffic and conflicts so it can decrease convenience. If people spend more time to use their cars, they will have more motivations to change their travel modes.
4. Conclusions and Discussions
This research shows that among private motorized daily trips predictors, natural logarithm of average annual distance travelled per one private passenger vehicle has the highest positive coefficient so this factor can be more effective to have more predicted private motorized daily trips. The next effective indicator is average distance of a private motorized trip with negative relationship so its impacts on private motorized daily trips is more than private passenger vehicles per thousand inhabitants and cost of one private motorized passenger kilometre for the traveller. It means that people use their private motorized vehicles more for short trips so improving walking and cycling infrastructures can be effective to have fewer predicted private motorized trips for short distances. The third effective indicator is cost with negative relationship. Private passenger vehicles density has the least positive coefficient so it has the least effect on private motorized daily trips.
This study evaluates private motorized trips indicators that are prominent for car reduction strategies. There are limited literatures that address this issue. On the other hand, the majority of previous efforts just consider some cities from one country or some neighborhoods from one city, while this study evaluates the relationship of private motorized trips and car usage in different cities. So, the results of this study can be used in different socio-economic contexts.
The model that is described in this study (refer Eq.(1)) can help to predict possibility of cities
that have the least private motorized daily usage. Accordingly, an assumed city based on cities that are evaluated in this model is considered. The most effective values for significant indicators are given to this assumed city by substitution of the highest value among indicators of the cities that are used in this model for negative significant coefficients and the lowest for the positive significant coefficients. Considering highest value for negative coefficients and lowest for the positive coefficients leads to have lowest rate of daily private motorized usage (Eq. (1)).
DPMT = -150,874 + 0,062(54,7) + 24,040(8,42) – 2,898(15) – 0,396(68,1) = -15,5 where:
-15,5 - The least percentage of daily trips by private motorized modes for the assumed city 54,7 - Private passenger vehicles per thousand inhabitants for Hong Kong
8,42 - Natural logarithm of average annual distance travelled per one private passenger vehicle for Turin
15 - Average distance of a private motorized trip for Munich
68,1 - Cost of one private motorized passenger kilometre for the traveller for Hong Kong This city is a combination of all cities indicators that are used to build the model. These indicators can decrease percentage of daily trips by private motorized modes in this assumed city up to -15,5. It means less than zero. Although this issue seems impossible, since this city is combination of existing cities, indicators that are used to assume this city are achievable. Fig. 1 illustrates this assumed city structure.
Hong Kong has two significant indicators that have the most effective values for less car usage (Fig. 1). This city also has the
least percentage of daily private motorized trips (16,2) among the cities in the model (Table A.1). This issue shows that significant indicators that are estimated by this model are effective in reducing car usage in urban areas. These effective indicators can be used in future car free research.
Relationship models with universal scale may be replicated by future studies for other urban structure factors and travel behavior to find effective indicators toward sustainable travel patterns regardless of socio-economic backgrounds. Future research may update their data sources and examining the urban structure indicators and travel behavior relationships in various parts of the world to cover the fast changes in urban indicators.
Overall, to achieve sustainable urban areas having fewer private motorized trips in cities is a desirable goal for majority of policies and strategies. This research attempts to examine the relationship of car usage and private motorized trips indicators to show how this relationship can be useful in reducing car usage in urban areas in various parts of the world.
Acknowledgements
The authors wish to thank all of those who supported this research for their useful comments during the completion. The research data underlying this paper were funded by Universiti Teknologi Malaysia (UTM).
PP
Hong Kong
Hong Kong
Assumed city
Turin
Munich
LNAD
DP
C
Fig. 1.Indicators Private passenger vehicles per thousand inhabitants Average annual distance travelled per one private passenger vehicle Average distance of a private motorized trip
Cost of one private motorized passenger kilometer for the traveler Percentage of daily trips by private motorized modes Units km km 0,01 EUR Cities Amsterdam 353 8750 11 41 33,9 Athens 449 7500 10 26,4 63,9 Barcelona 490 6710 10,8 37,2 46,9 Bilbao 412 7040 14,9 36,9 35,4 Bologna 736 5090 6,8 47,3 56,6 Brussels 515 8980 10,1 33 58,9 Clermont Ferrand 549 8000 5,5 42,5 60,7 Copenhagen 333 14800 13 35,8 48,9 Dubai 247 18100 11 25,7 77,3 Geneva 594 8070 8,5 58,8 51,2 Glasgow 351 12800 8 33,5 65,9 Graz 517 9040 8,9 40,4 46,4 Helsinki 377 9000 8,2 41 44 Hong Kong 54.7 8960 9 68,1 16,2 Lille 437 7500 5,4 41,3 63,2 Lisbon 458 5000 8,3 47 48 London 358 9140 9 47,3 50,2 Lyons 515 6770 6,4 44,3 54,3 Madrid 507 8530 11 32,2 51,4 Manchester 444 9320 8 36,3 68,1 Marseilles 426 8910 7,5 34,5 54,1 Moscow 193 9510 12 20,1 26,3 Munich 584 9560 15 36,1 40,6 Nantes 575 7260 6,35 43,5 63,9 Newcastle 328 12700 9,8 39,4 57,1 Oslo 459 10700 9 51,1 59,1 Paris 497 8220 8,22 40,3 46,4 Rome 770 5530 12 42,3 56,2 Rotterdam 374 9290 9 40,2 48,3 Seville 441 5000 8 48,7 48 Singapore 163 19500 9,7 43,1 45,1 Stockholm 410 8700 10 44,6 47,1 Stuttgart 609 10200 11 37 58,9 Turin 689 4550 9,4 50,8 54 Vienna 456 5230 8,3 58 36 Warsaw 399 5730 10 31,4 28,6 Source: UITP (2006)
Appendix A: Research Data
Table A.1.Table A.2.
Socio-Economic Data
Cities GDP per inhabitant (EUR) Country HDI ranking
Amsterdam 34100 Netherlands 3 Athens 11600 Greece 29 Barcelona 17100 Spain 23 Bilbao 20500 Spain 23 Bologna 31200 Italy 24 Brussels 23900 Belgium 18
Clermont Ferrand 24200 France 20
Copenhagen 34100 Denmark 16 Dubai 22000 UAE 30 Geneva 37900 Switzerland 11 Glasgow 20600 UK 28 Graz 29600 Austria 19 Helsinki 36500 Finland 22
Hong Kong 27600 Hong Kong 13
Lille 21800 France 20 Lisbon 17100 Portugal 41 London 36400 UK 28 Lyons 27100 France 20 Madrid 20000 Spain 23 Manchester 22400 UK 28 Marseilles 22700 France 20 Moscow 6060 Russia 66 Munich 45800 Germany 9 Nantes 25200 France 20 Newcastle 18400 UK 28 Oslo 42900 Norway 1 Paris 37200 France 20 Rome 26600 Italy 24 Rotterdam 28000 Netherlands 3 Seville 11000 Spain 23 Singapore 28900 Singapore 26 Stockholm 32700 Sweden 10 Stuttgart 32300 Germany 9 Turin 26700 Italy 24 Vienna 34300 Austria 19 Warsaw 13200 Poland 39
References
Asadi-Shekari, Z.; Moeinaddini, M.; Shah, M.Z. 2012. A Disabled Pedestrian Level Of Service Method For Evaluating And Promoting Inclusive Walking Facilities On Urban Streets, Journal of Transportation Engineering. Accepted for publication. DOI: http://dx.doi.org/10.1061/(ASCE) TE.1943-5436.0000492.
Behbehani, R.; Pendakur, V.; Armstrong-Wright, A. 1984. Singapore Area Licensing Scheme: A review of the impact. Washington, D.C.: The World Bank. 55 p.
Bento, A.M.; Cropper, M.L.; Mobarak, A.M.; Vinha, K. 2005. The Effects of Urban Spatial Structure on Travel Demand in the United States, The Review
of Economics and Statistics. DOI: http://dx.doi.
org/10.1162/0034653054638292, 87(3): 466-478. Boarnet, M.G.; Joh, K.; Siembab, W.; Fulton, W.; Nguyen, M.T. 2011. Retrofitting the suburbs to increase walking: Evidence from a land use-travel study, Urban Studies. DOI: http://dx.doi.org/10.1177/0042098010364859, 48(1): 129-159.
Boarnet, M.; Crane, R. 2001. Travel by Design: The Influence
of Urban Form on Travel. New York: Oxford University
Press. 240 p.
Cervero, R. 2002. Built environments and mode choice: Toward a normative framework, Transportation Research
Part D: Transport and Environment. DOI: http://dx.doi.
org/10.1016/S1361-9209(01)00024-4, 7(4): 265-284. Cervero, R.; Kockelman, K. 1997. Travel Demand and the 3Ds: Density, Diversity, and Design, Transportation Research
Part D: Transport and Environment. DOI: http://dx.doi.
org/10.1016/S1361-9209(97)00009-6, 2(3): 199-219. Chapman, J.; Frank, L. 2004. Integrating travel behavior and urban form data to address transportation and air quality problems in Atlanta. Washington, D.C.: U.S. Department
of Transportation. 304 p.
Chatman, D.G. 2008. Deconstructing development density: Quality, quantity and price effects on household non-work travel, Transportation Research Part A: Policy and Practice. DOI: http://dx.doi.org/10.1016/j.tra.2008.02.003, 42(7): 1008-1030.
Crane, R. 1996. On form versus function: Will the new urbanism reduce traffic, or increase it?, Journal of
Planning Education and Research. DOI: http://dx.doi.
org/10.1177/0739456X9601500204, 15(2): 117-126. Cuesta, D.; Taboada, A.; Calvo, L.; Salgado, J.M. 2008. Short- and medium-term effects of experimental nitrogen fertilization on arthropods associated with Calluna vulgaris heathlands in north-west Spain, Environmental Pollution. DOI: http://dx.doi.org/10.1016/j.envpol.2007.06.073, 152(2): 394-402.
DKS. 2007. Assessment of Local Models and Tools for Analyzing Smart-Growth Strategies - Final Report. Irvine:
University of California. 196 p.
Ewing, R.; Cervero, R. 2001. Travel and the Built Environment: A Synthesis, Transportation Research Record:
Journal of the Transportation Research Board. DOI: http://
dx.doi.org/10.3141/1780-10, 1780: 87-114.
Ewing, R.; Cervero, R. 2010. Travel and the Built Environment, Journal of the American Planning Association. DOI: http://dx.doi.org/10.1080/01944361003766766, 76(3): 265-294.
Ewing, R.; Greenwald, M.J.; Zhang, M.; Walters, J.; Feldman, M.; Cervero, R.; Thomas, J. 2009. Measuring the impact of urban form and transit access on mixed use site trip generation rates-Portland pilot study. Washington,
D.C.: U.S. Environmental Protection Agency.
Frank, L.D.; Engelke, P. 2005. Multiple impacts of the built environment on public health: Walkable places and the exposure to air pollution, International Regional Science Review. DOI: http://dx.doi.org/10.1177/0160017604273853, 28(2): 193-216.
Frank, L.D.; Kavage, S.; Greenwald, M.; Chapman, J.; Bradley, M. 2009. I-PLACE3S health & climate enhancements and their application in King County. Seattle,
W.A.: King County HealthScape. 54 p.
Handy, S.; Cao, X.; Mokhtarian, P. 2005. Correlation or causality between the built environment and travel behaviour? Evidence from Northern California, Transportation
Research D: Transport and Environment. DOI: http://dx.doi.
org/10.1016/j.trd.2005.05.002, 10(6): 427-444. Handy, S.; Mokhtarian, P.L. 2005. Which Comes First: The Neighborhood Or The Walking. Available from Internet: <http://www.des.ucdavis.edu/faculty/handy/ walking_or_neighborhood.pdf>.
Hess, P.; Moudon, A.; Snyder, M.; Stanilov, K. 1999. Site Design and Pedestrian Travel, Transportation Research Record:
Journal of the Transportation Research Board. DOI: http://
dx.doi.org/10.3141/1674-02, 1674: 9-19.
Joh, K.; Boarnet, M.G.; Nguyen, M.T. 2009. Interactions between race/ethnicity, attitude, and crime: Analyzing walking trips in the South Bay Area [CD]. In 88th annual
meeting of the Transportation Research Board. 21 p.
Kuzmyak, R.J.; Pratt, R.H. 2003. TRB’s Transit Cooperative Research Program (TCRP) Report 95: Chapter 15-Land Use and Site Design provides information on the relationships between land use/site design and travel behavior. Washington,
D.C.: Transportation Research Board. 146 p.
Larsen, O. 1995. The toll cordons in Norway: an overview,
Journal of Transport Geography. DOI: http://dx.doi.
org/10.1016/0966-6923(95)00018-X, 3(3): 187-197. Litman, T. 2009. Are Vehicle Travel Reduction Targets Justified?
Evaluating Mobility Management Policy Objectives Such As Targets To Reduce VMT And Increase Use Of Alternative Modes. Victoria:
Victoria Transport Policy Institute. 34 p.
Loukopoulos, P.; Jakobsson, C.; Ga Rling, T.; Schneider, C.M.; Fujii, S. 2004. Car-user responses to travel demand management measures: Goal setting
and choice of adaptation alternatives, Transportation
Research Part D: Transport and Environment. DOI: http://
dx.doi.org/10.1016/j.trd.2004.02.003, 9(4): 263-280. Morris, H. 2004. Commute Rates on Urban Trails: Indicators From the 2000 Census, Transportation
Research Record: Journal of the Transportation Research Board. DOI: http://dx.doi.org/10.3141/1878-14,
1878: 116-121.
Naess, P. 2009. Residential Self-Selection and Appropriate Control Variables in Land Use: Travel Studies, Transport Reviews. DOI: http://dx.doi. org/10.1080/01441640802710812, 29(3): 293-324. Nelson, P.; Baglino, A.; Harrington, W.; Safirova, E.; Lipman, A. 2007. Transit in Washington, D.C.: Current Benefits and Optimal Level of Provision. Resources for the Future, Journal of Urban Economics. DOI: http:// dx.doi.org/10.1016/j.jue.2007.02.001, 62(2): 231-251. Plaut, P.; Boarnet, M. 2003. New Urbanism and the Value of Neighborhood Design, Journal of Architectural and Planning
Research, 20(3): 254-265.
Ryan, S.; Mcnally, M. 1995. Accessibility of Neotraditional Neighborhoods: A Review of Design Concepts, Policies, and Recent Literature, Transportation Research Part A: Policy
and Practice. DOI:
http://dx.doi.org/10.1016/0965-8564(94)E0008-W, 29(2): 87-105.
Salomon, I.; Mokhtarian, P.L. 1997. Coping with congestion: Understanding the gap between policy assumptions and behavior, Transportation Research
Part D: Transport and Environment. DOI: http://dx.doi.
org/10.1016/S1361-9209(97)00003-5, 2(2): 107-123. Schimek, P. 1996. Land use, transit and mode split in Boston and Toronto. In Proceedins of the ACSP/AESOP joint
international congress.
Shapiro, S.S.; Wilk, M.B. 1965. An Analysis of Variance Test for Normality (Complete Samples), Biometrika, 52(3-4): 591-611.
358
Stead, D. 2001. Relationships between land use, socioeconomic factors, and travel patterns in Britain,
Environment and Planning B: Planning and Design. DOI: http://
dx.doi.org/10.1068/b2677, 28(4): 499-528.
Targa, F.; Clifton, K. 2005. The built environment and trip generation for non-motorized travel, Journal of Transportation
and Statistics, 8(3): 55-70.
UITP. 2006. Mobility in cities Database. International
Association of Public Transport (UITP) [CD]. UNDP. 2011. Human Development Report. United Nations Development Programme. Available from Internet: <http://hdr.undp.org/en/reports/global/hdr2011/ download/>.
EFIKASNOST INDIKATORA PRIVATNIH
M O T O R I Z O VA N I H P U T O VA N J A
U S M A N J I VA N J U K O R I Š Ć E N J A
AUTOMOBILA
Mehdi Moeinaddini, Zohreh Asadi-Shekari, Muhammad Zaly Shah
Sažetak: Slično projektovana naselja se mogu
odlikovati različitim navikama putovanja stanovnika tih naselja usled uticaja društveno
- ekonomskih pokazatelja. Takođe, postoje i neki efikasni indikatori poput prihoda i starosti stanovnika, kao i ličnog izbora stanovnika što se ne može lako proceniti, a što dovodi u pitanje prethodne napore da se opišu uticaji indikatora privatnih motorizovanih putovanja na korišćenje automobila uopšteno. Sa druge strane, indikatori privatnih motorizovanih putovanja su efikasni faktori koji utiču na navike u putovanju, ali ovim pokazateljima nije posvećena veća pažnja u ranijim istraživanjima. U radu je predstavljena višestruka linearna regresiona analiza za procenu povezanosti između indikatora privatnih motorizovanih putovanja i korišćenja automobila u raznim gradovima širom sveta u različitim društveno-ekonomskim kontekstima. Rezultati ove studije su dovoljno pouzdani da ilustruju ovu povezanost i u međunarodnim razmerama. Takođe, u ovom istraživanju identifikovani su značajni faktori privatnih motorizovanih putovanja koji se koriste u strategijama smanjenja korišćenja automobila u gradskim područjima.
Ključne reči: indikatori privatnih
motorizovanih putovanja, korišćenje privatnih automobila, održivo planiranje saobraćaja u gradu, višestruka linearna regresija.