HAL Id: hal-01008496
https://hal.archives-ouvertes.fr/hal-01008496
Submitted on 26 Aug 2019
HAL is a multi-disciplinary open access
archive for the deposit and dissemination of
sci-entific research documents, whether they are
pub-lished or not. The documents may come from
teaching and research institutions in France or
abroad, or from public or private research centers.
L’archive ouverte pluridisciplinaire HAL, est
destinée au dépôt et à la diffusion de documents
scientifiques de niveau recherche, publiés ou non,
émanant des établissements d’enseignement et de
recherche français ou étrangers, des laboratoires
publics ou privés.
mesoscale level
Jacqueline Saliba, Frédéric Grondin, Mohammed Matallah, Ahmed Loukili, H.
Boussa
To cite this version:
Jacqueline Saliba, Frédéric Grondin, Mohammed Matallah, Ahmed Loukili, H. Boussa. Modelling
of basic creep effect on concrete damage at a mesoscale level. Young Investigators Conference 2012,
2012, Aveiro, Portugal. pp.24 - 27. �hal-01008496�
YIC2012 — Universidade de Aveiro First ECCOMAS Young Investigators Conference A. Andrade-Campos, N. Lopes, R.A.F. Valente, H. Varum (editors) 24–27 April 2012, Aveiro. Portugal.
Modelling of basic creep effect on concrete damage at a mesoscale level
J. Saliba
a, F. Grondin
a,*, M. Matallah
b, A. Loukili
a, H. Boussa
caLUNAM Université, Institut de Recherche en Génie Civil et Mécanique (GeM) UMR-CNRS 6183
Ecole Centrale de Nantes, Nantes, France
bRisk Assessment and Management (RiSAM),
Université Aboubekr Belkaid, Tlemcen, Algeria
cDivision MOD-EVE, Centre Scientifique et Technique du Bâtiment, Marne-la-Vallée, France
*Corresponding author: frederic.grondin@ec-nantes.fr
Abstract.
In its service-life concrete is loaded and delayed strains appear due to creep phenomenon. Some theories suggest that micro-cracks nucleate and grow up when concrete is submitted to a high sustained loading, which contribute to make the concrete weaker. Thus, it is important to understand the interaction between the viscoelastic deformation and damage in order to design reliable civil engineering structures. Several creep-damage theoretical models have been proposed in the literature. However most of these models are based on empirical relations applied at the macroscopic scale. Coupling between creep and damage is mostly realised by adding some parameters to take into account the microstructure effects. In the author opinion, the microstructure effects can be modelled by taking into account the effective interactions between the concrete matrix and the inclusions. In this paper, a viscoelastic model is combined with an isotropic damage model. The material volume is modelled by a Digital Concrete model which takes into account the “real” aggregate size distribution of concrete. The results show that stresses are induced by strain incompatibilities between the matrix and aggregates at mesoscale under creep and lead to cracking.Keywords: Creep, mesoscopic model, concrete
1 INTRODUCTION
Deformation and fracture of concrete are associated with very complicated progressive failure. Tensile creep is an important issue especially in the case of special concrete structures. The effects of high stress levels on the long-term behaviour of concrete are important with reference to delayed strains, residual strength and permeability. Three main mechanisms were recognized for tensile creep [1, 2]: water seepage, viscous shear and microcracking. On one hand, creep deformations relax the stresses generated by autogenous shrinkage and thermal dilation at early ages [3, 4]. On the second hand, creep includes a detrimental substantial component of microcracking [5]. It is usually accepted that the failure process under a sustained load is associated with the development and growth of microcracking [6, 7, 8]. Thus, understanding the behaviour of concrete requires the detailed assessment of creep and the part of damage.
Coupling between the viscoelastic behaviour and damage is mostly realised by a classical approach in which a time dependent growth of damage is considered [9, 10, 11, 12]. In the author opinion, the microstructure effects can be modeled by taking into account the effective interactions between the concrete matrix and the inclusions. The multi-scales approach was found very useful for the evaluation of material characteristics affected by the material characteristics of the components. Thus, the mesoscale modelling presents many advantages in the
understanding of the fracture process and the corresponding effect of concrete heterogeneities [13, 14]. In addition it allows giving new elements for the comprehension of complex phenomena as the behaviour of concrete under confinement [15], temperature effect [16], sulphate attack [17] ...
In order to have more information on the behaviour of concrete under creep, coupling between a viscoelastic model and an isotropic damage model is operated and a Digital Concrete model is used to take into account the microstructure heterogeneities.
In the first section, the non linear viscoelastic model for the creep behaviour is presented. Then, the model parameters are determined by experimental tests on mortars under direct tensile creep. Finally, the numerical results obtained for direct tensile creep and flexural creep tests at the mesoscopic scale are compared to experimental measurements.
2 The numerical model
2.1 The non-linear viscoelastic model
The volume V of a heterogeneous material is formed by two media: a matrix defined by the medium Vm and
inclusions defined by the medium Vi. With the objective to model the damage due to creep of cement-based
materials, phases have a damage elastic behaviour. A constant load F is applied on one of the surface boundary of V. This load implies local displacements fields u y( ), local strain fields ε( )y and local stress fields σ( )y in each point y of V which are linked by the following behaviour law:
(
)
( )
y
C y
( , ( )) :
y
( )
y
p( )
y
v( )
y
σ
=
ε
ε
−
ε
−
ε
ɶ
(1)where C y( , ( ))ε y
ɶ is the damaged stiffness tensor of the material phases depending on the strain of phases, ( )
p y
ε the local plastic strain fields and εv( )y the local viscoelastic strain fields. The chosen damage model is the isotropic model developed by Fichant et al. [18]. It allows to represent the unilateral effect and to obtain objective results independently of the length of the finite elements by controlling the fracture energy. This model is a simplified version of the microplan model of Bazant and Ozbolt [19] and is based on the relation between the total stress and the effective stress ( )σɶ y of the material defined by:
0
( )
y
C
( ) :
y
e( )
y
σ
ɶ
=
ε
ɶ
or 0 1( )
y
C
( ) :
y
C
( , ( )) : ( )
y
y
y
σ
=
−ε
σ
ɶ
ɶ
ɶ
(2) where C0( )yɶ is the initial stiffness of the material phases considered isotropic and linear elastic. Stresses are
defined along a finite set of directions defined by unit vectors
n
[20]:(
)
3 2 1(1
)
(1
)
(
)
t i ij j t t ij i k kl ld n
n
d
n
n
n
σ
σ
τ
σ
σ
= −
= −
∑
−
(3)Where σ and τ represent the normal and tangential components of the local stress fields and
d
the scalar value of the isotropic damage which depends only on the elastic strain:(
)
0 01
dexp
e t d ed
ε
B
ε
ε
ε
= −
−
(4)where Btrepresents a damage parameter to control the slope of the strain softening constitutive relation in function of the width h of the element and εd0the strain threshold from which damage begins and is defined as the ratio between the tensile strength and the Young’s modulus (ε =d0 ft/E).
J. Saliba et al. | Young Investigator Conference 2012 3 energy dissipation. The Nadai criterion has been replaced by two Drucker-Prager yield functions. One to limit the tensile regime and the second to limit the compression and the compression-compression regime:
( )
( )
( )
( )
( )
( )
−
−
+
=
−
−
+
=
0 1 2 0 1 2~
~
~
~
w
p
w
I
J
F
w
p
w
I
J
F
ij c ij c c ij t ij t tσ
β
σ
α
σ
β
σ
α
(5)where
α
c,α
t,β
c andβ
t are four parameters in function of the relationship between the tensile limit stress and the compression one and the relationship between the bi-axial compressive state and the uni-axial one. The hardening law is considered as linear plastic:( )
.
0w p
=
q p
+
w
(6)where q is a model parameter, p is the effective plastic strain and
w
0 represents the elastic domain in the stress space. The viscoelastic strain is defined by Kelvin-voigt chains. With those elements, the stress history does not have to be stored for the calculation of creep strain [21]. For a Kelvin-voigt unit i, the basic strain evolution is given by:( )
( )
( )
v v v vt
k
t
t
η ε
ɺ
+
ε
=
σ
ɶ
(7)Where εɺv( )t represents the derivative of the elementary basic creep strains, kvthe stiffness and ηvthe viscosity of the Kelvin voigt unit.
The creep process occurs only in the undamaged part of the material and the effective stresses are linearized for each time step. The local total viscoelastic strains are obtained by solving analytically the differential equations and are expressed as:
1 1 1 n n n n v v v
a
v vb
v nc
v nε
+ε
+ε
ε
σ
σ
+∆
=
−
=
+
ɶ
+
ɶ
(8) Where n vε is the viscoelastic strain vector at time-step number n and a b cv, v, v depend upon material parameters. The total viscoelastic strain is deduced from the sum of all the elementary viscoelastic strains.
( )
1( )
1 i n v it
ε
t
= + =Ε
=
∑
(9)2.2 Digital concrete model
The Digital Concrete Model has been developed with the aim to have a 'realistic' representation of cement-based materials by taking into account the random size distribution of heterogeneities. So, for previous applications on the behaviour of concrete, the concrete microstructure was represented as a multi-phases material with successions of three material phases (cement paste, pores, aggregate of various sizes) spatially distributed in a random way. Each phase is characterized by a set of physical and geometrical parameters as: the volume fraction, the unit size (aggregate or pore diameter), physico-mechanical properties. A specific algorithm has been developed to make a spatial and random distribution of these phases on the basis of a F.E. grid. Details are given in [16]. Simulations on Representative Elementary Volume (REV) allow defining the REV dimensions and the finite element size chosen in accordance with the material characteristics and the problem type. Generally the REV dimensions are taken equal to four times the highest inclusion diameter and the finite element size is equal to 0.8 time the smallest inclusion diameter. Calculations have been performed to check the stability of results with these dimensions for different inclusions distributions.
The presented model is implemented in the finite element code CAST3M. Mechanical and basic creep parameters were identified from an experimental campaign performed in GeM laboratory.
3 Experimental identification of material parameters 3.1 Materials properties
Concrete and mortar specimens were mixed with Portland cement CPA-CEMII 42.5, crushed limestone aggregate distributed in fine sand, with a maximum size of 5 mm and a density of 2570 kg/m3 and crushed gravel of size 5 to 12.5 mm with a density of 2620 kg/m3. A superplasticizer agent (Glenium 27) with a quantity of 1.9 kg/m3 has been added for the workability of concrete. The same constituents were used for mortar. Table 1 shows the mix quantities of constituent materials for mortar and concrete. The mixtures were characterized by a water-to-cement ratio of 0.56. Three-point bending tests were realised on concrete beams with the dimensions 100 * 200 * 800 mm3 [21]. Tensile tests were realised on cylinder specimens φ110x500 mm2.
Table 1: Concrete and mortar mixtures proportions.
Constituents Dosage for concrete (Kg/m3) Dosage for mortar (Kg/m3)
Gravel: G5/12,5 mm 936.0 -
Sand: 0/5 mm 780.0 1270.0
Cement: CEMII 42.5 350.0 550.0
Water 219.5 330.0
3.2 Experimental procedures
All tests are performed in a climate controlled chamber at 50 % of relative humidity and temperature of 20°C. For creep tests, the exchange of moisture is prevented by a double layer of self-adhesive aluminium paper.
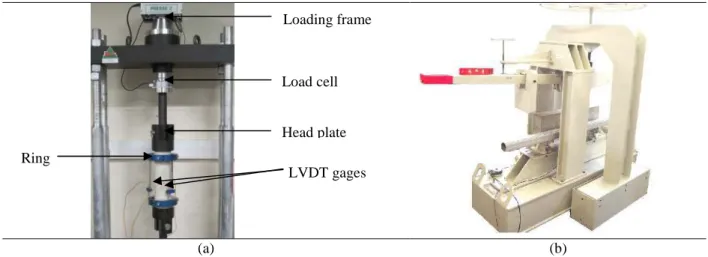
The flexural creep tests are performed on frames (Figure 1b) with a capacity ranging from 5 to 50 KN. The load is applied by gravity with a weight and counterweight system and the displacement is measured at midspan (Figure 1). Three-point bending creep tests are realized on notched specimens. Specimens are loaded in creep at 70% and 85 % of the maximum load (Fmax). The maximum load is measured in fracture tests with specimens at 28 days
controlled with the crack mouth opening displacement (CMOD).
Tensile tests are conducted in a 100 kN capacity electromechanical machine. For each specimen, two thick steel plates are fixed on the top and on the bottom using high modulus and strength epoxy. Two rings are fixed on the specimen with three screws. Three LVDT with an accuracy of ±3 µm are placed on the rings at 120°. The relative displacement between the two sections is measured on a base of 280 mm at the central zone. A general view of the experimental setup is provided in figure 1a. The load is applied with a constant rate of 0.2 kN/s; so that the maximal strength occurred at about 1 minute. During each test, load, LVDT displacement and load cell displacement are measured and recorded up to final failure with a data acquisition system. Two specimens are loaded in creep at 85 % and 70% of the maximum load.
(a) (b)
Figure 1: Tensile creep test setup (a) and general view of the flexural creep frame (b). Loading frame
LVDT gages Load cell
Head plate Ring
J. Saliba et al. | Young Investigator Conference 2012 5
3.2.1 Measurement of the concrete components properties
Concrete is modelled by a two-phase material considering aggregates embedded in the mortar matrix. So, the mechanical properties of mortar and aggregates have to be determined separately.
Two mortar specimens are submitted to rupture at the age of two months to measure the maximum load to be considered in creep tests. In this study, we consider that the matrix governs the viscoelastic behaviour of concrete. So, the basic creep parameters are also determined based on tensile creep tests on mortar. A constant load is maintained for 30 days at 70% and 85% of the maximal strength. The Kelvin-Voigt parameters of the viscoelastic model are then calibrated to give a calculated total strain evolution of mortar, performed for an uniform mortar volume, comparable to the measurements (Figure 2). The displacement rate is very fast in the first few days of loading (primary creep) and then stabilizes (secondary creep). Creep strain begins then to decrease in time indicating that shrinkage increases. The same behavior was observed by Reinhardt and Rinder [23] and Rossi et al. [24].
Creep strain for aggregates is considered equal to zero. The direct tensile test does not allow measuring the post-peak regime. The fracture energy (Gf) for each constituent is also given by the literature [25]. For aggregate, the
mechanical characteristics are obtained from the literature. A Young’s modulus of 60 GPa and a tensile strength of 6MPa are considered [26]. All the parameters that are used at the mesoscopic scale are summarized in table 3.
0 20 40 60 80 100 120 0 5 10 15 20 25 30 Time (days) S tr a in ( µ ε ) Sim 70% Exp 70% Sim 85% Exp 85%
Figure 2: Tensile creep strain of mortar specimens loaded at 70% and 85%.
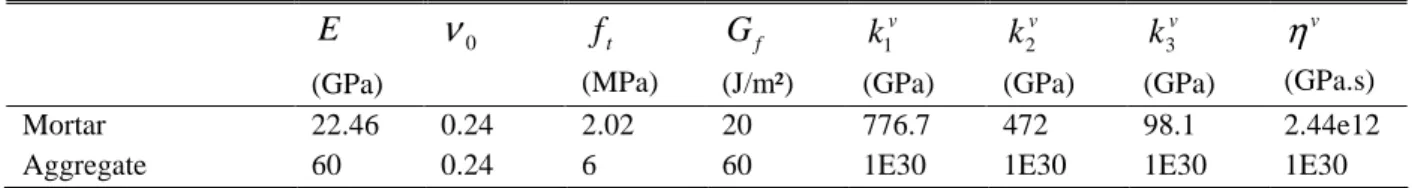
Table 2: Model parameters for mortar and aggregates
E
(GPa) 0ν
f
t (MPa) fG
(J/m²) 1 vk
(GPa) 2 vk
(GPa) 3 vk
(GPa) vη
(GPa.s) Mortar 22.46 0.24 2.02 20 776.7 472 98.1 2.44e12Aggregate 60 0.24 6 60 1E30 1E30 1E30 1E30
4 Application on concrete at the mesoscale
The considered mesoscale for modelling the behaviour of concrete is the scale at which the material can be observed as a set of coarse aggregates embedded in a mortar matrix. Here, coarse aggregates are inclusions of a size greater than 5 mm while mortar matrix is a mixture of finer aggregates and a cement paste. The aggregate volume represents 37% of the total volume of concrete. The stability of results depending on the size of the specimen and the maximal diameter of the inclusion was performed in a recent study [16] and was respected here (L/Dmax>4).
Table 3: The aggregate size distribution of concrete
φ (mm) 5 6.25 8 10 12.5
f
4.1 Creep behaviour in tension
The imposed constant load is equal to 70% or 85% of the maximal strength of concrete calculated by a fracture test. Figure 3 shows the macroscopic stress-strain curve obtained by the numerical simulation in comparison with experimental results. A good correlation is obtained and the post-peak region is very brittle as in the experimental tests. The numerical simulation and the experimental creep tests are presented in Figure 4. The numerical creep strain obtained with the digital concrete model is lower than creep strain for mortar specimen wish is expected as the aggregate do not creep. The specimens loaded at 85% fail after few days and the crack is localized at the end of the specimen. This failure may be due to stress concentration at both extremities. In addition, while concrete specimens fails, mortar specimens do not show any damage; thus the failure can be associated to the presence of the interfacial transition zone which is characterized by weak mechanical properties that should be simulated in the future for a real representation of this behaviour.
0 0,5 1 1,5 2 2,5 3 0 20 40 60 80 100 120 140 160 180 200 Strain (µε) S tr e s s ( M P a ) Sim Exp 1 Exp 2
Figure 3: Stress – strain relationship in tension and comparison with experimental results.
0 20 40 60 80 100 120 0 5 10 15 20 25 30 Time (days) S tr a in ( µ ε ) Sim 85% Sim 70% Exp 85% Exp 70%
Figure 4: Tensile creep strain of concrete specimens loaded at 70% and 85% and comparison with experimental results.
Figure 5 shows the damage localisation for concrete specimens loaded at 70% and 85%. The specimens loaded at 70% show little damage localized at the mortar-aggregate interface. The same result is obtained for the specimen loaded at 85% however the damage intensity is more important. This damage is due to the load application at the beginning and begins to increase with creep.
J. Saliba et al. | Young Investigator Conference 2012 7
Figure 5: Localisation of damage in concrete specimens loaded at 70% and 85% of the maximal strength.
4.2 Structural response on a three-point bending test
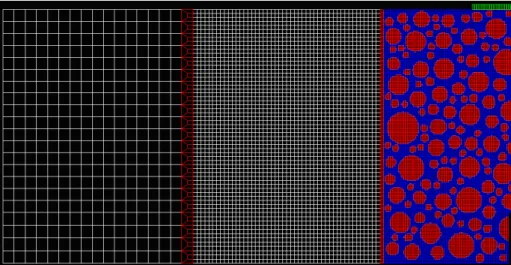
Numerical simulations are performed on concrete submitted to a three-point bending creep test and results are compared to experimental results analysed in a previous study [21]. Only half of the beam is analysed (100*200*400 cm3) due to a central symmetry around the notch. A regular mesoscopic mesh related to the middle part of the concrete specimen is generated and two homogeneous concrete blocks are attached to the left end of the beam with progressively larger mesh to avoid stress concentration (Figure 6). Numerical simulations are performed under stress plane conditions. The same parameters determined above are used for the mesoscopic mesh. For the homogeneous part, the parameters are determined by direct tensile test on homogenous concrete specimens. Creep compliance is assumed equal in compression and in tension which is in accordance with experimental evidences for mature concrete [27].
0 2 4 6 8 10 12 0 50 100 150 200 250 300 CMOD (µm) L o a d ( k N ) Sim Exp
Figure 7: Stress – CMOD relationship in flexion and comparison with experimental results.
A fracture test is performed to determine the maximal flexural strength (Figure 7). Calculated results of the typical load-CMOD curve are compared with experimental results. The evolution of local damage is also visualized in the material microstructure (Figure 8). The damage is localized at the front of the notch at the beginning of the test. Then cracks begin to join up together and cracks propagate in the mortar matrix.
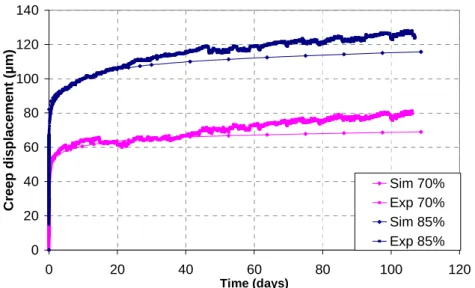
The proposed model is also suitable for the computations of creep damage in bending. In Figure 9 deflection-time curves are plotted for different load to peak load ratios. The macroscopic behaviour of concrete under creep loading is characterized by a progressive degradation of the material stiffness. This behaviour is caused by the growth and coalescence of micro-cracks in the concrete microstructure (Figure 10). That means that the mechanical properties of concrete are gradually and locally degraded under creep. Further, we assume that the concrete specimen collapses when a long continuous crack develops at the bottom of the specimen and at the same time the maximum axial strains of the elements along the main crack are higher than the corresponding ultimate strain.
Figure 8: Localisation of damage in concrete beams at 86, 100 of the maximal strength and 5% of the post peak region under three point bending test.
J. Saliba et al. | Young Investigator Conference 2012 9 0 20 40 60 80 100 120 140 0 20 40 60 80 100 120 Time (days) C re e p d is p la c e m e n t (µ m ) Sim 70% Exp 70% Sim 85% Exp 85%
Figure 9: Deflection-time curves of concrete beams in flexion for different stress to strength ratios
Figure 10: Damage and stress distributions along the depth at midspan evolution for different stress to strength ratios
5 CONCLUSIONS
A new model for the coupling of the viscoelastic behaviour and damage is developed at the mesoscopic scale to assess the creep of concrete. The parameters adopted for the simulations are identified by experimental tests on mortar. The microstructure effect is modelled by taking into account the effective interactions between the concrete matrix and inclusions. This model allows understanding the physical mechanisms behind the failure of concrete under constant loading. Under tensile creep, damage induced at the moment of load application increases due to strain incompatibilities between mortar and aggregates and causes a strength decrease. The obtained results for the flexural creep tests show crack propagation in the concrete microstructure from the notch. Similar observations are obtained with the acoustic emission technique used during the creep test. These experimental results will be presented in a future work.
This work has allowed highlighting the nucleation of micro-cracks in the concrete microstructure under a sustained load which contribute to the weakness of concrete observed in a recent work [21].
ACKNOWLEDGEMENT
This study has been performed in the project MEFISTO which is supported by the French National Research Agency (ANR - Agence Nationale pour la Recherche) in the program “Villes Durables” (Sustainable Cities) under grant number VD08_323065.
REFERENCES
[1] Bissonnette B., Pigeon M., Vaysburd A., Tensile creep of concrete: study of its sensivity to basic parameters. ACI Materials journal 104(4) : 360-368. 2007.
[2] Garas V.Y., Multi-scale investigation of tensile creep of ultrahigh performance concrete for bridge applications. PHD thesis in civil engineering in the school of civil and environmenta engineering, Georgia Institute of Technology. 2009. [3] Bissonnette B., Pigeon M., Tensile creep at early ages of ordinary, silica fume and fiber reinforced concretes. Cement and
Concrete Research 25(5) : 1075-1085. 1995.
[4] Altoubat S. A., Lange D. A., A new look at tensile creep of fiber reinforced concrete’. ACI Special Publication on Fiber Reinforced Concrete Ed. N. Banthia. 2003.
[5] Cook D.J., Haque M.N., The tensile creep and fracture of desiccated concrete and mortar on water sorption. Matériaux et constructions 7(39). 1974.
[6] Rossi P., Godart N., Robert J.L., Gervais J.P., Bruhat D., ‘Investigation of the basic creep of concrete by acoustic emission’, Materials and Structures 27 : 510-514. 1994.
[7] Bazant Z.P., Li Y., Cohesive crack with rate-dependent opening and viscoelasticity: I.mathematical model and scaling. International Journal of Fracture 86 : 247-265. 1997.
[8] Barpi F., Valente S., Lifetime evaluation of concrete structures under sustained post-peak loading. Engineering fracture mechanics 72(16) : 2427-2443. 2005
[9] Omar M., Déformations différées du béton : Etude expérimentale et modélisation numérique de l’interaction fluage - endommagement. PHD thesis at Ecole Centrale de Nantes. 2004.
[10]Mazzotti C., Savoia M., Nonlinear creep, Poisson’s ration, and creep-damage interaction of concrete in compression, ACI Materials Journal 99(5) : 450-457. 2002.
[11]Reviron N., Benboudjema F., Torrenti, J.-M., Nahas G., Millard A., Coupling between creep and cracking in tension. FRamcos 6: 495-502, Catania. 2007
[12]Torrenti J.M., Nguyen V.H., Colina H., Le Maou F., Benboudjema, Deleruyelle F., Coupling between leaching and creep of concrete. Cement and concrete research 38 : 816-821. 2008
[13]Grassl P., Jirasek M., Meso-scale approach to modelling the fracture process zone of concrete subjected to uniaxial tension. International Journal of Solids and Structures 47 : 957-968. 2010.
[14]Lopez C.M., Carol I., Aguado A., Meso-structural study of concrete fracture using interface elements. I: numerical model and tensile behaviour. Materials and structures 41 : 583-599. 2008.
[15]Dupray F., Malecot Y., Daudeville L., Buzaud E., A mesoscopic model for the behaviour of concrete under high confinement. International Journal for Numerical and Analytical Methods in Geomechanics 33 : 1407-1423. 2009. [16]Grondin F., Dumontet H., Ben Hamida A., Mounajed G., Boussa H., Multi-scales modelling for the behaviour of damaged
concrete. Cement and Concrete Research 37 : 1453–1462. 2007.
[17]Idiart A.E., Lopez C.M., Carol I., Chemo-mechanical analysis of concrete cracking and degradation due to external sulfate attack: A meso-scale model, Cement & Concrete Composites 33 : 411-423. 2011.
[18]Fichant S., Pijaudier-Cabot G., La Borderie C., Contiuum damage modeling: approximation of crack induced anisotropy. Mechanics Research Communications 24(2) : 109-114. 1997.
[19]Bazant Z.P., Ozbolt J., Nonlocal microplane model for fracture, damage, and size effect in structures. Journal of Engineering Mechanics, ASCE 116(1990) : 2485–2505. 1990.
[20]Fichant S., La Borderie C., Pijaudier-Cabot G., Isotropic and anisotropic descriptions of damage in concrete structures. Mechanics of Cohesive-Frictional Material 4(4) : 339-359. 1999.
[21]Saliba J., Loukili A., Grondin F., ‘Study of creep-damage coupling in concrete by acoustic emission technique’, Materials and Structures, In press, 2012.
[22]Benboudjema F., Torrenti J.M., Early age behaviour of concrete nuclear containments. Nuclear Engineering and Design 238 : 2495-2506. 2008
[23]Reinhardt H.-W., Rinder T., Tensile creep of high-strength concrete, Journal of Advanced Concrete Technology, 4(2) : 277-283. 2006.
[24]Rossi P., Tailhan J.-L., Le Maou F., Gaillet L., Martin E., Basic creep behavior of concretes investigation of the physical mechanisms by using acoustic emission. Cement and Concrete Research 42 : 61-73. 2012.
[25]La Borderie C., Lawrence C., Sornin G., Approche mésoscopique du comportement du béton, Apport de la représentation géométrique, European Journal of Environmental and Civil Engineering 11(4) : 407-421. 2007.
[26]Granger L., Comportement différé du béton dans les enceintes de centrales nucléaires analyse et modélisation. PHD thesis Laboratoire Central des Ponts et Chaussées Paris. 1996
[27]Brooks J.J., Neville A.M., Haque M.N., A comparaison of creep, elasticity and strength of concrete in tension and in compression, Magazine of Concrete Research, 30(104) : 1978.
_________________________________________________________