Research Article
Identification of Susceptibility Genes of Adult Asthma in
French Canadian Women
Jean-Christophe Bérubé,
1Nathalie Gaudreault,
1Emilie Lavoie-Charland,
1Laura Sbarra,
1Cyndi Henry,
1Anne-Marie Madore,
2Peter D. Paré,
3,4Maarten van den Berge,
5David Nickle,
6Michel Laviolette,
1Catherine Laprise,
2Louis-Philippe Boulet,
1and Yohan Bossé
1,71Institut Universitaire de Cardiologie et de Pneumologie de Qu´ebec, Quebec City, QC, Canada G1V 4G5
2D´epartement des Sciences Fondamentales, Universit´e du Qu´ebec `a Chicoutimi, Chicoutimi, QC, Canada G7H 2B1
3The University of British Columbia Center for Heart Lung Innovation, St. Paul’s Hospital, Vancouver, BC, Canada
4University of British Columbia Department of Medicine, Division of Respiratory Medicine, Vancouver, BC, Canada V5Z 1M9
5University Medical Center Groningen, GRIAC Research Institute, University of Groningen, Groningen, Netherlands
6Merck Research Laboratories (MRL), Seattle, WA, USA
7Department of Molecular Medicine, Laval University, Quebec City, QC, Canada G1V 0A6
Correspondence should be addressed to Yohan Boss´e; yohan.bosse@criucpq.ulaval.ca Received 17 July 2015; Accepted 5 December 2015
Copyright © 2016 Jean-Christophe B´erub´e et al. This is an open access article distributed under the Creative Commons Attribution License, which permits unrestricted use, distribution, and reproduction in any medium, provided the original work is properly cited. Susceptibility genes of asthma may be more successfully identified by studying subgroups of phenotypically similar asthma patients. This study aims to identify single nucleotide polymorphisms (SNPs) associated with asthma in French Canadian adult women. A pooling-based genome-wide association study was performed in 240 allergic asthmatic and 120 allergic nonasthmatic women. The top associated SNPs were selected for individual genotyping in an extended cohort of 349 asthmatic and 261 nonasthmatic women. The functional impact of asthma-associated SNPs was investigated in a lung expression quantitative trait loci (eQTL) mapping study (𝑛 = 1035). Twenty-one of the 38 SNPs tested by individual genotyping showed 𝑃 values lower than 0.05 for association with asthma. Cis-eQTL analyses supported the functional contribution of rs17801353 associated with C3AR1 (𝑃 = 7.90𝐸 − 10). The asthma risk allele for rs17801353 is associated with higher mRNA expression levels of C3AR1 in lung tissue. In silico functional characterization of the asthma-associated SNPs also supported the contribution of C3AR1 and additional genes including SYNE1, LINGO2, and IFNG-AS1. This pooling-based GWAS in French Canadian adult women followed by lung eQTL mapping suggested C3AR1 as a functional locus associated with asthma. Additional susceptibility genes were suggested in this homogenous subgroup of asthma patients.
1. Introduction
Substantial efforts have been deployed to discover the genetic variants associated with asthma [1, 2]. Asthma constitutes a considerable burden for individuals and health services with more than 300 million persons affected worldwide [3]. Various approaches have been used to identify asthma risk loci and genome-wide association studies (GWASs) have discovered the most robust genetic associations [4, 5]. This genomic approach still requires substantial resource in terms of sample size and genotyping. To reduce the genotyping burden, an alternative methodology has been developed,
which consists of a GWAS on pooled DNA samples (pooled GWAS) followed by further validation of the top associations by individual genotyping. This approach has been shown to be effective for several complex traits [6]. It has also been applied to asthma and has confirmed known asthma loci and led to the identification of new ones [7, 8].
GWAS SNPs discovered so far account for a relatively low percentage of the total asthma heritability. Studying more homogeneous subgroups of asthma patients is likely to reveal part of this “missing heritability.” The rationale is that individuals within subgroups are more likely to share the same underlying molecular basis. It is known that asthma
Volume 2016, Article ID 3564341, 12 pages http://dx.doi.org/10.1155/2016/3564341
Pooled GWAS 240 allergic asthmatic adult women 120 allergic nonasthmatic adult women 43 SNPs to validate
Individual
genotyping 349 asthmatic adult women261 nonasthmatic adult women
21 SNPs associated with asthma (P < 0.05) Lung eQTL analyses In silico functional prediction Validation in the SLSJ family collection for asthma
Figure 1: Overview of the experimental design.
prevalence differs between men and women throughout life [9]. This sex difference is not completely understood. Studying the genetics of asthma by gender and age groups is thus important [10].
In this study, we used a pooled GWAS to detect SNPs associated with asthma in French Canadian women enrolled in the Quebec City Case-Control Asthma Cohort (QCC-CAC). Confirmation by individual genotyping was followed by analyses of expression quantitative trait loci (eQTL) in human lung tissues, in silico analyses for functional predic-tion and validapredic-tion in a second collecpredic-tion of French Canadian women.
2. Methods
The experimental design is summarized in Figure 1.
2.1. Participants. Cases and controls included in this study
are part of the Quebec City Case-Control Asthma Cohort [11]. Briefly, the QCCCAC consists of unrelated adults of self-reported European ancestry recruited at the research center of the Institut Universitaire de Cardiologie et de
Pneumologie de Qu´ebec (IUCPQ). All research participants
were≥18 years old at enrollment. Individuals with chronic obstructive pulmonary disease (COPD), body mass index >40 kg/m2, and/or any systemic inflammatory disease were excluded. Individuals with self-reported genetic relatedness were also excluded. Participants provided written informed consent and the study was approved by the ethics committee of the IUCPQ. For the current study, only women were investigated and the asthma diagnosis was confirmed by a respirologist based on clinical symptoms, lung function, and airway responsiveness. Twenty-five inhalant allergens were evaluated by skin-prick tests to measure the allergic status. Participants were considered atopic if at least one allergen caused a wheal diameter of at least 3 mm at 10 min in the presence of a negative saline control and a positive histamine response. Asthma-associated SNPs were tested for replication in women participants of the Saguenay-Lac-Saint-Jean (SLSJ) asthma family collection (𝑛 = 353). Further
details are provided in Supplementary Material available online at http://dx.doi.org/10.1155/2016/3564341.
2.2. Pooled GWAS and Analysis. DNA extraction and sample
pooling methods are provided in Supplementary Material. Both pools (i.e., cases and controls) were genotyped in 6 replicates using the Illumina HumanOmniExpress Bead-Chip (Supplementary Figure 1). This SNP array interrogated 730,525 SNPs throughout the genome. The SNP array probes’ intensities were formatted and analyzed by the GenePool software [12]. GenePool ranked SNPs by increased likelihood of being genetically associated with asthma. To do so, the Manhattan distance method and the silhouette score cluster-ing method were used as implemented in GenePool. Each SNP was assigned a silhouette score that ranged from 0 to 1. A silhouette score of 1 indicates that the allele frequencies for a specific SNP are unequivocally different between cases and controls. Further details are provided in Supplementary Material.
2.3. Individual Genotyping and Genetic Association Tests.
Following the pooled GWAS, a total of 43 SNPs were selected for validation by individual genotyping. First, the 20 SNPs with the best silhouette score were included. Then, SNPs ranked in the top 2000 of the pooled GWAS and found in or near (50 kb) genes previously associated with asthma, COPD, or related phenotypes in candidate gene studies and GWAS were selected [2, 13]. This resulted in 23 additional SNPs for validation by individual genotyping. Selected SNPs (𝑛 = 43) were genotyped in an extended cohort of 349 asthmatic women and 261 nonasthmatic women derived from the QCCCAC. This extended cohort contained the women used in the pooled GWAS. Genotyping and quality controls are provided in Supplementary Material. After quality control, 38 out of the 43 SNPs remained. Association tests were done using additive logistic regression models as implemented in PLINK v1.07 [14]. Analyses were first performed in allergic cases (𝑛 = 299) and allergic controls (𝑛 = 154) women to mirror the selection of individuals used in the pooling-based GWAS. Analyses were then repeated in all available
cases (𝑛 = 349) and controls (𝑛 = 261) women with or without allergy in an attempt to increase sample size and evaluate the specificity of genetic signals.𝑃 value <0.05 was considered suggestive evidence of association.𝑃 value that passed Bonferroni correction (0.05/38 = 0.0013) was considered statistically significant.
2.4. eQTL and In Silico Analyses. The functional effects of
the asthma-associated SNPs were determined by examining their effect on gene expression in human lung tissue. The lung expression quantitative trait loci (eQTL) mapping study has been previously described [15, 16]. Briefly, 1111 lung specimens were obtained from patients who underwent lung resection at three sites: Laval University (Quebec City, Canada), University of Groningen (Groningen, Netherlands), and University of British Columbia (Vancouver, Canada). Whole-genome gene expression and genotyping data were obtained from these specimens. The genotyping platform used in the eQTL dataset is the Illumina Human1M-Duo BeadChip. The imputation was performed with SHAPEIT v2 and IMPUTE v2 using the 1000-genome project phase 1 data as a reference set. In the present study, SNPs associated with asthma, including SNPs in linkage disequilibrium (LD), were tested for association with gene expression in the Laval dataset (𝑛 = 407). Replication was then performed in the Groningen (𝑛 = 341) and UBC (𝑛 = 287) cohorts. In silico analyses were also performed to investigate the functional impact of asthma-associated SNPs. Tools used in this study are Combined-Annotation-Dependent Depletion (CADD) V1.3 [17], SNP Function Prediction (FuncPred) [18], Regu-lomeDB V1.1 [19], and Haploreg V4 [20]. Further details are provided in Supplementary Materials.
3. Results
3.1. Subjects. A total of 240 asthma patients and 120 controls
were considered in the pooled GWAS. All subjects were atopic women with mean age of34.0 ± 13.9 years for cases and 35.2 ± 14.3 years for controls, respectively. Individual genotyping was performed in an extended cohort of 349 asthmatic women and 261 controls. Clinical characteristics are summarized in Table 1.
3.2. Pooled GWAS. Genotyping data from DNA pools were
analyzed with the GenePool software. All SNPs were ranked according to the likelihood of being genetically associated with asthma using the silhouette score (Figure 2). The top 20 SNPs selected for individual genotyping are shown in Table 2 and ranked by the silhouette score. One SNP, rs17093106, failed the Illumina design assay step for indi-vidual genotyping and was replaced by the 21st top SNP, rs17500510. The SNP rs12418753 was ranked first with a silhouette score of 0.709. The silhouette scores in Table 2 ranged from 0.636 to 0.709. All SNPs were located in noncoding regions except SNP rs12881815 located in an exon of the SYNE2 gene. None of these SNPs had been previously associated with asthma. Twenty-three additional SNPs located near or within asthma candidate genes were well
ranked (i.e., top 2000) and selected for individual genotyping (Table 3).
3.3. Individual Genotyping. From the 43 selected SNPs that
were typed by individual genotyping, 38 passed quality controls. For the top 20 ranked SNPs in the pooled GWAS, 18 SNPs passed the quality controls. The genotyping assay failed for the only exonic SNP, rs12881815, and for rs12493799. For the 23 SNPs near candidate genes among the top 2000 ranked SNPs, 20 passed the quality controls.
The association with asthma was first tested in atopic women only to mirror the selection of women included in the pooled GWAS. Associations with asthma were suggestive for 29 SNPs out of 38 (76%) and 7 of them were significant after Bonferroni correction (Supplementary Table1). All 7 SNPs were part of the top ranked SNPs in the pooled GWAS. For the SNPs located near candidate genes and among the top 2000 ranked SNPs, 13 showed a suggestive evidence of association. Overall, only 9 SNPs had𝑃 values >0.05, ranging from 0.06 to 0.23.
The same 38 SNPs were then tested in an extended cohort containing all available cases and controls women genotyped in the QCCCAC. Twenty-one out of the 38 SNPs (55%) demonstrated suggestive associations with asthma (Table 4). Three SNPs were significant after correction for multiple testing including two from the top ranked SNPs and one from the SNPs near candidate genes. Association tests were also performed in 255 men (213 cases, 142 controls) of the QCCCAC and all suggestive associations were stronger in women compared to men (Supplementary Figure2). The two strongest associations involved two SNPs newly implicated in asthma, rs17655581 and rs7980829, located near SLC15A1 and in an intergenic region, respectively. In general, new SNPs identified in the top of the pooled GWAS showed stronger associations with asthma compared to those selected due to their proximity to candidate genes. However, three SNPs near candidate genes were part of the strongest associations. They were rs803010 near PTGDR and PTGER2, rs10932034 near
ICOS, and rs17453235 near DPP10. Results for the 21 SNPs
with𝑃 < 0.05 for association with asthma and those in LD are detailed in Supplementary Table2, including information on the genomic context, the LD mapping, the pooled GWAS, the individual genotyping in all case and control women, the replication in SLSJ family collection, and the in silico functional prediction.
3.4. Lung eQTL Analyses. To investigate the potential
func-tion of SNPs associated with asthma in the QCCCAC, we analyzed a large-scale lung eQTL dataset [15]. SNPs in LD (𝑛 = 309) with the 21 asthma-associated SNPs were tested in the eQTL dataset. Fifty-five out of these SNPs were genotyped in the lung eQTL dataset and the genotype information for the remaining SNPs was obtained by imputation. Each of them was tested against the expression levels of all noncontrol probesets interrogated by the gene expression microarray (𝑛 = 51,627). The most significant lung eQTL-SNP was rs75871129, which passed the Bonferroni correction for multiple testing threshold (3.1𝐸 − 9) and was associated with a probeset
T a ble 1: C linical ch ar ac te ri st ics o f w o m en. C h ar ac te ri st ics P o ol ed G W A S In d iv idu al ge n o ty pi ng SL SJ as th m a fa m ily co ll ec ti on Ca se s (𝑛 = 240 )C o n tr o ls (𝑛 = 120 ) 𝑃 val u es C as es (𝑛 = 349 )C o n tr o ls (𝑛 = 261 ) 𝑃 val u es C as es (𝑛 = 233 )C o n tr o ls (𝑛 = 120 ) 𝑃 val u es A ge (y ea rs) 34.0 ± 13.9 35 .2 ± 14.3 0.45 6 35 .5 ± 14.8 36.0 ± 14.8 0.6 91 30.6 ± 17 .8 4 0.6 ± 19 .4 < 0 .000 1 BMI (kg/m 2 )2 5. 3 ± 4.8 24 .4 ± 4.1 0.0 6 6 25 .9 ± 5.4 24.5 ± 4.5 0.0 01 24.5 ± 6.8 24 .4 ± 6.0 0.887 FE V1 (% p redic te d) 95 .1 ± 16.5 105.6 ± 11.7 < 0.0 0 01 94.4 ± 17 .2 10 6.4 ± 12.2 < 0 .000 1 92 .5 ± 16.3 10 0.8 ± 14 .2 < 0 .000 1 FV C (% p re dic te d) 107 .5 ± 14.6 111.0 ± 12.9 0.0 21 10 6.5 ± 15.3 111.6 ± 13.4 < 0 .000 1 9 9. 6 ± 15.9 10 5.4 ± 15.9 0.0 01 A H R (p o si ti ve :n eg at iv e:N A ) 18 9 :3 3:1 8 11 :1 0 9 :0 < 0 .0 0 01 25 8 :5 5:3 6 25 :2 33 :3 < 0 .000 1 10 8 :2 9 :96 18 :4 2 :60 < 0 .000 1 B lo o d Ig E (UI/mL) 32 1.7 ± 93 5. 8 133 .3 ± 25 2. 1 < 0.0 0 01 279 .3 ± 808.9 87 .0 ± 19 0.6 < 0.0 0 01 6 0 6.7 ± 10 89 .9 23 1. 5 ± 375 .8 < 0 .000 1 B lood eo si n o p h il s (% ) 3. 6 ± 2.6 2.4 ± 1.6 < 0.0 0 01 3.4 ± 2.5 2.2 ± 1.6 < 0.0 0 01 3.8 ± 2.7 2.7 ± 1.7 < 0 .000 1 A to p y (p o si ti ve :n eg at iv e:N A ) 24 0 :0:0 12 0 :0:0 < 0 .0 0 01 29 9 :4 6:4 15 4 :1 0 7 :0 < 0 .0 0 01 22 1 :0:1 2 11 1 :0:9 < 0 .000 1 Smok in g st atus (𝑛 )[ % ] N o n smo ke r 16 6 [6 9. 2] 85 [7 0.8] 0.0 01 22 5 [6 4.5] 19 0 [7 2.8] 0.0 02 15 5 [6 6 .5] 54 [45.0] 0.0 01 Ex-smo ke r 69 [2 8.7] 23 [1 9.2] 11 0 [3 1.5] 52 [1 9.9] 37 [15.9] 33 [2 7. 5] Sm o ker 5 [2.1] 12 [10.0] 14 [4.0] 19 [7 .3] 37 [15.9] 29 [2 4.2] BMI, b o d y mass in dex; FE V1, fo rced exp ira to ry vo lum e in 1 se co n d ;F V C ,f o rced vi tal ca paci ty ;A HR ,a ir wa y h yp er re sp o n si ve n ess, d efin ed as p ro vo ca ti ve con ce n tr at ion of m et h ac h o li n e in du ci ng a 20 % fall in FE V1 (PC2 0) < 8 m g/mL; and Ig E, imm u no gl ob u lin E. C o n tin uo us va ri ab les ar e exp ress ed as m ea n ± SD .𝑃 va lu es w er e ca lc ula ted usin g 𝑡-t est o r chi-s q u ar e tests as ap p ro p ri at e.
0E + 00 1E + 08 2E + 08 0E + 00 1E + 08 2E + 08 0E + 00 5E + 07 1E + 08 0E + 00 5E + 07 1E + 08 0E + 00 5E + 07 1E + 08 0E + 00 5E + 07 1E + 08 −5 −4 −3 −2 −10 − log ra nk −5 −4 −3 −2 −10 − log ra nk −5 −4 −3 −2 −10 − log ra nk −5 −4 −3 −2 −10 − log ra nk −5 −4 −3 −2 −10 − log ra nk −5 −4 −3 −2 −10 − log ra nk −5 −4 −3 −2 −10 − log ra nk −5 −4 −3 −2 −10 − log ra nk −5 −4 −3 −2 −10 − log ra nk −5 −4 −3 −2 −10 − log ra nk −5 −4 −3 −2 −10 − log ra nk −5 −4 −3 −2 −10 − log ra nk −5 −4 −3 −2 −10 − log ra nk −5 −4 −3 −2 −10 − log ra nk −5 −4 −3 −2 −10 − log ra nk −5 −4 −3 −2 −10 − log ra nk −5 −4 −3 −2 −10 − log ra nk −5 −4 −3 −2 −10 − log ra nk 5.0E + 07 1.0E + 08 1.5 E+ 08 5.0E + 07 1.0E + 08 1.5 E + 08 5.0E + 07 1.0E + 08 1.5 E + 08 2.0E + 08 0.0E + 00 0.0E + 00 5.0E + 07 1.0E + 08 1.5 E + 08 0.0E + 00 0.0E + 00 5.0E + 07 1.0E + 08 1.5 E + 08 0.0E + 00 5.0E + 07 1.0E + 08 1.5 E + 08 0.0E + 00 5E + 07 1E + 08 5E + 07 1E + 08 2E + 07 4E + 07 6E + 07 8E + 07 1E + 08 0E + 00 5E + 07 0E + 00 2E + 07 4E + 07 6E + 07 8E + 07 0E + 00 2E + 07 4E + 07 6E + 07 Position Position Position 1 2 3 4 5 6 7 8 9 10 11 12 13 14 15 16 17 18 Figure 2: Continued.
−5 −4 −3 −2 −10 − log ra nk −5 −4 −3 −2 −10 − log ra nk −5 −4 −3 −2 −10 − log ra nk −5 −4 −3 −2 −10 − log ra nk −5 −4 −3 −2 −10 − log ra nk 0E + 00 2E + 07 4E + 07 6E + 07 0E + 00 2E + 07 4E + 07 6E + 07 2E + 07 3E + 07 4E + 07 2E + 07 3E + 07 4E + 07 5E + 07 0.0E + 00 5.0E + 07 1.0E + 08 1.5 E + 08 Position Position 19 20 21 22 X
Figure 2: Genome-wide plot of the silhouette scores for the top 100,000 SNPs. The chromosome number is indicated on the top of each subgraph. The𝑦-axis represents the silhouette score ranking on a log scale and the 𝑥-axis indicates the position of the SNPs in physical distance.
interrogating C3AR1 (𝑃 = 4.06𝐸 − 10). The SNP was in perfect LD with the asthma-associated SNP rs17801353, which had a similar association with mRNA C3AR1 levels (𝑃 = 7.90𝐸 − 10). All the SNPs in this LD block (𝑅2 > 0.8) were
also associated with mRNA expression of C3AR1 in the lung. Figure 3 illustrates the lung eQTL rs17801353-C3AR1 in Laval as well as replications in Groningen and UBC. rs17801353 is located in an intron of FOXJ2 7.6 kb downstream of C3AR1. The eQTL was significant and showed the same direction of effect in the two replication cohorts (𝑃 < 0.05). The asthma risk allele for rs17801353 in the QCCCAC corresponds to the allele associated with higher mRNA expression levels for
C3AR1, suggesting that upregulation of this gene may increase
asthma susceptibility. The most significant lung eQTL (𝑃 < 10𝐸 − 5) are shown in Supplementary Table 3.
3.5. In Silico Functional Characterization. We investigated if
any of the LD SNPs were potentially implicated in regulatory mechanisms using bioinformatics tools. First, we employed CADD to score the deleteriousness of the 309 LD SNPs. A scaled𝐶-score higher than 10 was obtained for twenty-five of them, indicating that they are predicted to be in the 10% most deleterious genetic variants of the human genome. Of these 25 SNPs, six are part of LD block located in an intronic region of the gene LINGO2 on chromosome 9p21.1. SNP rs2295190 located on chromosome 6q25.1 showed the greatest scaled𝐶-score (24.5), implying that it is among the top 0.5% most deleterious SNPs of the human genome. This SNP is in LD with rs6934016 located near the ESR1 asthma susceptibility gene. The scaled𝐶-score of each LD SNP is shown in Supplementary Table2.
The FuncPred software recognised 184 out of the 309 LD SNPs and revealed regulatory predictions (Supple-mentary Table4). The intronic SNP rs13081182 showed the
strongest regulatory potential score (0.406). This SNP is in LD (𝑅2 = 0.94) with SNP rs17016738 associated with asthma in this study (Table 4). The nonsynonymous SNP rs2295190 also showed a strong regulatory potential score (0.395) and is implicated in splicing events. Located in SYNE1, this SNP was found to be probably damaging for SYNE1 based on PolyPhen v2 with a score of 0.994/1.00 (sensitivity: 0.69; specificity: 0.97). This SNP is in LD (𝑅2 = 0.85) with SNP
rs6934016 associated with asthma in this study (Table 4). The asthma risk allele (A) for rs2295190 corresponds to a missense change that occurs at position 8741 of the protein (L8741M). The FuncPred tool also revealed SNPs with high regulatory potential scores in the LD block located in an intronic region of gene LINGO2 on chromosome 9p21.1, the same LD block mentioned above with several high scaled𝐶-score SNPs.
The RegulomeDB V1.1 attributed a valid score to 276 LD SNPs according to the number of regulatory elements they influence (Supplementary Table 5). Two SNPs in the same haplotype block of chromosome 12p13.31, rs10846377 and rs7955798, were ranked highest with important sup-porting data. The regulatory prediction for rs10846377 was supported by data including eQTL, transcription factor binding, any motif, and DNase peak score. rs7955798 was supported by eQTL and transcription factor binding/DNase peak. These two SNPs were associated with mRNA expression levels of C3AR1 in circulating monocytes [21]. Both SNPs are in the same haplotype block identified by the lung eQTL analyses. Furthermore, the second most significant association following individual genotyping, rs7980829, was ranked third in the scores attributed by RegulomeDB V1.1. Many motifs are predicted to be altered by this variant and it is thus likely to affect binding of transcription factors in this region.
Table 2: The top 20 ranked SNPs in the pooled GWAS.
dbSNP ID Chromosome Silhouette score Gene Position
rs12418753 11p15.4 0.709 NLRP14 5UTR rs4487406 4q28.3 0.694 Intergenic rs17655581 13q32.3 0.692 Intergenic rs5904772 Xq27.3 0.689 Intergenic rs11134480 5q34 0.686 ODZ2 Intronic rs12881815 14q23.2 0.669 SYNE2 Exonic rs12629883 3q28 0.666 Intergenic rs10968574 9p21.1 0.661 LINGO2 Intronic rs11600687 11q25 0.658 Intergenic rs7980829 12q15 0.655 Intergenic rs11956185 5q35.2 0.654 Intergenic rs12070470 1p31.3 0.648 IL23R Intronic rs739337 8p22 0.647 MTMR7 Intronic rs5970666 Xp22.11 0.646 Intergenic rs881754 11q24.1 0.646 Intergenic rs12493799 3q27.3 0.646 Intergenic rs4808611 19p13.11 0.646 NR2F6 Intronic rs7896493 10p14 0.644 Intergenic rs2335562 13q12.12 0.643 Intergenic
rs17500510 6p21.32 0.636 HLA DQA2 Intronic
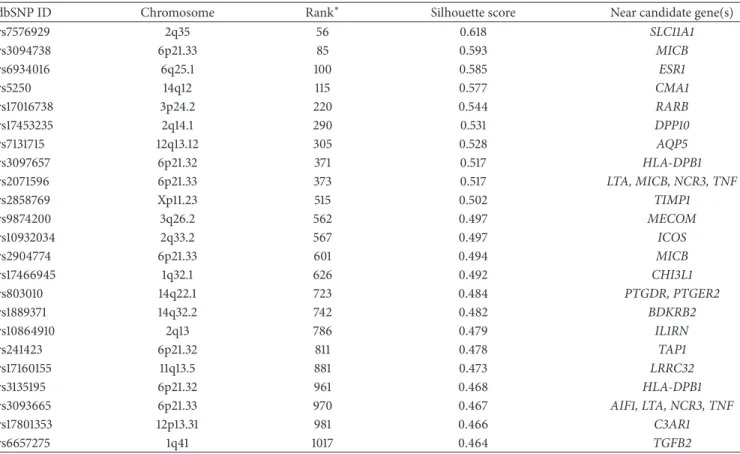
Table 3: SNPs ranked in the top 2000 of the pooled GWAS that are near or within asthma candidate genes and selected for individual genotyping.
dbSNP ID Chromosome Rank∗ Silhouette score Near candidate gene(s)
rs7576929 2q35 56 0.618 SLC11A1 rs3094738 6p21.33 85 0.593 MICB rs6934016 6q25.1 100 0.585 ESR1 rs5250 14q12 115 0.577 CMA1 rs17016738 3p24.2 220 0.544 RARB rs17453235 2q14.1 290 0.531 DPP10 rs7131715 12q13.12 305 0.528 AQP5 rs3097657 6p21.32 371 0.517 HLA-DPB1 rs2071596 6p21.33 373 0.517 LTA, MICB, NCR3, TNF rs2858769 Xp11.23 515 0.502 TIMP1 rs9874200 3q26.2 562 0.497 MECOM rs10932034 2q33.2 567 0.497 ICOS rs2904774 6p21.33 601 0.494 MICB rs17466945 1q32.1 626 0.492 CHI3L1 rs803010 14q22.1 723 0.484 PTGDR, PTGER2 rs1889371 14q32.2 742 0.482 BDKRB2 rs10864910 2q13 786 0.479 IL1RN rs241423 6p21.32 811 0.478 TAP1 rs17160155 11q13.5 881 0.473 LRRC32 rs3135195 6p21.32 961 0.468 HLA-DPB1 rs3093665 6p21.33 970 0.467 AIF1, LTA, NCR3, TNF rs17801353 12p13.31 981 0.466 C3AR1 rs6657275 1q41 1017 0.464 TGFB2
Table 4: Genetic association results for 38 SNPs tested by individual genotyping in 349 cases and 261 controls.
dbSNP ID Chromosome Minor allele Freq in cases∗ Freq in controls∗ Major allele 𝑃 value† Odd ratio
rs17655581 13q32.3 G 0.02 0.07 A 8𝐸 − 05 0.32 rs7980829 12q15 A 0.13 0.21 C 2𝐸 − 04 0.57 rs803010 14q22.1 A 0.30 0.21 G 4𝐸 − 04 1.60 rs10932034 2q33.2 A 0.25 0.17 G 0.001 1.59 rs10968574 9p21.1 G 0.10 0.05 A 0.002 2.07 rs17453235 2q14.1 G 0.13 0.08 A 0.005 1.71 rs12070470 1p31.3 G 0.12 0.07 A 0.005 1.78 rs881754 11q24.1 G 0.12 0.08 A 0.007 1.71 rs739337 8p22 G 0.05 0.02 A 0.008 2.54 rs11134480 5q34 G 0.13 0.09 A 0.012 1.61 rs17500510 6p21.32 A 0.14 0.09 G 0.018 1.55 rs2904774 6p21.33 G 0.03 0.01 A 0.019 3.43 rs7896493 10p14 A 0.13 0.09 G 0.019 1.55 rs6934016 6q25.1 A 0.14 0.10 C 0.020 1.53 rs12418753 11p15.4 A 0.04 0.02 G 0.021 2.30 rs3093665 6p21.33 C 0.03 0.01 A 0.021 2.62 rs17016738 3p24.2 A 0.30 0.24 G 0.023 1.35 rs17801353 12p13.31 C 0.40 0.34 A 0.028 1.30 rs9874200 3q26.2 G 0.11 0.07 A 0.029 1.58 rs5904772 Xq27.3 G 0.14 0.10 A 0.029 1.49 rs10864910 2q13 A 0.14 0.18 G 0.033 0.72 rs12629883 3q28 G 0.02 0.01 A 0.055 2.58 rs11956185 5q35.2 G 0.10 0.07 A 0.071 1.48 rs5250 14q12 A 0.13 0.09 G 0.082 1.39 rs6657275 1q41 G 0.32 0.27 A 0.088 1.24 rs3094738 6p21.33 G 0.08 0.06 A 0.099 1.47 rs3135195 6p21.32 C 0.06 0.04 A 0.129 1.53 rs7131715 12q13.12 G 0.09 0.07 A 0.130 1.39 rs4487406 4q28.3 G 0.08 0.06 A 0.190 1.36 rs3097657 6p21.32 G 0.05 0.04 A 0.190 1.45 rs2335562 13q12.12 A 0.18 0.16 G 0.218 1.21 rs5970666 Xp22.11 G 0.04 0.03 A 0.307 1.41 rs241423 6p21.32 A 0.04 0.06 G 0.311 0.76 rs4808611 19p13.11 A 0.17 0.15 G 0.312 1.17 rs17466945 1q32.1 C 0.11 0.09 A 0.316 1.22 rs2071596 6p21.33 A 0.15 0.14 G 0.453 1.13 rs17160155 11q13.5 G 0.14 0.12 A 0.488 1.13 rs11600687 11q25 A 0.09 0.09 G 0.774 1.06
∗Minor allele frequency in cases and controls.
†Sorted by𝑃 values.
The Haploreg V4 software recognised 283 out of the 309 LD SNPs and indicated that several LD SNPs were associ-ated with mRNA expression levels (Supplementary Table6). The rs7980829 and rs11177020 have been previously associ-ated with the mRNA expression levels of IFNG-AS1 in various tissues including lymphoblastoid cell lines of Europeans. The LD SNPs on chromosome 12p13.31 were also shown to be associated with mRNA expression levels of C3AR1 in whole blood.
3.6. Validation in the SLSJ Asthma Family Collection. To
confirm the genetic associations detected in the QCCCAC, the 21 asthma-associated SNPs were analyzed in the SLSJ asthma study. Clinical characteristics of cases and controls are indicated in Table 1. Eleven out of the 21 SNPs were directly genotyped. None of these SNPs was associated with asthma (Supplementary Table 7). The lowest 𝑃 value for association with asthma was with rs17016738 (𝑃 = 0.080). The remaining 10 SNPs were tested with proxies if available. None
Laval Groningen UBC 8.9 6.6 3 1.0 0.5 0 −0.5 −1.0 C3AR1 mRN A exp re ssio n le ve l C3AR1 mRN A exp re ssio n le ve l C3AR1 mRN A exp re ssio n le ve l GG (53) GT (181) TT (173) GG (42) GT (163) TT (136) GG (41) GT (128) TT (118) rs17801353 rs17801353 rs17801353 2.0 1.5 1.0 0.5 0 −0.5 −1.0 −1.5 1.5 1.0 0.5 0 −0.5 −1.0 −1.5 100 75 50 25 0 V ar ia n ce (%)
Figure 3: Boxplots of lung mRNA expression levels for C3AR1 according to genotype groups for SNP rs17801353 in lung tissues from Laval (𝑛 = 407), Groningen (𝑛 = 341), and UBC (𝑛 = 287). The right 𝑦-axis shows the proportion of the gene expression variance explained by the SNP (black bar). The𝑥-axis represents the three genotyping groups for SNP rs17801353 with the number of subjects in parenthesis.
of them showed association with asthma (Supplementary Table8).
4. Discussion
This pooled GWAS was performed on a relatively homoge-neous subgroup of asthma patients defined by age, atopic sta-tus, ethnicity, and gender (i.e., adult, atopic, French Canadian women with doctor diagnosed asthma). Several loci were associated with asthma and confirmed by individual geno-typing in an extended sample of French Canadian women. The functional meaning of asthma-associated SNPs was then evaluated in a large lung eQTL study, which supported
C3AR1 as an asthma susceptibility gene. In silico analyses also
supported C3AR1 as well as additional genes neighbouring functional asthma-associated SNPs.
Several GWASs have been performed to study the genet-ics of asthma [4, 5]. GWAS revealed numerous susceptibility loci that explain only a small fraction of the total asthma her-itability. GWASs have the potential to reveal additional loci using extended study design [22]. Studying subgroups of phe-notypically similar asthma patients instead of the traditional broad case-control format may reveal new susceptibility loci. Using this strategy, Bønnelykke et al. identified CDHR3 as a new susceptibility gene in childhood asthma with severe exacerbations [23]. Similarly, we used a homogeneous sub-group of asthma patients. Pooled genotyping was used as it is an economic approach to perform a preliminary screen for evidence of association. As recommended, this screen was followed by individual genotyping for confirmation [24]. SNPs identified with the pooled GWAS were in large part (76%) validated by individual genotyping in atopic women. This pooling-based approach has been used previously to study asthma and new risk loci were identified [7, 8]. These
two studies were conducted in allergic asthmatic children of white European descent and in a Chinese population, respectively. None of their findings were replicated in this study, which is likely explained by clinical, demographic, and genetic differences.
In this study, one functional SNP located 7.6 kb from
C3AR1 was associated with asthma. rs17801353 was associated
with asthma in the extended case-control sample (𝑃 = 0.028). Lung eQTL analysis demonstrated that rs17801353 is associated with expression levels of C3AR1. This SNP was selected for individual genotyping owing to its proximity with that candidate gene on chromosome 12p13.31. This eQTL is reported for the first time in lung tissue and demonstrated the functionality of rs17801353. However, in silico analyses identified a study conducted in circulating monocytes where two SNPs in LD with rs17801353 were found to act as eQTL for C3AR1 [21]. C3AR1 is involved in the pathogenesis of asthma via the complement system [25, 26]. The expression of this receptor is increased during asthmatic lung inflam-mation [27]. The same direction of effect is observed in the current study as the asthma risk allele increased the mRNA expression levels of C3AR1 in the three cohorts, which is also consistent with the study on circulating monocytes.
The two strongest associations with asthma after individ-ual genotyping in the QCCCAC were with rs17655581 and rs7980829. The first one is located on chromosome 13q32.3 at 5.1 kb 3of SLC15A1. This SNP received no clear prediction for putative function from the bioinformatic tools employed and was not implicated in any significant eQTL. The closest gene,
SLC15A1, is not known to be involved in asthma but is known
to cause inflammation in the intestine by the mediation of intracellular uptake of bacterial products [28]. For rs7980829, located on chromosome 12q15, RegulomeDB V1.1 predicted that this SNP may influence protein binding. Furthermore,
Haploreg V4 showed that the SNP is associated with the long intergenic noncoding RNA (lincRNA) expression levels of
IFNG-AS1. This lincRNA has been shown to influence and
regulate the expression of IFNG [29, 30]. Interestingly, IFNG is an inflammatory cytokine implicated in the pathophysiol-ogy of asthma [31].
One LD block located in an intronic region of the gene
LINGO2 on chromosome 9p21.1 contained the most
poten-tially deleterious SNPs predicted by in silico analyses. This leucine-rich repeat and Ig domain-containing 2 (LINGO2) gene is not known to be implicated in asthma. A recent study found that SNPs flanked by LINGO2 were associated with airway responsiveness in chronic obstructive pulmonary disease [32]. These SNPs are not in LD with any of the SNPs in the LD block identified in this study (all𝑅2< 0.05).
Among the LD SNPs, only rs2295190 was located in an exon and PolyPhen 2 predicted this missense variant as probably damaging for SYNE1. The asthma risk allele for rs6934016 (A) identified by individual genotyping corre-sponds to the allele in LD with SNP rs2295190 (T) producing a missense change. SYNE1 has never been associated with asthma, but two intronic SNPs of this gene have been asso-ciated with forced vital capacity according to the Phenotype-Genotype Integrator (PheGenI) [33]. SYNE1 is expressed in skeletal and smooth muscle, particularly in the sarcomeres [34]. Thus, SYNE1 could potentially have an effect on airway smooth muscle and influence muscle function during asthma attacks. Interestingly, one missense SNP in a related gene,
SYNE2, was significant in the pooled GWAS but failed
individual genotyping. SYNE1 and SYNE2 are known to be implicated in several diseases such as lung cancer [35]. Their role in the physiopathology of asthma remains to be confirmed.
Associations were revealed with SNPs among the top 2000 ranked SNPs and near candidate genes. The third most important association with asthma was found with rs803010 (𝑃 = 4.4 × 10⁻⁴) located in the promoter of the prostaglandin D2 receptor (PTGDR). This gene is known to be involved in asthma in Caucasian populations [36, 37]. PTGDR is activated by PGD2 and leads to an increase of intracellular cAMP [38]. This augmentation is notably associated with more pronounced Th2 inflammation [39]. PTGDR may be implicated in bronchial hyperreactivity since knockout mice (Ptgdr−/−) are protected against ovalbumin-induced hyperre-activity [40].
Genetic associations observed in the QCCCAC were not replicated in SLSJ asthma family collection. This could be partly due to the relatively small sample size of both datasets. Attempt to replicate was worthy as these two cohorts share similar age, asthma definition, and genetic background (both being French Canadian). The analyses were also restricted to women. However, asthma heterogeneity, not captured by our study design, may also be responsible for the lack of replication.
The main limitation of this study is the small sample size in which we performed the initial pooled GWAS screen and individual genotyping. However, the identification of loci known to be associated with asthma demonstrated
the validity of our study and lends credence to the findings of novel loci. The value and innovation of this study were to investigate the genetic factors involved in a phenotypi-cally similar group of asthma patients. Only asthmatic and nonasthmatic women with allergy were selected for the pooled GWAS. This strategy is likely to be more powerful and to require smaller sample size in order to identify the genetic factors underpinning asthma.
In summary, we used pooling-based GWAS to study asthma in a homogeneous population of adult French Cana-dian women. We then took advantage of a large-scale lung eQTL dataset and bioinformatics tools to examine the func-tional significance of our discoveries. Our data supported the potential role of C3AR1 in asthma. This study also suggests a potential role for new loci, namely, SYNE1, LINGO2, and
IFNG-AS1, in the pathogenesis of asthma.
Competing Interests
The authors declare no financial or personal relationships with people or organizations that could inappropriately influence their work in the present paper.
Authors’ Contributions
Anne-Marie Madore analyzed the data of the SLSJ asthma family collection and revised the paper. Catherine Laprise contributed to the data of the SLSJ asthma family collection and revised the paper. Cyndi Henry contributed to the DNA extraction and genotyping of the QCCCAC subjects. David Nickle contributed to the data of the lung eQTL dataset. Emilie Lavoie-Charland contributed to the DNA extraction and genotyping of the QCCCAC subjects. Jean-Christophe B´erub´e analyzed and interpreted the data, per-formed bioinformatics analyses, and wrote the paper. Laura Sbarra contributed to the DNA extraction and genotyping of the QCCCAC subjects. Louis-Philippe Boulet contributed to the data of the QCCCAC. Maarten van den Berge contributed to the data of the lung eQTL dataset. Michel Laviolette contributed to the data of the lung eQTL dataset and revised the paper. Nathalie Gaudreault contributed to the DNA extraction and genotyping of the QCCCAC subjects and revised the paper. Peter D. Par´e contributed to the data of the lung eQTL dataset and revised the paper. Yohan Boss´e designed the research study, analyzed and interpreted the data, and wrote the paper.
Acknowledgments
The authors would like to thank Christine Racine and Sabrina Biardel at the IUCPQ site of the Respiratory Health Network (RHN) Tissue Bank of the FRQS for their valuable assis-tance. Jean-Christophe B´erub´e was a recipient of doctoral studentships from the Respiratory Health Network of the “Fonds de Recherche Qu´ebec-Sant´e” (FRQS) and the “Centre de Recherche Institut Universitaire de Cardiologie et de Pneumologie de Qu´ebec.” He is now recipient of a doc-toral scholarship from the Canadian Respiratory Research
Network (CRRN). Yohan Boss´e was the recipient of a Junior 2 Research Scholar award from the FRQS and now holds a Canada Research Chair in Genomics of Heart and Lung Diseases. This study was partly supported by the Chaire de Pneumologie de la Fondation JD B´egin de l’Universit´e Laval, the Fondation de l’Institut Universitaire de Cardiologie et de Pneumologie de Qu´ebec, the Respiratory Health Net-work of the FRQS, and the Canadian Institutes of Health Research (MOP-123369). Catherine Laprise is the director of the Inflammation and Remodeling Strategic Group of the Respiratory Health Network of the FRSQ and member of Allergen network. Catherine Laprise holds a Canada Research Chair in Environment and Genetics of Respiratory Diseases and Allergy and is supported by CIHR.
References
[1] M. E. March, P. M. A. Sleiman, and H. Hakonarson, “Genetic polymorphisms and associated susceptibility to asthma,” Inter-national Journal of General Medicine, vol. 6, pp. 253–265, 2013. [2] Y. Boss´e and T. J. Hudson, “Toward a comprehensive set of
asthma susceptibility genes,” Annual Review of Medicine, vol. 58, pp. 171–184, 2007.
[3] Global Initiative for Asthma, “Global strategy for asthma management and prevention,” February 2012, http://www.gin-asthma.org/.
[4] Y. Zhang, M. F. Moffatt, and W. O. C. Cookson, “Genetic and genomic approaches to asthma: new insights for the origins,” Current Opinion in Pulmonary Medicine, vol. 18, no. 1, pp. 6–13, 2012.
[5] L. Akhabir and A. J. Sandford, “Genome-wide association studies for discovery of genes involved in asthma,” Respirology, vol. 16, no. 3, pp. 396–406, 2011.
[6] Y. Boss´e, F. Bacot, A. Montpetit et al., “Identification of suscepti-bility genes for complex diseases using pooling-based genome-wide association scans,” Human Genetics, vol. 125, no. 3, pp. 305–318, 2009.
[7] G. Ricci, A. Astolfi, D. Remondini et al., “Pooled genome-wide analysis to identify novel risk loci for pediatric allergic asthma,” PLoS ONE, vol. 6, no. 2, Article ID e16912, 2011.
[8] R. Anantharaman, A. K. Andiappan, P. P. Nilkanth, B. K. Suri, D. Y. Wang, and F. T. Chew, “Genome-wide association study identifies PERLD1 as asthma candidate gene,” BMC Medical Genetics, vol. 12, article 170, 2011.
[9] C. Ober, D. A. Loisel, and Y. Gilad, “Sex-specific genetic architecture of human disease,” Nature Reviews Genetics, vol. 9, no. 12, pp. 911–922, 2008.
[10] R. A. Myers, N. M. Scott, W. J. Gauderman et al., “Genome-wide interaction studies reveal sex-specific asthma risk alleles,” Human Molecular Genetics, vol. 23, no. 19, pp. 5251–5259, 2014. [11] ´E. Lavoie-Charland, J.-C. B´erub´e, M. Laviolette, L.-P. Boulet, and Y. Boss´e, “Multivariate asthma phenotypes in adults: the quebec city case-control asthma cohort,” Open Journal of Respiratory Diseases, vol. 3, no. 4, pp. 133–142, 2013.
[12] J. V. Pearson, M. J. Huentelman, R. F. Halperin et al., “Iden-tification of the genetic basis for complex disorders by use of pooling-based genomewide single-nucleotide-polymorphism association studies,” The American Journal of Human Genetics, vol. 80, no. 1, pp. 126–139, 2007.
[13] Y. Bosse, “Updates on the COPD gene list,” International Journal of Chronic Obstructive Pulmonary Disease, vol. 7, pp. 607–631, 2012.
[14] S. Purcell, B. Neale, K. Todd-Brown et al., “PLINK: a tool set for whole-genome association and population-based linkage analyses,” American Journal of Human Genetics, vol. 81, no. 3, pp. 559–575, 2007.
[15] K. Hao, Y. Boss´e, D. C. Nickle et al., “Lung eQTLs to help reveal the molecular underpinnings of asthma,” PLoS Genetics, vol. 8, no. 11, Article ID e1003029, 2012.
[16] Y. Boss´e, D. S. Postma, D. D. Sin et al., “Molecular signature of smoking in human lung tissues,” Cancer Research, vol. 72, no. 15, pp. 3753–3763, 2012.
[17] M. Kircher, D. M. Witten, P. Jain, B. J. O’roak, G. M. Cooper, and J. Shendure, “A general framework for estimating the relative pathogenicity of human genetic variants,” Nature Genetics, vol. 46, no. 3, pp. 310–315, 2014.
[18] Z. Xu and J. A. Taylor, “SNPinfo: integrating GWAS and candidate gene information into functional SNP selection for genetic association studies,” Nucleic Acids Research, vol. 37, no. 2, pp. W600–W605, 2009.
[19] A. P. Boyle, E. L. Hong, M. Hariharan et al., “Annotation of functional variation in personal genomes using RegulomeDB,” Genome Research, vol. 22, no. 9, pp. 1790–1797, 2012.
[20] L. D. Ward and M. Kellis, “HaploReg: a resource for exploring chromatin states, conservation, and regulatory motif alter-ations within sets of genetically linked variants,” Nucleic Acids Research, vol. 40, no. 1, pp. D930–D934, 2012.
[21] T. Zeller, P. Wild, S. Szymczak et al., “Genetics and beyond-the transcriptome of human monocytes and disease susceptibility,” PLoS ONE, vol. 5, no. 5, Article ID e10693, 2010.
[22] G. A. Lockett and J. W. Holloway, “Genome-wide association studies in asthma; perhaps, the end of the beginning,” Current Opinion in Allergy and Clinical Immunology, vol. 13, no. 5, pp. 463–469, 2013.
[23] K. Bønnelykke, P. Sleiman, K. Nielsen et al., “A genome-wide association study identifies CDHR3 as a susceptibility locus for early childhood asthma with severe exacerbations,” Nature Genetics, vol. 46, no. 1, pp. 51–55, 2013.
[24] N. Norton, N. M. Williams, M. C. O’Donovan, and M. J. Owen, “DNA pooling as a tool for large-scale association studies in complex traits,” Annals of Medicine, vol. 36, no. 2, pp. 146–152, 2004.
[25] A. A. Humbles, B. Lu, C. A. Nilsson et al., “A role for the C3a anaphylatoxin receptor in the effector phase of asthma,” Nature, vol. 406, no. 6799, pp. 998–1001, 2000.
[26] K. Hasegawa, M. Tamari, C. Shao et al., “Variations in the C3, C3a receptor, and C5 genes affect susceptibility to bronchial asthma,” Human Genetics, vol. 115, no. 4, pp. 295–301, 2004. [27] S. M. Drouin, J. Kildsgaard, J. Haviland et al., “Expression of the
complement anaphylatoxin C3a and C5a receptors on bronchial epithelial and smooth muscle cells in models of sepsis and asthma,” Journal of Immunology, vol. 166, no. 3, pp. 2025–2032, 2001.
[28] M. Zucchelli, L. Torkvist, F. Bresso et al., “PepT1 oligopeptide transporter (SLC15A1) gene polymorphism in inflammatory bowel disease,” Inflammatory Bowel Diseases, vol. 15, no. 10, pp. 1562–1569, 2009.
[29] S. P. Collier, P. L. Collins, C. L. Williams, M. R. Boothby, and T. M. Aune, “Cutting edge: influence of Tmevpg1, a long intergenic noncoding RNA, on the expression of Ifng by Th1 cells,” The Journal of Immunology, vol. 189, no. 5, pp. 2084–2088, 2012.
[30] S. P. Collier, M. A. Henderson, J. T. Tossberg, and T. M. Aune, “Regulation of the Th1 genomic locus from Ifng through Tmevpg1 by T-bet,” Journal of Immunology, vol. 193, no. 8, pp. 3959–3965, 2014.
[31] L. K. Teixeira, B. P. F. Fonseca, B. A. Barboza, and J. P. B. Viola, “The role of interferon-𝛾 on immune and allergic responses,” Memorias do Instituto Oswaldo Cruz, vol. 100, no. 1, pp. 137–144, 2005.
[32] N. N. Hansel, P. D. Pare, N. Rafaels et al., “Genome wide association study identifies novel loci associated with airway responsiveness in COPD,” American Journal of Respiratory Cell and Molecular Biology, vol. 53, no. 2, pp. 226–234, 2015. [33] E. M. Ramos, D. Hoffman, H. A. Junkins et al.,
“Phenotype-genotype integrator (PheGenI): synthesizing genome-wide association study (GWAS) data with existing genomic resources,” European Journal of Human Genetics, vol. 22, no. 1, pp. 144–147, 2014.
[34] Q. Zhang, C. Ragnauth, M. J. Greener, C. M. Shanahan, and R. G. Roberts, “The nesprins are giant actin-binding proteins, orthologous to Drosophila melanogaster muscle protein MSP-300,” Genomics, vol. 80, no. 5, pp. 473–481, 2002.
[35] S. Cartwright and I. Karakesisoglou, “Nesprins in health and disease,” Seminars in Cell and Developmental Biology, vol. 29, pp. 169–179, 2014.
[36] M. Isidoro-Garc´ıa, C. Sanz, V. Garc´ıa-Solaesa et al., “PTGDR gene in asthma: a functional, genetic, and epigenetic study,” Allergy, vol. 66, no. 12, pp. 1553–1562, 2011.
[37] G. Zhu, J. Vestbo, W. Lenney et al., “Association of PTGDR gene polymorphisms with asthma in two Caucasian populations,” Genes and Immunity, vol. 8, no. 5, pp. 398–403, 2007.
[38] V. Garc´ıa-Solaesa, C. Sanz-Lozano, J. Padr´on-Morales et al., “The prostaglandin D2 receptor (PTGDR) gene in asthma and allergic diseases,” Allergologia et Immunopathologia, vol. 42, no. 1, pp. 64–68, 2014.
[39] M. Arima and T. Fukuda, “Prostaglandin D2and T𝐻2 inflam-mation in the pathogenesis of bronchial asthma,” The Korean Journal of Internal Medicine, vol. 26, no. 1, pp. 8–18, 2011. [40] T. Matsuoka, M. Hirata, H. Tanaka et al., “Prostaglandin D2 as
a mediator of allergic asthma,” Science, vol. 287, no. 5460, pp. 2013–2017, 2000.