The views expressed in this report do not reflect those of the
World Bank or its Board.
Shaping the Future
A Long-Term Perspective of People and Job Mobility
for the
Middle East and North Africa
TABLE OF CONTENTS
Migration from MENA to OCED Countries: Trends, Determinants, and Prospects
By Flore Gubert and Christophe J. Nordman
Prospects for Management of Migration between Europe and the Middle East and North Africa
By Johannes Koettl
Labor Migration in the Middle East and North Africa: A View from the Region
By Georges Corm
Migration from Egypt, Morocco, and Tunisia: Synthesis of Three Case Studies
PREFACE
This volume contains four background papers commissioned from various authors by the World Bank as the initial step following the decision to embark, jointly with the European Commission, on a study of migration in the Middle East and North Africa (MENA) Region. The papers thus constitute singly the building blocks and, together, the foundation of the main study contained in the main volume. The four papers have many commonalities. They deal—in different depth and breadth—with the main migration parameters (stocks, flows, migrant characteristics) and their determinants: (i) the role of education and skills; (ii) the economic impact of migration, especially remittance flows; (iii) the prospects for offshoring and outsourcing; and (iv) the role of migration institutions, policies, and management.
The first two papers—by Gubert and Nordman, and Koettl—focus on labor migration from the MENA Region to member countries of the Organisation for Economic Co-operation and Development (OECD) (Europe especially) and the convergence of interest between the two. These papers draw heavily on population and labor force projections to ask “Can migrants from the MENA Region help filling labor market gaps in OECD countries?” (Gubert and Nordman) and to point out good migration policy practices for Europe (Koettl). If the first two papers deal largely with the demand side, the last two address the supply (MENA) side. These papers are strong on institutions and point to good migration policy practices as well as shortcomings among migrant sending countries. The first of these two papers (Corm) looks at the region as a whole, whereas the second (Schramm) is a synthesis of three country case studies (the Arab Republic of Egypt, Morocco, Tunisia) carried out in 2006 by Tahar Abdessalem, Ahmed Basti, Mohamed Khachani, Fouzi Mourj, and Ayman Zohry, and the International Organization for Migration (IOM) country branches of Tunis and Cairo.
The caveats about the data noted in the Introduction to the main volume apply here, too, and are reiterated in the individual background papers. The papers that follow are based on the best and most up-to-date data available as of the time of their preparation.
World Bank staff commented extensively on the papers in this volume, but the views expressed in them are the authors’ and do not necessarily represent those of the Bank.
Migration from MENA to OECD Countries:
Trends, Determinants, and Prospects
Flore Gubert
and
ABBREVIATIONS AND ACRONYMS ANPE Agence nationale pour l'Emploi
DARES Direction de l’Animation de la Recherche, des Etudes et des Statistiques
DL Dumont and Lemaître
DM Docquier and Marfouk
DGTPE Direction Générale du Trésor et de la Politique Économique
EECA Eastern Europe and Central Asia
EU European Union
FAP Nomenclature des familles professionnelles
GCC Gulf Cooperation Council GDP Gross Domestic Product
ILO International Labor Organization ISCED International Standard Classification of Education JVR Job Vacancy Rate
LDCs Least Developed Countries
NACE General Industrial Classification of Economic Activities MENA Middle East and North Africa
MPI Migration Policy Institute
OECD Organisation for Economic Co-operation and Development OLDC Other Least Developed Countries
OLS Ordinary least squares PPP Purchasing power parity UAE United Arab Emirates
TABLE OF CONTENTS
INTRODUCTION AND SUMMARY...1
I. OVERVIEW OF REGIONAL MIGRATION TRENDS...4
1. Migration from MENA to OECD Countries: A Host Countries’ Perspective...4
2. Migration from MENA to OECD Countries: A Sending Countries’ Perspective ...9
3. Country Facts...12
II. GRAVITY MODEL ANALYSES OF MIGRATION TRENDS FROM MENA TO OECD COUNTRIES...17
1. A Review of Migration Theories and Determinants...17
2. Data Collection ...20
3. The Determinants of Migration: A Gravity Approach...22
3.1. Cross-Sectional Data Analysis ...23
3.2 Panel Data Analysis...29
III. CAN MIGRANTS FROM MENACOUNTRIES BE A SOLUTION TO LABOR SHORTAGES IN OECDCOUNTRIES...33
1. Labor Shortages in OECD Countries...33
1.1. Overview ...33
1.2. Recruitment Difficulties and Skill Shortages in France ...38
1.3 Domestic Labor Market Reforms or Increased Migration?...41
2. Can Migrants from the MENA Region Help Filling Labor Market Gaps in OECD Countries? ...42
2.1 Demographic Prospects...42
2.2 Europe’s Skills Requirements and MENA’s Skill Supply: Is There a Match? ...44
STATISTICAL ANNEX...54
Annex A. Descriptive Statistics...54
Annex B. Estimation Results...77
TABLES
Table 1 Emigration from Algeria since the 19th Century ...12
Table 2 Major Foreign Communities in the GCC States, 2002 ...14
Table 3 The Determinants of Migration Using Gravity Models ...32
Table 4 The 20 Occupations with the Strongest Labor Shortages in France (July 04-July 05) ..40
Table 5 Unemployment Rates by MENA Country in Recent Years...43
Table 6 Immigrants from Maghreb and Mashreq Countries by Type of Activity in Spain, 2001 ...45
Table 7 Business Environment in the MENA Region ...51
FIGURES Figure 1 Distribution of Migrants by Region of Origin and Sub-Group of OECD Countries ...5
Figure 2 Distribution of Migrants from the MENA Region by Sub-Region of Origin and Sub-Group of OECD Countries, 2000 ...6
Figure 3 Share of Highly Educated Migrants from MENA Countires in OECD countries ...7
Figure 4a Share of Migrants from MENA Countries in the Migratory Flows to Some Selected Continental European Countries, 1995-2002 ...8
Figure 4b Share of Migrants from MENA Countries in the Migratory Flows to Some Selected Northern European Countries, 1995-2002 ...8
Figure 4c Share of Migrants from MENA Countries in the Migratory Flows to Some Selected Anglo-Saxon Countries, 1995-2002...8
Figure 5 Expatriation Rates to OECD Countries of Population Aged 25 and Over, By MENA Country ...9
Figure 6 Distribution of Migrants from the MENA Region by Sub-Region of Destination and Sub-Group of MENA Countries, 2000 ...10
Figure 7 Highly Educated Expatriation Rate by MENA Country, 2000 ...11
Figure 8a Composition of Migrant Stocks by Level of Education and Sending Country, 1990....11
Figure 8b Composition of Migrant Stocks by Level of Education and Sending Country, 2000....12
Figure 9a Number of Job Vacancies in Some European Countries, 2001-2004 ...34
Figure 9b Number of Occupied Jobs in Some European Countries, 2001-2004...34
Figure 10 Job Vacancy Rate in Some European Countries, 2001-2004...35
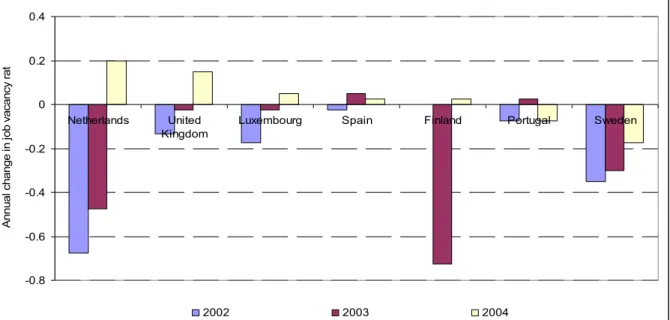
Figure 11 Annual Changes in Job Vacancy Rate, 2002-2004 ...35
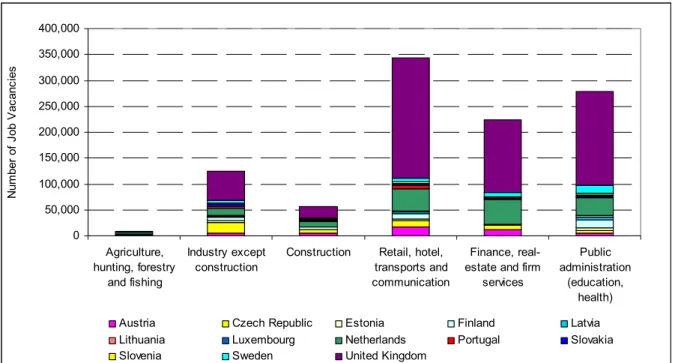
Figure 12 Number of Job Vacancies by Sector in 2005 ...36
Figure 13 Number of Job Vacancies by Sector in 2005 ...38
Figure 15 Unemployment Numbers in Algeria by Sector, 2000-2004...46
Figure 16 Unemployment Numbers in Egypt by Sector, 2000-2004 ...48
Figure 17 Unemployment Numbers in Morocco by Sector, 2000-2004 ...48
Figure 18 Unemployment Numbers in Turkey by Sector, 2000-2004 ...49
Figure 19 Approximate Value of Offshore Services in Countries that Supply Them...50
Figure 20a Wages in the Manufacturing Sector for a List of Selected Countries ...51
Figure 20b Wages in the “Real Estate, Renting and Business Activities” Sector for a List Of Selected Countries ...52
Figure 20c Wages in the “Financial Intermediation” Sector for a List of Selected Countries...52
BOX Box 1 Nurse Shortages in OECD Countries...37
INTRODUCTION AND SUMMARY
Migration from the Least Developed Countries (LDCs) to member countries of the Organisation of Economic Co-operation and Development (OECD) has been and continues to be one of the most controversial subjects of concern over the past few years because of the increasing perceptions among governments and political observers in the latter countries that (i) migration from LDCs to more developed countries has to be regulated on a selective basis; and (ii) the aging population process in developed countries entails demographic transitions and potential economic upheavals in their labor markets. Hence, it is expected not only that more jobs will become available in the near future, but also that medium- and high-skilled workers will be sorely lacking.
The rising deficit of medium- and high-skilled workers is often presented as a European challenge of increasing importance. As Constant and Zimmermann note,
“This is a matter of size and intensity. Even in the long-term, it will be difficult for European firms to hire the appropriate quantities on their local labor markets. Supply is not likely to keep pace with demand. A permanent effort will be needed to participate in the rising world market for flexible high-skilled workers. This international effort is a prerequisite for keeping the own talents and the hired migrants of the European Union member countries. Appropriate policy instruments have to be found to enable companies to deal with this challenge.1” Little is known about the specific economic, demographic, and labor market determinants of migration from certain regions of the developing world. In this report, we shed light on the trends, determinants, and prospects of migration from the Middle East and North Africa (MENA) Region to OECD countries.2 We exclude intraregional migration from the analysis even though it has important economic and demographic impact on both host and origin economies.
The report is in three parts.
Part I provides a picture of the levels and trends of migration from the MENA Region to OECD
countries. The overall discussion is based on two complementary databases made available only recently on the stocks of international migrants in OECD countries: that of Docquier and Marfouk (2005) and that of Dumont and Lemaître (2005). Based on the 2000 round of censuses held in each OECD country, these two databases provide a detailed, comparable, and reliable picture of immigrant populations within OECD countries.
Based on statistical analyses using these data sets, our findings are as follows. First, migrants from the MENA Region represent a small share of the migrant population in most OECD countries. Second, their skill composition strongly varies between receiving countries because of
1 Constant and Zimmermann 2005, p. 1.
2 According to the World Bank’s country classification, the MENA Region includes 19 countries: Algeria, Bahrain,
Djibouti, the Arab Republic of Egypt, the Islamic Republic of Iran, Iraq, Jordan, Kuwait, Lebanon, Libya, Morocco, Occupied Palestinian Territories, Oman, Qatar, Saudi Arabia, Syrian Arab Republic, Tunisia, the United Arab Emirates (UAE), and the Republic of Yemen. All MENA countries except Bahrain, Kuwait, Qatar, Saudi Arabia, and the UAE are low- or middle-income countries.
differing migration and labor market policies. Migrants from the MENA Region are much more educated on average in Anglo-Saxon destination countries than in the traditional destination countries of Continental Europe. Given the skill composition of the migrants, “brain drain” appears to be nonnegligible in Algeria, the Islamic Republic of Iran, Lebanon, Morocco, and Tunisia although estimates strongly vary. Furthermore, for all MENA countries, the overall level of education of the migrants increased between 1990 and 2000. Third, destination also strongly varies with origin. Emigration from the Maghreb countries is strongly concentrated toward Continental Europe, while that from the other MENA countries is focused on the group of Anglo-Saxon countries.
Part II provides econometric analyses of the determinants of migration from MENA to the
OECD countries. In particular, the influence of economic, demographic, and political factors on the size and composition of migration flows from MENA to OECD countries over the period 1990–2002 is investigated.
We first provide a brief survey of the economic literature on international migration and discuss the role of potential key determinants of migration (“push” and “pull” factors3), such as economic and demographic pressures, network effects, or the so-called welfare magnet effect. Two complementary econometric analyses are then carried out. First, a cross-sectional data analysis builds on Docquier and Marfouk’s database on international migration, which provides data on the stocks of MENA immigrants in all OECD countries by education attainment in 1990 and 2000. Second, a panel data approach makes use of annual migration flows made available online by the Migration Policy Institute (MPI). The two alternative data sets are then combined with economic and noneconomic data on both the origin and the destination countries to estimate gravity models. In its most basic form, the gravity model explains migration flows (or stocks) from one country to another by each country’s economic characteristics and bilateral geographic characteristics. In our approach, we examine the impact of other determinants of migratory flows or stocks, such as demand factors in the host country, and their potential pull effects. We focus on the following questions: How much do the “pure” economic factors like differences in income and unemployment levels, returns to education, or labor productivity growth explain migration behavior? How much is explained by other factors such as immigration policies, social networks, cultural and linguistic distance, threat to own freedom such as the level of political rights, and civil liberties in home country?
The emerging findings emphasize the relevance of pull factors to explain the magnitude of expatriation rates from developing to OECD countries despite restrictive immigration policies in most destination countries. Next to economic factors (income levels, returns to education, labor productivity growth), demographic determinants in particular appear to be strong predictors of migration flows. These findings are consistent with the premise that migration is partly demand-driven and used by some countries to compensate for population aging. The results support the idea that different forces are at work concerning the migration of high-educated and low-educated individuals. Push and pull factors have a notably different impact according to the type 3 A push factor is a feature or event that encourages a person to leave his or her country (high unemployment,
poverty, famine, drought, natural disasters, political oppression or persecution, and so on). A pull factor is a feature or event that attracts a person to move to another country.
of migration considered. This should be taken into account by governments that wish to implement selective immigration policies.
Part III of the report examines whether migration from MENA countries can be a solution to
labor shortages in OECD countries.
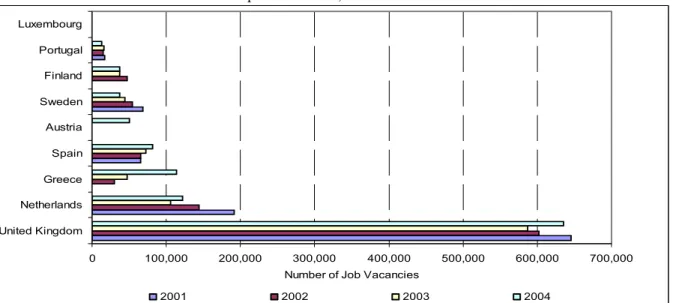
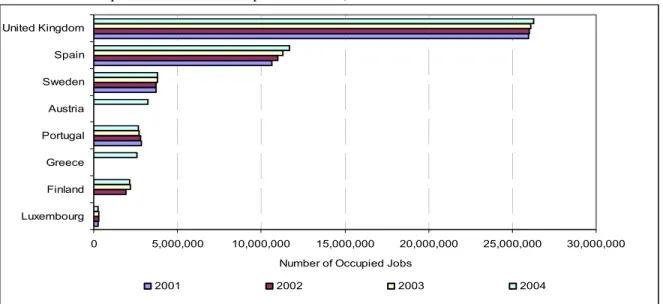
We first present a general overview of job vacancies in some European countries. We then focus on one OECD country, France, and present a more detailed picture of the recruitment difficulties and skill shortages faced by this country. Despite methodological problems, all the available data confirm that labor markets are tight in several OECD countries. Labor shortages are experienced in all sectors, particularly in the Wholesale and Retail Trade, Hotels and Restaurants, and Transport and Communication subsectors. The number of job vacancies is also high in the Public Administration Education and Health sector, partly due to the nurse shortages that affect most OECD countries. In some European countries, namely France and Germany, substantial unsatisfied labor requirements are observed despite persistently high rates of unemployment. In these countries, labor shortages could be attenuated through domestic reforms aimed at mobilizing the unused local labor supply. However, such reforms are unlikely to have an immediate impact on the population’s education, occupation, or location choices. Under these conditions, turning to labor migration programs could be a more rapid and effective means of addressing shortages.
We then investigate whether the MENA Region can fill labor gaps in OECD countries. Compared with Eastern European and former Socialist countries, MENA economies have the demographic potential for large-scale emigration to OECD countries. From a strict quantitative standpoint, the diverging demographic trends and structural differences between most European countries and MENA economies thus add credence to the idea that potential synergies need to be developed between the two regions. In particular, increased labor mobility from the MENA Region could compensate for demographic trends in European labor markets in the next two decades, while constituting a response to the lack of employment in the home countries. Evidence from the estimated gravity models (see part II) does suggest that migration flows from one country to another are strongly driven by demographic features.
The central question of interest is not so much whether the MENA region can provide high numbers of working-age individuals but, rather, what kind of migrants the region can provide. We thus scrutinize whether there would be a match between Europe’s skill requirements and MENA’s skill supply by first looking at the current labor market situation of migrants originating from the MENA Region in OECD countries. Then, in a more prospective approach, we examine available data on unemployment rates by sector within MENA countries. High unemployment numbers in some sectors are likely to be due to skill mismatch or to lack of available jobs in these sectors. If the latter is true, migration might be an appropriate means for job seekers to find a suitable job in the same sector abroad.
As noted, the analysis confirms that increased labor mobility from the MENA Region could compensate for labor shortages in European labor markets in the coming decades, while responding to the lack of employment in some home countries. This finding needs to be taken with caution, however, because of the lack of more disaggregated data on both labor shortages in OECD countries and labor surpluses in MENA countries as well as on skill requirements.
Finally, we explore the question of whether offshoring could gain ground in the MENA Region. By comparing wages in some MENA countries with those prevailing in countries where offshoring has been gaining ground for the last 10 years, we find that some MENA countries offer significant cost advantages. However, offshoring business process or services is not simply cost driven. In some other regards, MENA countries are disadvantaged compared with other countries. So far, the region has not taken advantage of the opportunities for the outsourcing of business service jobs, offered mainly by U.S. or British firms. However, given the conditions prevailing in some of the French-speaking MENA countries (namely, Morocco and Tunisia), these countries could appear in the future offshoring plans of French and other continental countries.
I. OVERVIEW OF REGIONAL MIGRATION TRENDS
This section provides a picture of the levels and trends of migration from the MENA Region to OECD countries. All MENA countries except Bahrain, Kuwait, Qatar, Saudi Arabia, and the UAE are low- or middle- income countries.
The overall discussion is based on two databases made available only recently on the stocks of international migrants in OECD countries: that of Docquier and Marfouk (2005) and that of Dumont and Lemaître (2005). Based on the 2000 round of censuses held in each OECD country, these two databases provide a detailed, comparable, and reliable picture of immigrant populations within OECD countries.4 The two databases differ in the way they define a migrant. Docquier and Marfouk (2005) count as migrants all working-age (25 and over) foreign-born individuals living in an OECD country, where foreign born is defined as an individual born abroad with foreign citizenship at birth. By contrast, Dumont and Lemaître (2005) count as migrants foreign-born individuals age 15 and over living in an OECD country. Given this definition, people born, say, with French nationality outside of France (in Algeria, for example) are counted as foreign born. Another difference between the two databases lies in the reference year: while Docquier and Marfouk’s database covers both 1990 and 2000, Dumont and Lemaître’s database delivers information on migrant stocks in 2000 only. In what follows, we use one database or the other alternatively, depending on the question at hand.
Migration from MENA to OECD Countries: A Host Countries’ Perspective
Stocks
The two complementary databases of Docquier and Marfouk and Dumont and Lemaître provide a rich picture of emigration from the MENA Region, the salient features of which are as follows. First, the share of migrants from MENA countries in the total stock of migrants is rather low in most OECD countries (see annex A, table A1). This stock is higher than 10 percent in only eight OECD countries, all of them being located in the European Economic Area (Belgium, Denmark, France, Italy, Netherlands, Spain, Sweden, and Norway). In North America, the share of migrants from MENA countries is still lower: 5.3 percent in Canada, and 2.6 percent in the 4 The picture provided, however, focuses on recorded migrants only.
United States. At a more aggregated level, the same pattern emerges. In figure I.1, OECD countries are classified into one of five groups according to their welfare state regime and their migration policy general orientation. Following Esping-Andersen (1990), the group of Continental European countries consists of Austria, Belgium, France, Luxemburg, the Netherlands, and Switzerland; the group of Northern European countries consists of Denmark, Finland, Norway, and Sweden; the group of southern European countries includes Spain, Portugal, Italy, and Greece; and the group of Anglo-Saxon countries consists of Australia, Canada, Ireland, New Zealand, the United Kingdom, and the United States, plus Japan. The Other category includes Republic of Korea, Mexico, and Turkey. Former socialist countries (Hungary, Poland, the Czech Republic, and the Slovak Republic) and Germany are excluded here because of the unavailability of data on the country of origin of a large share of their migrants. As shown by figure I.1, the MENA region ranks second in Continental European countries behind the group of high-income countries, but only third and fourth in Northern and Southern European countries, respectively. In the two other groups of OECD countries, migrants from the MENA region account for a marginal share of the migrant population.
Figure I.1
Distribution of Migrants by Region of Origin and Subgroup of OECD Countries, 2000
0.0% 5.0% 10.0% 15.0% 20.0% 25.0% 30.0% 35.0% 40.0% 45.0%
Continental Europe Northern Europe Southern Europe Anglo-Saxon countries
Other High income countries Europe and Central Asia Latin America and the Caribbean
Asia MENA Sub-Saharan Africa
Unknow n
Source: See annex A, table A1.
Note: The High-Income Countries category includes both OECD and non-OECD countries according to the
World Bank’s classification.
However, one needs to be cautious with regard to migration statistics. Quoting CARIM’s (the Euro-Mediterranean Consortium for Applied Research on International Migration)
Mediterranean Migration 2005 Report,
“With no exception in the case of Med-MENA countries, migrants counted by country of origin are in excess compared with those counted by host countries. In the European Union, there is an aggregated difference of 2.5 million migrants for five Med-MENA countries of origin for which calculation is possible (Algeria, Egypt, Morocco, Tunisia
and Turkey).5 This figure reflects a variety of situations, including dual citizens, former migrants who have now left the country, and irregular migrants.”6
See annex A, tables A2 and A3 for detailed figures on Algeria and Egypt.
Second, destination strongly varies with origin (see figure I.2). In Continental and Southern Europe, respectively, 90 percent and 77 percent of migrants from the MENA Region come from a Maghreb country, while this share is less than 10 percent in Northern Europe and in the group of Anglo-Saxon countries. The sudden rapid growth of North African immigration to Southern European countries such as Italy and Spain is the result of a number of factors among which the interruption of immigration in the countries that traditionally received North Africans.7 Quoting Giubilaro,
“Initially, the absence of legal requirements defining conditions of entry and residence in the Southern European countries, together with the manpower requirements of certain sectors, facilitated this movement, which could subsequently be kept going by means of migration networks. However, under pressure from their European partners, Italy and Spain have adopted a legal system in respect of immigration, which is comparable to that of the rest of Europe. With this new situation, the flows would appear to be stabilizing.”
In the group of Anglo-Saxon countries, as in the group of former socialist countries, more than 40 percent of migrants from the MENA region come from the Mashreq. In Northern Europe and in the Republic Korea, Mexico, and Turkey, nearly two-thirds of the migrants from the MENA Region are either Iraqis or Iranians. (A more detailed picture of the distribution of migrants from the MENA Region by country of origin is provided in annex A, tables A4, A5, and A6 for some selected OECD countries.)
Figure I.2
Distribution of Migrants from the MENA Region by Subregion of Origin and Subgroup of OECD Countries, 2000
0% 20% 40% 60% 80% 100%
Continental Europe Northern Europe Southern Europe Anglo-Saxon
countries
Eastern Europe Other
GCC States Maghreb Mashreq Other MENA
Sources: Dumont and Lemaître 2005, authors’ calculations.
5 In all CARIM’s publications, Turkey is included in MENA, unlike in the standard classifications followed in
World Bank publications.
6 CARIM 2005, p.8
Third, the share of highly educated migrants from MENA countries in the total stock of highly educated migrants is rather low in most OECD countries (see figure I.3 and annex A, table A7, column 4). Migrants from MENA countries appear to be less educated on average than other migrants in seven out of the eight aforementioned countries in which they represent more than 10 percent of the total stock of migrants (Belgium, Denmark, France, Italy, the Netherlands, Spain, Sweden, and Norway). In these countries, indeed, the share of highly educated migrants from MENA countries in the total stock of highly educated migrants is lower than the share of migrants from MENA countries in the total stock of migrants. In Belgium, for example, individuals born in MENA countries represent 14.6 percent of the foreign born, but among them, the highly educated represent only 10.1 percent of the highly educated foreign born.
Fourth, among migrants from MENA countries, the share of the highly educated strongly varies by country of destination and reflects differences in migration policy regimes (see figure I.3 and annex A, table A7, column 3). It is rather low in most countries of the European Economic Area except for the former Socialist countries (Hungary, Poland, the Slovak Republic, and the Czech Republic) and the Anglo-Saxon countries (Ireland and the United Kingdom). It is rather high in North America (Canada and the United States). Thus, countries where migrants from the MENA Region account for a marginal share of the migrant population are also those where migrants from the MENA region are the most educated.
Figure I.3
Share of Highly Educated Migrants from MENA Countries in OECD Countries, 2000
0.0% 10.0% 20.0% 30.0% 40.0% 50.0% 60.0% Continental Europe
Northern Europe Southern Europe Anglo-Saxon countries
Eastern Europe Other % of highly qualified migrants in the total stock of migrants from MENA countries
% of highly qualified migrants from MENA countries in the total stock of highly qualified migrants Source: See annex A, table A7.
Note: See figure I.1.
Flows
Even though data on migratory flows are scant, the available evidence suggests that the share of migrants from MENA countries in the migratory flows to OECD countries has been rather low and rather stable for the last 10 years, except for a few European countries—that is, Sweden, the Netherlands, and Norway (see figure I.4 and annex A, table A8).
Figure I.4
Share of Migrants from MENA Countries in the Migratory Flows to Selected Countries Panel A. To Selected Continental European Countries, 1995–2002
0.0% 5.0% 10.0% 15.0% 20.0% 25.0% 1995 1996 1997 1998 1999 2000 2001 2002
Austria Germany Netherlands
Source: See annex A, table A8.
Note: Countries were selected on the basis of data availability.
Panel B. To Selected Northern European Countries, 1995–2002
0.0% 5.0% 10.0% 15.0% 20.0% 25.0% 1995 1996 1997 1998 1999 2000 2001 2002
Denmark Finland Norw ay Sw eden
Source: See annex A, table A8.
Note: Countries were selected on the basis of data availability.
Panel C. To Selected Anglo-Saxon Countries, 1995–2002
0.0% 5.0% 10.0% 15.0% 20.0% 25.0% 1995 1996 1997 1998 1999 2000 2001 2002
Australia United Kingdom United States Source: See annex A, table A8.
Migration from MENA to OECD Countries: A Sending Countries’ Perspective
General Stylized Facts
Adopting the sending countries’ perspective, the four following features emerge from the data. First, as shown by figure 1.5, expatriation rates from MENA to OECD countries are generally rather low, either because emigration flows are directed to non-OECD countries (Egypt is one such example, with migration flows mostly directed to Arab oil countries) or because emigration flows are rather low on the whole (this is particularly the case of labor-importing countries such as Libya, Oman, Saudi Arabia, the UAE, and Republic of Yemen).8 Exceptions include the Maghreb countries that have strong historical links to Europe and Lebanon.
Figure I.5
Expatriation Rates to OECD Countries of Population Age 25 and Over, by MENA Country
0.0% 2.0% 4.0% 6.0% 8.0% 10.0% 12.0% 14.0% 16.0% Yemen Djibouti Libya Iran Iraq Occupied Palestinian Territory Oman Saudi Arabia United Arab Emirates Qatar Bahrain Kuw ait Egypt Syria Jordan Lebanon Algeria Tunisia Morocco O ther ME N A count ries G C C S tat es M as hr eq M agh reb
Source: Docquier and Marfouk 2005.
Note: GCC = Gulf Cooperation Council; MENA = Middle East and North Africa.
Second, emigration from the Maghreb to OECD countries is strongly concentrated toward Continental Europe, while emigration from the other MENA countries is focused on Anglo-Saxon countries (see figure I.6). This second stylized fact suggests that past colonial links and common language are strong pull factors, as further developed in part III.
8 Expatriation rate from country of origin i to OECD countries is calculated by dividing the expatriate population
Figure I.6
Distribution of Migrants from the MENA Region by Subregion of Destination and Subgroup of MENA Countries, 2000 0% 10% 20% 30% 40% 50% 60% 70% 80% 90% 100%
Maghreb Mashreq GCC States Other MENA
Other OECD Eastern Europe Anglo-Saxon countries
Northern Europe Southern Europe Continental Europe
Source: Docquier and Marfouk 2005, authors’ computations.
Note: GCC = Gulf Cooperation Council; MENA = Middle East and North Africa; OECD = Organisation for
Economic Co-operation and Development.
Third, available data on the size of the brain drain by MENA country exhibit stronger disparities. In figure I.7, brain drain is measured by the highly educated expatriation rate, that is, the number of individuals with tertiary education (13 years and above) born in country j and living in an OECD country, divided by the total number of individuals with tertiary education born in country j.9 Three sets of estimates have been reported, based on different data sources. As suggested by the figures, emigration of highly educated workers particularly affects the Islamic Republic of Iran, Lebanon, and the Maghreb countries. In contrast, the brain drain is rather low in the Gulf States. Compared with other developing regions belonging to the middle-income group, based on the World Bank classification, the size of the brain drain is higher in the MENA Region (10.5 percent) than in Latin America (7.5 percent), East Asia and the Pacific (6.1 percent), and Eastern Europe and Central Asia (3.9 percent).10
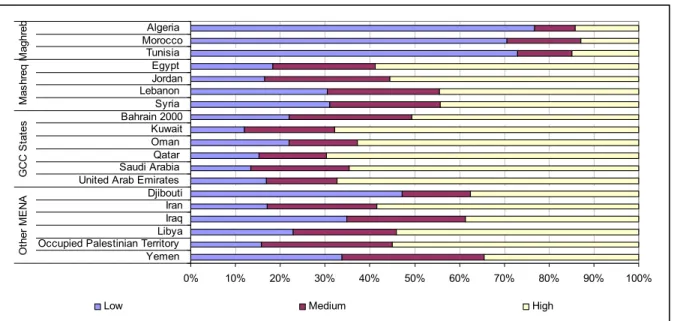
Fourth, for all MENA countries, the share of the highly educated in the total stock of migrants has increased since 1990 (see figure I.8). This evolution is due to both the adoption of selective migration policies biased toward the highly-skilled in receiving countries and to the increasing proportion of educated individuals in the sending ones.
9 In what follows, the diagnosis on the size of the brain drain by country of origin is biased, because several major
destinations such as the Persian Gulf countries are ignored. In particular, given the importance of migration flows from Mashreq to Gulf countries, the size of the brain drain in these countries of origin is likely to be much higher.
10 Because of the significant size of their brain drain, very small countries and islands were removed from the
Figure I.7
Highly Educated Expatriation Rate by MENA Country, 2000
0.0% 5.0% 10.0% 15.0% 20.0% 25.0% 30.0% 35.0% 40.0% 45.0%
Djibouti Iran Iraq Libya Occupied Palestinian Territory Yemen Oman Saudi Arabia Egypt Jordan Lebanon Syria Algeria Morocco Tunisia O ther ME N A GC C S tat es Mas hr eq M aghr eb
Estimate 1 Estimate 2 Estimate 3
Sources: Dumont and Lemaître 2005; Docquier and Marfouk 2005.
Note: GCC = Gulf Cooperation Council; MENA = Middle East and North Africa.
Estimate 1 is the highly educated expatriation rate according to the Cohen and Soto database (population 15+), while estimate 2 is the highly educated expatriation rate according to the Barro and Lee database (population 15+). Both estimates come from Dumont and Lemaître (2005). Estimate 3 comes from Docquier and Marfouk (2005) (population 25+).
Figure I.8
Composition of Migrant Stocks by Level of Education and Sending Country Panel A. 1990
0% 10% 20% 30% 40% 50% 60% 70% 80% 90% 100% Yemen
Occupied Palestinian Territory Libya Iraq Iran Djibouti United Arab Emirates Saudi Arabia Qatar Oman Kuwait Bahrain Syria Lebanon Jordan Egypt Tunisia MoroccoAlgeria O th er M E N A G C C S tat es M as hr eq M agh reb
Low Medium High
Sources: Docquier and Marfouk 2005, authors’ calculations.
Panel B. 2000
0% 10% 20% 30% 40% 50% 60% 70% 80% 90% 100% Yemen
Occupied Palestinian Territory Libya Iraq Iran Djibouti United Arab Emirates Saudi Arabia Qatar Oman Kuwait Bahrain 2000 Syria Lebanon Jordan Egypt Tunisia Morocco Algeria O the r M E N A G C C S tat es M as hr eq M aghr eb
Low Medium High
Sources: Docquier and Marfouk 2005, authors’ calculations.
Note: GCC = Gulf Cooperation Council; MENA = Middle East and North Africa. Country Facts
Maghreb (see annex A, tables A9–A14) Algeria
Emigration from Algeria is concentrated toward France: 84.2 percent of Algerians residing in an OECD country live in France,11 despite a diversification of migration flows from Algeria in the last 30 years (see table I.1).
Table I.1. Emigration from Algeria since the Nineteenth Century
Period Main Destination Countries
From 1830 Middle East
Beginning of the twentieth
century France, Arab countries
1945–1962 France, Morocco, Tunisia
1962–1973 France
1974–1991 France, East Germany, Western Europe, North America
1992– France, Western Europe, North America, Gulf States, Australia, and East Asia
Source: Table extracted from CARIM’s Mediterranean Migration 2005 Report.
In terms of qualifications, the composition of Algerian migrant stocks is highly varied between Europe and North America: respectively, 84.1 percent and 72.8 percent of Algerian migrants are highly educated in Canada and the United States, but only 10 percent in Europe’s main destination countries (Belgium, France, and Spain). Two factors explain this diversity. First, the
earlier the migrating cohort, the less educated it tends to be. Second, migration and labor-market policies are generally biased toward the highly educated in North America.
However, compared with other MENA countries (Egypt, Jordan, Libya, and so on), the expatriation rate of the highly educated is rather high, with estimates varying from 9.4 percent to 18.0 percent (see figure I.7). Because migrant stocks are particularly large in France, even though the share of highly educated Algerian migrants is low, France has drained many highly educated Algerians: on average, one can estimate that about five to six highly educated Algerians out of 100 migrantsreside in France.
Morocco
Moroccan nationals are predominantly found in France (38.8 percent according to Docquier and Marfouk (DM) figures and 45.8 percent from Dumont and Lemaître’s (DL), followed by Spain (DM: 19.8 percent; DL: 18.2 percent), the Netherlands (DM: 13.5 percent), and Italy (DM: 9.9 percent). Compared with the Tunisians and Algerians, the Moroccans are widely distributed over all European countries. This characteristic, already manifest in the seventies, has been further accentuated in recent years.
In France, Moroccans are largely low-educated individuals with only primary education (79 percent DM), whereas this share is 66 percent in Spain where individuals with secondary level education represent 28.6 percent of the total stock of Moroccan migrants (compared with 7.8 percent and 16 percent for France and the Netherlands, respectively). However, the same contrast as for Algeria emerges between Europe and North America: Moroccan migrants are highly educated in Canada (72.2 percent) and the United States (64.2 percent).
The expatriation rate of the highly educated is rather high with regard to other MENA countries (on average 9.9 percent, according to DM), with estimates varying from 17 percent to 19.5 percent.
Tunisia
Emigration from Tunisia is mainly directed to France (DM: 69.9 percent; DL: 78 percent) followed by Italy (DM: 12.2 percent; DL: 9 percent) and Germany (DM: 4.9 percent).
In terms of qualification, the stock of Tunisian nationals residing in the traditional European host countries is predominantly made of individuals with only primary education (DM: 80 percent in France; 78.1 percent in Italy).
The highly educated population’s expatriation rate ranges from 12.5 percent to 21.4 percent, which is also quite high, compared with other MENA countries.
Mashreq (see annex A, tables A15–A22) Egypt
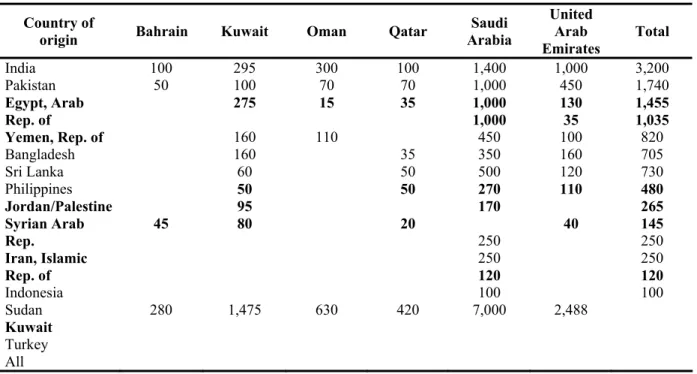
Emigration from Egypt is mainly directed to the Gulf area (see table I.2). Meanwhile, since the early 1960s, some Egyptians have migrated permanently to the Australia, Canada, the United States, and Western European countries (France, Italy, and the United Kingdom). The preferred destination is the United States, where about two out of five permanent Egyptian migrants are found, followed by Australia and Canada, where about one-fourth of permanent Egyptian migrants live.
Table I.2. Major Foreign Communities in the GCC States, 2002 (in thousands) Country of
origin Bahrain Kuwait Oman Qatar Arabia Saudi
United Arab Emirates Total India Pakistan Egypt, Arab Rep. of Yemen, Rep. of Bangladesh Sri Lanka Philippines Jordan/Palestine Syrian Arab Rep. Iran, Islamic Rep. of Indonesia Sudan Kuwait Turkey All 100 50 45 280 295 100 275 160 160 60 50 95 80 1,475 300 70 15 110 630 100 70 35 35 50 50 20 420 1,400 1,000 1,000 1,000 450 350 500 270 170 250 250 120 100 7,000 1,000 450 130 35 100 160 120 110 40 2,488 3,200 1,740 1,455 1,035 820 705 730 480 265 145 250 250 120 100 Source: Kapiszewski 2004, p. 125. Note: GCC = Gulf Cooperation Council.
In terms of qualifications, most Egyptians migrants residing in North America are highly educated. The pattern is different in the main European destination countries (France, Italy, and the United Kingdom); nearly a third of Egyptian migrants there have only primary education. Brain drain is less than 5 percent. However, it is likely that the estimated size of the brain drain for Egypt would be much higher if the number of highly skilled Egyptian expatriates living in Persian Gulf countries were included in the calculation.
Jordan
Among OECD countries, Jordan migrants are predominantly found in the United States (66.4 percent), followed by Germany (9.5 percent), Canada (5.5 percent), and Australia (4.1 percent). In terms of qualifications, most Jordan migrants to North America and Australia have completed tertiary education. This pattern is different in Germany and the United Kingdom, where more than one-third of Jordanian migrants have only primary education.
On the whole, brain drain is rather limited, with estimates varying between 3.3 percent and 7.2 percent. As with Egypt, however, the size of the brain drain would be much higher, were skilled labor exports to Gulf Cooperation Council (GCC) states accounted for.
Lebanon
Among OECD countries, Lebanese migrants are predominantly found in North America (Canada and the United States) and Australia, followed by some Western European countries (France, Germany, and Sweden). The preferred destination is the United States, where about one-third of Lebanese migrants live.
In terms of qualifications, the share of low-educated Lebanese migrants is rather low in the United States (11.4 percent), but rather high elsewhere (between 30 and 42 percent).
Brain drain is very high. It is estimated that about 4 out of 10 highly educated Lebanese reside in an OECD country.
Syria
Syrian nationals are mostly found in the United States (DM: 40.7 percent), then in Germany (11.4 percent), Canada (10.9 percent), Sweden (9.3 percent), and France (8 percent). In 2000, Syrian nationals in these countries had remarkably similar characteristics.
Differences appear in terms of qualification structures across the five dominant countries of Syrian emigration: the share of poorly educated migrants is significantly lower in the United States (16.8 percent) than in Germany (35.7 percent), Canada (29.5 percent), Sweden (40 percent), or France (32.4 percent). Hence, the share of highly educated Syrian migrants is higher in the United States (52 percent) but also in Canada (57 percent).
Brain drain indicators show that Syrian highly educated emigration is rather low, ranging from only 4.4 percent to 6.1 percent.
GCC States
Labor-importing GCC States do not send many migrants to OECD countries. Rather, they have been the main recipients of migrants from Egypt, the Islamic Republic of Iran, Jordan, Syria, and the Republic of Yemen moving to the Gulf primarily to take up employment. An overview of migrant stocks from these countries in OECD countries, computed from Docquier and Marfouk’s database, is provided in annex A, table A23.
Other MENA Countries (see annex A, tables A24–A33) Djibouti
Few migrants from Djibouti reside in OECD countries (DM: 1 638 individuals in 2000).
Emigration from the Islamic Republic of Iran to OECD countries is mainly directed to North America and some Western European countries (marginally France, the Netherlands, Sweden, and the United Kingdom). The preferred destination is the United States, where about one out of two permanent Iranian migrants live, followed by Germany and Canada, where about one-fifth of permanent Iranian migrants are found.
In terms of qualifications, three out of four Iranian migrants residing in North America are highly educated. The pattern is different in Western Europe.
Brain drain is rather high, with estimates varying from 8 percent to 18 percent.
Iraq
Emigration from Iraq to OECD countries is directed to the United States and some Western European countries (Germany, Sweden, the Netherlands, and the United Kingdom).
In terms of qualifications, no clear pattern emerges. The share of highly educated Iraqi migrants is slightly higher in Australia, Canada, and the United States than in other destination countries. Brain drain is rather high (6 percent to 11 percent).
Libya
Libyan migrants are found almost equally in the United States (DM: 33.2 percent) and in the United Kingdom (DM: 32.4 percent). Their shares drop to 7 percent, 6 percent, and 5.9 percent in Germany, Australia, and Canada, respectively.
In the United States, the proportion of educated Libyan migrants is overwhelming (80.5 percent) as compared with that of the United Kingdom (42.7 percent) or Germany (27.5 percent). Consequently, the share of poorly educated Libyan migrants is low in the United States (2.1 percent) compared with the other seven main countries of emigration (on average 32 percent for Australia, Canada, France, Germany, Greece, and Switzerland);
Brain drain is low at only 2.4 percent. However, this is consistent with the rather low expatriation rate of the Libyan population age 15 and over (1.8 percent, with an average of 2.8 percent for MENA countries).
Occupied Palestinian Territory
Within OECD, nearly 8 emigrants from the Palestinian territory out of 10 are found in North America, mainly in the United States.
In terms of education, Palestinian migrants in North America are more educated on average than those in Europe.
As with Egypt, emigration from the Republic of Yemen is mainly directed to the Gulf area (see table I.2). Yemenite nationals residing in OECD countries (20,949 in 2000) are predominantly found in the United States (DM: 55.4 percent) and then in the United Kingdom (28.3 percent). The remaining migrants are divided among Germany (4.3 percent), Canada (3.3 percent), France (2.8 percent), and Australia (1.4 percent).
The structure of qualification of the Yemenite migrants is almost similar across the United States and the United Kingdom. Additionally, the shares of highly and poorly educated individuals is almost equal in these two main host countries (30 percent, against 31 percent in the United States, and 35 percent, against 38 percent in the United Kingdom).
Brain drain is 6 percent (according to DM).
II. GRAVITY MODEL ANALYSES OF MIGRATION TRENDS FROM MENA TO OECD COUNTRIES
This section empirically investigates the influence of economic, demographic, and political factors on the size and composition of migration flows from MENA to OECD countries in recent years. The focus is on both the supply and demand determinants of immigration patterns. The following questions are addressed: What are the main driving factors of migration from MENA to OECD countries? Are these drivers mainly economic or demographic? Given destination countries’ restrictive immigration policies, do flows respond to economic incentives? Is there a “welfare magnet effect”?
The section is structured as follows. The first part briefly surveys the economic literature on international migration and discusses the role of potential key determinants of migration. The second part describes the data sets. The third part analyzes, using gravity models, the determinants of bilateral migration flows from MENA to OECD countries. We first run cross-sectional regressions using as dependent variables expatriation rates by education group in 2000, computed from Docquier and Marfouk’s database. We then run panel data regressions using yearly data on immigrant flows to 14 OECD countries by country of origin between 1990 and 2002.
A Review of Migration Theories and Determinants12
In what follows, we look at the central elements of the theoretical issues in relation to international migration from LDC to industrial countries, as well as some special aspects that we wish to consider in our econometric analysis.
Traditional Explanations
In the neoclassical approach at a macro level, migration is a consequence of differentiated economic opportunities across regions or countries, especially earnings differentials.13 Migration 12 This section is mainly based on Rotte and Vogler’s (1998) and Constant and Zimmermann’s (2005) literature
is viewed as the optimal allocation of labor into regions of highest productivity, leading to an equalization of wages if there are no migration costs.
In the human capital approach to migration, Sjaastad (1962) gives up the assumption of homogeneous labor. Depending on their skill levels, individuals calculate the present discounted value of expected returns on their human capital in every region or country. Migration occurs if the returns, net of discounted migration costs, are larger in a region or country than those in the country of origin. Every individual evaluates the returns and costs in a different way so that migration may be worthwhile for some individuals in a country and not for others. As a result, in the analysis of migration patterns, one should not only pay attention to aggregate labor market variables (such as wage and unemployment difference), but also consider the importance of the heterogeneity of individuals.
Nearly all empirical studies using aggregated data find a statistically significant positive effect of income or wages in the destination country, or of the income and wage differential between the sending and the receiving countries, and a negative effect of income and wages in the sending country. Evidence on the influence of unemployment rates both in the sending and in the receiving countries is more varied. Some studies conform to the predictions of the Harris-Todaro model and find a positive influence of the probability of employment in the destination country on the migration decision.14 Other studies find that individuals are attracted to regions with shortage of jobs.
In our empirical investigation, difference in economic opportunities between origin and host countries, especially income and unemployment rates, are captured by the levels of gross domestic product (GDP) per capita in both the host and origin countries, as well as unemployment rates in the destination country.
Labor Market Disequilibrium
The labor market disequilibrium issue has to deal with the question of whether and how the native population is affected by immigrants.15 The evaluation crucially depends on the conditions in the labor markets of the host countries. These markets may be either competitive or in disequilibrium—that is, labor supply equals labor demand or not, respectively. A further decisive aspect is that the labor force in the host country is likely to be heterogeneous and of diverse quality. Then, the immigration impact depends on whether immigrants are uneducated or educated. This is the reason why it is important to understand the determinants of emigration rates of different groups of individuals, namely, the educated and uneducated workers. Disequilibrium situations in labor markets may occur when there are institutional constraints in the market for unskilled labor, such as union wages, minimum wages, or transfers like social assistance, or when the education system is not able to provide the necessary supply of workers for the skilled labor markets. Another issue is whether educated and uneducated workers are complements or substitutes to the local population. A reasonable (and standard) assumption is
13 Hicks 1932.
14 Harris and Todaro 1970.
that high-educated and low-educated workers are complements, which implies that one group becomes more productive (and relatively scarce) when the input of the other group is increased.
Self-Selection of Migrants
Emigrants are not a random sample of a country’s population. This aspect has already played an important role in the brain-drain debate concerning emigration of the highly educated and its negative consequences for sending country’s economy. The question of self-selection of migrants gained renewed attention with analyses of the performance of migrants in the host labor market.16 A popular model in the migration literature to analyze the self-selection of migrants is the Roy model.17 The basic idea can be summarized as follows: When looking at who chooses to emigrate to the United States, one ready-made answer is that workers from low-wage countries will immigrate. This may be true on average, but it is probably too simple. The workers immigrating to the United States are probably not a random subset of the sending country’s workforce. Rather, one should expect that potential migrants make some rough comparison of their wages in the home country and their expected wages in the United States. On average, one would expect those who emigrate to have higher expected earnings in the United States than in the home country and vice versa for those who stay.
Hence, the relative wage on observable and unobservable abilities in home and host country determines the kind of selection, while the level of income affects the volume of migration. In our econometric analysis, we shall introduce a proxy for the potential reward for observable and unobservable abilities in the host country, together with GDP per capita levels, to control for both effects. A natural belief is that we may observe differentiated effects of, for instance, the private rate of returns to schooling in the host country on the emigration rates of high-educated and low-educated workers.
Push and Pull Factors of Migration
In public discussion about present or future international migration from developing countries, the term “migration pressure” is often used.18 Some authors define migration pressure as the difference in the numbers of people who are willing to migrate under current circumstances and those individuals the country of destination is prepared to accept. From the perspective of the sending country, Bruni and Venturini (1995) define migration pressure as an excess supply of labor regarding the demand of labor. However, the problem remains that excess labor supply does not necessarily result in emigration. Schaeffer (1993), therefore, defines migration pressure in terms of effective demand.
The general consensus is that several factors in the sending and the destination countries determine whether an existing “migration potential” results in actual migration. For factors concerning the home country, one refers to the so-called “push” factors; for those concerning the host country, one uses the term “pull” factors. Important push factors for developing countries 16 See Borjas (1994) for an overview.
17 A formal representation of this model for the explanation of international migration flows can be found in Borjas
(1987).
include population growth and the corresponding unemployment, poverty, and political instability. Pull factors are mainly high wages in the receiving countries, their social security systems, and political stability, as well as a potential past colonial relationship or common culture between host and origin countries. The generosity of the welfare state, therefore, may play an important role in migrants’ decision of choosing country of destination. This is the so called welfare magnet effect. To control for these push and pull effects as determinants of migratory flows, we will apply bilateral “cultural distance” indicators between the host and origin countries (colonial relationship, common language), as well as variables indicative of potential demographic pressure, such as population density, urban population growth, or the age structure of the populations. We also account for political and civil factors in the sending country, as well as use proxies for the welfare magnet effect in the host country.
Most attention regarding persistent migration is directed to the so-called network effects.19 Existing connections between individuals in a host country and friends and relatives left at home increase the likelihood of the latter following the former to the country of destination. In that case, network effects may counteract cultural distance, if the concerned ethnic group is already present in the destination country. Indeed, migrants’ links to their home country reduce the costs and uncertainty for further potential migrants. Moreover, these contacts in the destination country facilitate accommodation and job search for follow-up migrants, which also increases migration incentives. A few studies show that network variables always have a significant and positive impact on migratory flows.20
From this brief literature review, we now turn to the following questions: How much do the “pure” economic factors, like differences in income and unemployment levels, returns to education, or labor productivity growth, explain migration behavior? How much is explained by other factors such as immigration policies, social networks, cultural and linguistic distance, threat to personal freedom (such as the level of political rights), and civil liberties in home country?
Data Collection
Cross-Sectional Analysis
Our cross-sectional analysis builds on a new comprehensive and consistent database on international migration.21 The data set (hereafter DM05) describes the stocks of immigrants in all OECD countries by education attainment in 1990 and 2000.22 As Docquier and Marfouk argue, “regarding statistics, it has long been recognized that migration flow data are less reliable than stock data, due to the impossibility of evaluating emigration and return migration movements.”23
Migrants are defined as all working-age (25 and over) foreign-born individuals living in an OECD country. Using the category of working-age population maximizes the comparability of the immigration population with data on education attainment in the source countries. The 19 Pedersen, Pytlikova, and Smith 2004.
20 Rotte and Vogler 1999; Pedersen, Pytlikova, and Smith 2004. 21 Docquier and Marfouk 2005.
22 A detailed presentation of the methodology for data collection and the assumptions can be found in Docquier and
Marfouk (2005).
foreign-born concept (defined as an individual born abroad with foreign citizenship at birth) better captures the decision to emigrate, compared with citizenship used alone. Indeed, in some receiving countries, immigrants’ children often keep their foreign citizenship.24 However, in a limited number of cases, immigrants are classified only by citizenship (Germany, Greece, Italy, Japan, and the Republic of Korea).25
Three levels of schooling are distinguished. Low-educated workers are those with primary education (up to eight years of schooling); medium educated workers are those with secondary education (9 to 12 years of schooling); and high-educated workers are those with tertiary education (13 or more years of schooling). This definition of education categories is consistent with Barro and Lee’s data set on education across countries, which is based on the International Standard Classification of Education (ISCED).26
The preceding literature review and discussions on the determinants of migration have shown that what really matters in the migration process are stocks instead of flows. Indeed, there are many reasons to believe that, with international migration, we are dealing with a disequilibrium situation, as there might be significant rationing. In this context, observed flows may be part of an adjustment to a desired stock of migration. Therefore, rather than estimating emigration flows over a 10-year period (by retrenching the stocks of immigrants in 1990 from the stocks of immigrants in 2000), we prefer to specify our model to explain the stocks of migrants at the end of the period and to include lagged values of our considered determinants of migration as right-hand-side variables.
For our purpose, we thus compute expatriation rates by education level s for the year 2000 for each couple of receiving country i and sending country j in the following way:
2000 2000 2000 , s j ij s ij s Population Stock m = (II.1)
After eliminating observations with missing values or outliers, the sample of bilateral expatriation rates for 2000 amounts to 4,650 couples of LDC-OECD countries, of which 570 are MENA-OECD couples. Other sending subregions include Sub-Saharan Africa (1,410 couples), South Asia (240), Latin America and the Caribbean (900), Europe and Central Asia (780), and East Asia and the Pacific (630). The list of sending and receiving countries is reported in annex B, table B1.
Panel Data Approach
Our panel data approach makes use of annual migration flows coming mainly from the MPI Web site, an “independent think-tank dedicated to the study of the movement of people worldwide.”27
24 Docquier and Marfouk 2005.
25 Note that the data exclude a large number of students who temporarily emigrate to complete their education. 26 Barro and Lee 2000. The ISCED classification of education levels into three groups can be made as follows: the
group of “primary school educated” includes the categories ISCED 0, 1, and 2; the group of secondary-school educated includes ISCED 3 and 4; and the group of tertiary educated includes ISCED 5 and 6.
To complete MPI’s database, we also use some of the data contained in the most recent OECD’s annual reports on Trends in International Migration or those made available on the Web sites of destination countries’ National Statistical Institutes.
Our two alternative data sets on bilateral immigration stocks and flows are then combined with economic and noneconomic data on both the origin and destination country of each country couple to estimate gravity models.
All the bilateral geographic data (distance and dummies for land border, colony, island, and common language) are taken from Glick and Rose (2002). This data set has been updated for many missing data on LDCs and OECD countries.
Most data on macroeconomic variables such as GDP per capita (in purchasing power parity, PPP), country population, age-dependency ratios, population density, urban and total population growth, unemployment rates, and literacy rates come from the World Development Indicators and the Penn World Table, release 7.0. Information on origin and destination countries’ share of young population comes from the Population Division of the United Nations. Information on productivity growth comes from OECD’s annual Employment Outlook reports.
Demographic factors include population density (PopDens) in destination and source countries, age-dependency ratio in destination and source countries AgeDepend), the share of the population ages 15 to 24 (1524Share) in destination and source countries, and the urban population growth (UrbPopGrowth) in destination and source countries. The higher the relative population growth in the source country and the larger the proportion of the population in the younger adult age-group, the larger the migration pressure is expected. We also include two variables (Literacy and MeanEduc) reflecting the education level of the source and destination countries.
To complement the database for some countries, we collected unemployment rates from the OECD’s annual Employment Outlook reports for the years 1990–2000. In particular, for the year 1994, we use unemployment rates by education level following Barro and Lee’s classification (that is, regrouping the different ISCED’s schooling levels into the three main categories described above).
Data on schooling participation by country are taken from Barro and Lee’s data set (2000). We also collected the estimated Mincerian private return to education specific to each OECD country from Psacharopoulos and Patrinos (2004). The few missing returns in their study for some European countries were replaced by estimates made available by the PURE Project of the European Commission on the returns to education in European countries.28
Since political pressure in the source country may influence migration, we include two variables (PolRights and CivLib), which measure the level of political rights and civil liberties in source countries. Each country is assigned a rating for political rights and a rating for civil liberties based on a scale of 1 to 7, with 1 representing the highest degree of rights or freedom and 7 the
lowest one. These two variables come from Freedom House’s Freedom in the World country ratings.
Finally, we include a variable (PubExpComp) assumed to capture potential pull factors relating to the “welfare magnet” theories as presented by Borjas (1987, 1999). It is a measure of the level of public social expenditure devoted to unemployment compensation expressed as a percentage of GDP in destination countries. According to the welfare magnet theory, we expect higher migration flows into countries with relatively higher levels of public social expenditure. This variable stems from OECD’s annual Employment Outlook reports.
Descriptive statistics for the data sets are given in annex B, table B2.
The Determinants of Migration: A Gravity Approach
The basic gravity model has been used several times to analyze gross trade flows between countries.29 It assumes that those flows depend on the size of each of the two trading countries (measured as their GDP) and any determinant of bilateral trade cost, such as distance, contiguity, trade agreements, and so on. Only recently, the gravity approach has been used to explain bilateral migratory flows.30 In its most basic form, the gravity equation explains the total emigration from one country of origin to a country of destination by using the economic characteristics (population and GDP per capita) of each of the two countries and the bilateral geographic characteristics (distance, common border, access to sea, common language). Occasionally, if the data allow it, additional characteristics of the countries of origin and destination are included to account for immigrationpolicies and other relevant characteristics. In this respect, our empirical strategy follows the general guidelines described in the previous studies. In addition, we stress the impact of new determinants of migratory flows, such as demand factors in the host country, and their potential pull effects.
Cross-Sectional Data Analysis Empirical models
We run two types of regression using alternative specifications for the dependent variable (total expatriation rate, expatriation rate of the low educated, expatriation rate of the medium educated, and expatriation rate of the high educated).
To analyze carefully the effect of bilateral characteristics (such as distance, having a common border or a common language, and so on) on expatriation rates by level of education, we first run a basic gravity equation in which all characteristics of the countries of origin and destination are controlled for through the inclusion of origin and destination dummies. The basic regression is as follows: ij j i ij ij ij ij ij ij s Island c Colony c Language c Border c c m ,2000 = 1log(distance )+ 2 + 3 + 4 + 5 +α +β +ν (II.2)
29 See, for example, Feenstra, Markusen, and Rose 2001.