HAL Id: tel-01699284
https://pastel.archives-ouvertes.fr/tel-01699284
Submitted on 2 Feb 2018HAL is a multi-disciplinary open access archive for the deposit and dissemination of
sci-L’archive ouverte pluridisciplinaire HAL, est destinée au dépôt et à la diffusion de documents
Linear optimization models for the simultaneous design
of mass and heat networks of an eco-industrial park
Sami Ghazouani
To cite this version:
Sami Ghazouani. Linear optimization models for the simultaneous design of mass and heat networks of an eco-industrial park. Environmental Engineering. Université Paris sciences et lettres, 2016. English. �NNT : 2016PSLEM060�. �tel-01699284�
THÈSE DE DOCTORAT
de l’Université de recherche Paris Sciences et Lettres
PSL Research University
Préparée à MINES ParisTech
Modèles linéaires d’optimisation pour la conception simultanée de
réseaux de matière et de chaleur d’un écoparc industriel
Linear optimization models for the simultaneous design of mass
and heat networks of an eco-industrial park
École doctorale n
o432
SCIENCES ET MÉTIERS DE L’INGÉNIEUR
Spécialité
ÉNERGÉTIQUE ET PROCÉDÉSSoutenue par
Sami GHAZOUANI
le 05 Décembre 2016
Dirigée par
Assaad Zoughaib
COMPOSITION DU JURY :
M Jean-Michel RENEAUME Professeur
Université de Pau, Président M Mahmoud EL HALWAGI Professeur
Texas A&M, Rapporteur M Ludovic MONTASTRUC Maître de conférence ENSIACET, Rapporteur Mme Solène LE BOURDIEC Ingénieure de recherche EDF, Examinatrice M Didier MAYER Professeur
Mines ParisTech, Examinateur M Assaad ZOUGHAIB
Remerciements
Tout d’abord, j’aimerais remercier chaleureusement mon directeur de thèse Pr. Assaad Zoughaib pour ses longues discussions qui ont façonné le contenu de cette thèse et qui m’ont énormément apporté en tant que jeune chercheur. Grâce à sa convivialité (et ses très bonnes blagues), ce travail s’est déroulé dans la bonne humeur. Grâce à son ambition pour ce travail et son écoute attentive, il m’a véritablement poussé à toujours aller plus loin. Je n’aurais pas pu souhaiter de meilleur mentor.
Ensuite je voudrais remercier sincèrement Dr. Solène Le Bourdiec pour son aide, ses conseils et sa disponibilité tout au long de ses trois années de thèse. Par sa pertinence et sa motivation, Solène m’a permis de valoriser grandement ces travaux dans la commu-nauté scientifique et au sein de l’entreprise EDF. J’ai vraiment hâte que l’on continue de travailler ensemble dans les années qui viennent.
Je remercie Pr. Mahmoud El Halwagi et Dr. Ludovic Montastruc pour m’avoir fait l’honneur d’accepter d’être les rapporteurs de ma thèse ainsi que pour l’attention qu’ils ont porté à mon travail et la qualité de leurs remarques. Je remercie tout particulièrement Pr. El Halwagi pour sa grande hospitalité lors de ma venue pendant mois dans son lab-oratoire à l’université Texas A&M aux Etats-Unis. Ce fut l’un des moments forts de ces trois années de travail et une expérience mémorable. Mes remerciements vont egalement à Pr. Jean-Michel Reneaume pour avoir accepter de faire partie et de présider mon jury de thèse. De même, je remercie Pr. Didier Mayer pour avoir pris le temps de participer à mon jury thèse.
Je tiens à exprimer ma grande reconnaissance à Mai Riche pour son appui dans la recherche ce sujet de thèse et pour m’avoir permis de travailler avec elle durant cette période d’incertitude. Je remercie aussi Bernard Maestrali pour sa confiance et son soutien avant, pendant et après ma thèse et pour m’avoir aidé à intégrer l’entreprise EDF. Je remercie Romain Farel et PS2E pour leur grande participation dans le démarrage de cette thèse. Je remercie les collègues de l’équipe E26 d’EDF pour leur coopération (surtout Sandrine et Thuy-An) et la bonne ambiance dans l’équipe. Enfin, je remercie vivement EDF pour m’avoir donner l’opportunité de faire cette thèse et de l’avoir financée.
Je remercie également les membres du CES de Mines ParisTech pour leur accueil chaleureux et leur assistance lors de ces trois années, en particulier Rocio, Joëlle et Stéphanie. Je souhaite remercier vivement les doctorants, post-docs, chercheurs et sta-giaires du laboratoire pour les grandes discussions qui ont pu animer les repas du midi (en particulier Afif et Karim), la convivialité, les échanges et l’entre-aide qui ont rendu le travail quotidien de ces trois années de thèse plus agréable et enrichissant que je n’aurais pu l’imaginer. Je remercie tout particulièrement Alaa, Fabien, Sahar et Toan pour cela.
Je remercie aussi les étudiants et collaborateurs du Pr. El Halwagi (Debalina, Erfika, Marc, Kevin, Chi) pour leur accueil et pour les soirées texanes. Mes remerciements vont au Dr. Esmael Said pour sa contribution à la réalisation de l’étude sur la TMD présentée dans le chapitre IV lors de mon passage aux Etats-Unis.
Enfin, je voudrais remercier chaleureusement ma mère, ma sœur et ma famille portu-gaise pour m’avoir soutenu et motivé tout au long de ma vie. Je remercie la belle famille pour ses encouragements lors de cette dernière année assez compliquée que l’on a vécu et le très bon champagne de ma soutenance. Je tiens à remercier mes amis Noémie, Faustine, Félix et Arnaud d’être venus assister à ma soutenance. Et je remercie profondément ma compagne Laure pour son support quotidien depuis tant d’années sans lequel je n’aurais sûrement pas mené à bien tous ces accomplissements. Petite dédicace à notre petite famille féline.
Contents
List of Figures 5
List of Tables 8
Introduction 11
1 Context and Challenges 15
1.1 General overview . . . 16
1.1.1 Systemic constraints . . . 16
1.1.2 Energy consumption and production . . . 18
1.1.3 Water consumption . . . 22
1.1.4 Current and future regulations - Constraints on industrial actors . . 23
1.2 Circular Economy and Industrial Ecology . . . 24
1.2.1 Wastes to Resources . . . 25
1.2.2 Eco-Industrial Park . . . 25
1.2.3 Motivations of the thesis. . . 28
1.3 Process Integration . . . 29
1.3.1 Heat integration . . . 29
1.3.2 Mass Integration . . . 31
1.3.2.1 Fixed pollutant load . . . 31
1.3.2.2 Fixed flow rate . . . 32
1.3.2.3 EIP mass integration . . . 34
1.3.3 Coupled Heat/Mass Integration. . . 35
1.3.3.1 Graphical approaches . . . 36
1.3.3.2 Mathematical approaches . . . 36
1.3.3.3 EIP mass and heat integration . . . 38
1.3.4 Synthesis of the state of the art . . . 38
1.4 Scientific ambitions and methodology presentation . . . 39
2 Heat integrated resource allocation network design 43 2.1 Problem statement . . . 44
2.2 Model Formulation . . . 46
2.2.1 1st MILP: Targeting the minimum fresh consumption (M1) . . . 46
2.2.1.1 Mass balance and property constraints . . . 46
2.2.1.2 Technical restrictions on mass flow rates. . . 47
2.2.1.3 Objective function . . . 48
2.2.2 2nd MILP: Targeting the minimum annualized operating cost (M2) . 48 2.2.2.1 Limitations of the fresh resource consumption search space 48 2.2.2.2 Heat integration . . . 49
2.2.3 Objective function . . . 56
2.3 Case studies . . . 57
2.3.1 Mono-contaminant case: Ammonia Recovery . . . 57
2.3.1.1 Comparison with literature results . . . 58
2.3.1.2 Sensitivity analyses . . . 61
2.3.2 Multi-properties case: Phenol Production Process . . . 70
2.3.2.1 Influence of on-site constraints on the minimum fresh con-sumption . . . 71
2.3.2.2 Influence of on-site constraints on the annual operating cost, resource consumption and utility requirements . . . . 72
2.4 Conclusion . . . 74
3 Simultaneous mass allocation and heat exchanger networks design 77 3.1 Problem Statement . . . 78
3.1.1 Mixer unit representation . . . 81
3.1.2 Splitter unit representation . . . 82
3.2 Model Formulation -3rd MILP: MAHEN optimal design (M3). . . 83
3.2.1 Mass Balance . . . 83
3.2.2 Heat balance . . . 85
3.2.3 Heat Exchanger Network . . . 91
3.2.3.1 Notations . . . 91
3.2.3.2 Heat Balance . . . 92
3.2.3.3 Beginning of an heat exchanger . . . 93
3.2.3.4 End of an heat exchanger . . . 94
3.2.3.5 Intermediate parts of an heat exchanger . . . 95
3.2.3.6 Heat transfer consistency and minimum temperature en-forcing . . . 95
3.2.3.7 Mixer unit specific equations for heat exchangers within its beginning interval . . . 96
3.2.5 Mixer Unit screening . . . 98
3.3 Case Study . . . 100
3.3.1 Mono-contaminant case: Ammonia Recovery . . . 100
3.3.1.1 Comparison with literature results - Analysis on Nop. . . . 101
3.3.1.2 Sensitivity analysis on temperature intervals number (∆Tstepmax)103 3.3.2 Multi-properties case: Phenol Production Process . . . 105
3.4 Conclusion . . . 111
4 Simultaneous Heat and Mass integration with Regeneration Units 113 4.1 Regeneration units within the Industry. . . 114
4.1.1 Characterization of regeneration units . . . 115
4.2 Model of regeneration units . . . 115
4.2.1 Mass balance . . . 116
4.2.2 Heat requirement of the inner stream . . . 116
4.2.3 Operating and Capital costs. . . 117
4.3 Case Study . . . 117
4.3.1 Production unit: Thermal Membrane Distillation . . . 118
4.3.1.1 Problem statement. . . 118
4.3.1.2 TMD Model . . . 118
4.3.1.3 Optimal TMD inlet temperature . . . 124
4.3.1.4 Sensitivity Analyses . . . 134
4.3.2 Treatment unit: Phenol removal . . . 137
4.3.2.1 Phenol environmental regulations . . . 137
4.3.2.2 Review of existing treatments . . . 137
4.3.2.3 Selected treatment model . . . 138
4.3.2.4 Results . . . 140
4.4 Conclusion . . . 142
5 Eco-Industrial Parks design 145 5.1 Model Formulation -4th MILP: Eco-industrial park optimal design (M4) . . . 146
5.1.1 Clusters of sites. . . 146 5.1.2 Heat network . . . 147 5.1.3 Mass network . . . 148 5.1.4 Networks design . . . 149 5.1.5 Objective function . . . 151 5.2 Case study . . . 152
5.2.1 Sites and clusters definition . . . 153
5.2.1.1 Site 1: Phenol production process . . . 153
5.2.1.3 Site 3: Wood to CH4 conversion process . . . 155
5.2.1.4 Site 4: Urban water and heat utilities . . . 157
5.2.1.5 Site 5: TMD . . . 157
5.2.2 Clusters definition and Territorial layout . . . 158
5.2.3 Problematic and Solving strategy . . . 159
5.2.4 Individual Cluster optimization . . . 160
5.2.5 Networks optimization . . . 162
5.2.6 Sensitivity analysis . . . 172
5.3 Conclusion . . . 176
Conclusions and Perspectives 179
Nomenclature 187
List of Figures
1.1 World population since the Industrial Revolution and its possible variations
[113] . . . 16
1.2 cap . . . 16
1.3 cap . . . 17
1.4 cap . . . 18
1.5 World total primary energy consumption from 1971 to 2013 by fuel (Mtoe) [35] 18 1.6 CO2 emissions between 1990 and 2014 [38]. . . 19
1.7 Projection of world’s final energy consumption by fuel by 2040 (×1015Btu) [30]. . . 19
1.8 Technical solutions to limit CO2 emissions and their potential [37] . . . 20
1.9 Avoided volume and value of energy imports from efficiency investments in IEA (2014) [36] . . . 21
1.10 Cap . . . 21
1.11 Water consumption by sector [111] . . . 22
1.12 cap . . . 26
1.13 Eco-Industrial park of Ulsan, South Korea [12] . . . 27
1.14 Water Pinch diagram [116] . . . 32
1.15 Mass composite curves . . . 33
2.1 Elements and notations of the M1 and M2 models . . . 45
2.2 Schematic representation of interactions between mass and heat streams . . 45
2.3 (a) Initial temperature scale - (b) Final temperature scale . . . 51
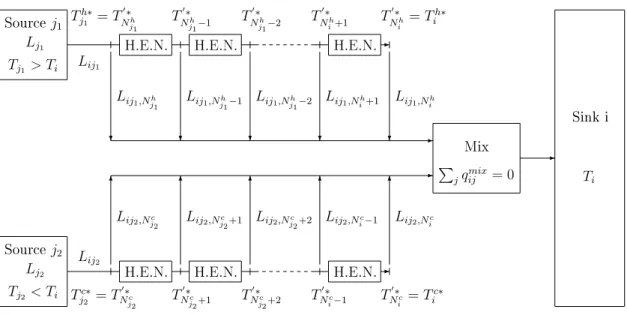
2.4 Superstructure for mass/heat integration through non-isothermal mixing. . 52
2.5 Non-isothermal mixing example - Nsplitmax= 1 . . . 53
2.6 Particular case of the isothermal mixing . . . 53
2.7 Heat Cascade Diagram . . . 56
2.8 Optimal HIRAN for ammonia recovery case - ∆Tmin= 35◦C . . . 59
2.9 Optimal HIRAN for ammonia recovery case - ∆Tmin= 10◦C . . . 60
2.10 Sensitivity analyses of AOC and Lf reshto Cf resh . . . 62
2.11 Sensitivity analyses of Qh, Qc and Lf resh to Cf resh . . . 62
2.13 Optimal HIRAN configuration when Cf resh= 0.03e.ton−1 . . . 64
2.14 Optimal HIRAN configuration when Cf resh= 0.01e.ton−1 . . . 65
2.15 Sensitivity analyses of Qh, Qc and Lf resh to ∆Tmin - Cf resh= 0.05e.ton−1 66 2.16 Sensitivity analyses of Qh, Qc and Lf resh to ∆Tmin - Cf resh= 0.025e.ton−1 67 2.17 Variation of Qh, Qc and Lf resh - Cf resh= 0.015e.ton−1 . . . 67
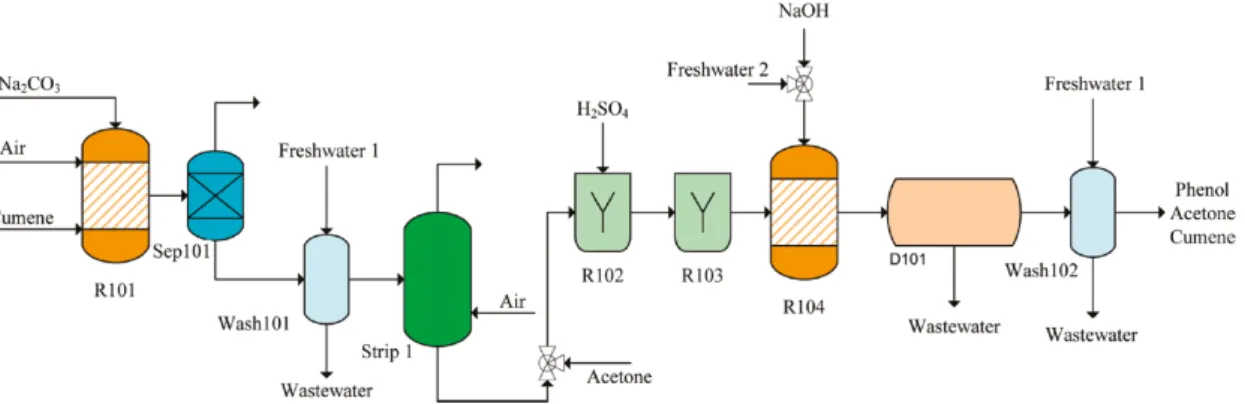
2.18 Phenol production flow sheet . . . 70
3.1 Schematic representation of interactions between the MAN and HEN . . . . 78
3.2 Problematic regarding the number of heat exchangers with the current model formulation . . . 79
3.3 Possibility of mass streams mixing before the HEN . . . 79
3.4 Elements and notations of the M3 model. . . 80
3.5 New schematic representation of interactions between the MAN and HEN . 80 3.6 Mixer Units . . . 81
3.7 Splitter Units . . . 82
3.8 Superstructure for mass/heat integration through non-isothermal mixing. . 86
3.9 Heat exchanger . . . 91
3.10 Optimal MAHEN for phenol production case (Nop = 2 year) . . . 102
3.11 Optimal MAHEN for the phenol production case (Nop = 1 year) . . . 106
3.12 Selection of mixer units for the phenol production case (Nop= 1 year) . . . 107
3.13 Mixer unit influence on T AC for the phenol production case (Nop = 1 year) 107 3.14 Optimal MAHEN for the phenol production case with mixer unit (Nop = 1 year) . . . 108
3.15 Optimal MAHEN for the phenol production case with optimal mixer unit (Nop = 20 years) . . . 109
4.1 Generic representation of a regeneration unit . . . 115
4.2 Common TMD configurations [90] . . . 119
4.3 TMD configuration within the mass/heat integration problem . . . 121
4.4 Total annualized cost. . . 126
4.5 Optimal MAHEN structure for TT M Din = 62◦C . . . 128
4.6 Optimal MAHEN structure for TT M Din = 74◦C . . . 129
4.7 Optimal MAHEN structure for TT M Din = 78◦C . . . 130
4.8 Optimal MAHEN structure for TT M Din = 82◦C . . . 131
4.9 TMD fresh water production cost . . . 133
4.10 Sensitivity analysis results for TT M Din = 60◦C . . . 134
4.11 Sensitivity analysis results for TT M Din = 74◦C . . . 135
4.12 Optimal MAHEN with phenol treatment units and optimal mixer unit (Nop = 10 years) . . . 140
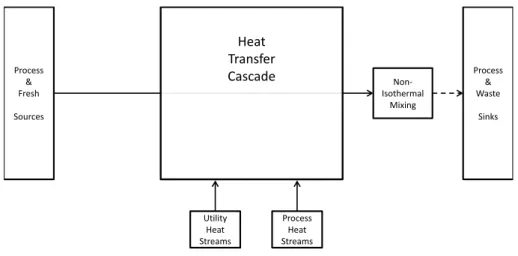
5.2 Schematic representation of a heat network . . . 147
5.3 Mass Network. . . 148
5.4 Example of clusters map . . . 149
5.5 cap . . . 152
5.6 Methanol production process flow sheet [34] . . . 154
5.7 Wood to CH4 conversion process flow sheet . . . 156
5.8 Territorial layout for the EIP case study . . . 158
5.9 Initial optimal MAHEN structure for the phenol cluster . . . 160
5.10 Initial optimal MAHEN structure for the methane cluster . . . 161
5.11 Case 1: EIP network when TMD is in the phenol cluster . . . 165
5.12 Case 1: EIP optimal structure when TMD is in the phenol cluster . . . 166
5.13 (a) Limitation imposed - (b) Limitation lifted . . . 167
5.14 Case 2: EIP network when TMD is in the methane cluster. . . 168
5.15 Case 2: EIP optimal structure when TMD is in the methane cluster . . . . 169
5.16 Case3: EIP network when TMD is in the city cluster . . . 170
5.17 Case 3: EIP optimal structure when TMD is in the city cluster . . . 171
5.18 EIP network when TMD is in the methane cluster - Ccity< 4e.tons−1 . . . 174
List of Tables
2.1 Ammonia recovery case - Process Data. . . 58
2.2 Ammonia recovery case - Economic Data and Calculation Parameters . . . 58
2.3 Comparison with literature results - ∆Tmin = 35◦C . . . 58
2.4 Comparison with literature results - ∆Tmin = 10◦C . . . 60
2.5 Optimal targets and computation time depending on Nsplitmaxand Cf reshwith ∆Tstepmax = 5◦C . . . 68
2.6 Computation statistics depending on Nsplitmax and ∆Tstepmax with Cf resh = 0.09e.ton−1 . . . 69
2.7 Phenol production case - Process Data . . . 70
2.8 Phenol production case - Economic Data and Calculation Parameters . . . 71
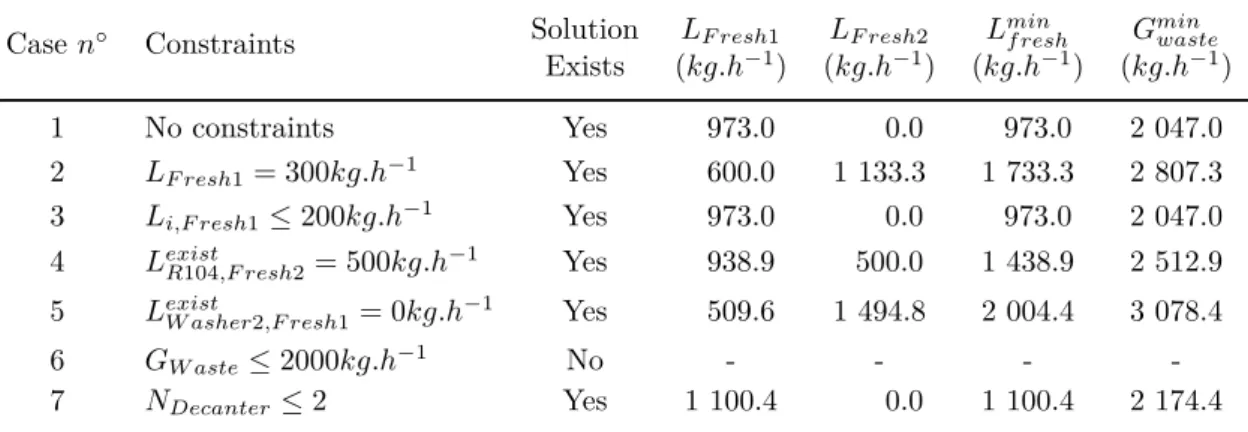
2.9 Minimum Fresh Resources and Waste for different technical constraints . . 71
2.10 Results for different technical constraints - (sequential strategy) . . . 73
2.11 Results for different technical constraints - (simultaneous strategy) . . . 73
3.1 Ammonia recovery case - Process Data. . . 100
3.2 Ammonia recovery case - Economic Data and Calculation Parameters . . . 101
3.3 Ammonia recovery case - Results . . . 101
3.4 Sensitivity analysis on ∆Tstepmax - Main results and statistics . . . 103
3.5 Phenol production case - Process Data . . . 105
3.6 Phenol production case - Economic Data and Calculation Parameters . . . 105
3.7 Comparison between results for different operating period of time. . . 110
3.8 Phenol production case - Problem statistics . . . 110
4.1 Phenol production case with TMD - Additional Process Data . . . 123
4.2 TMD characteristic parameters and cost function coefficients . . . 124
4.3 Phenol production case - Heat and mass requirements with the TMD. . . . 126
4.4 TMD case - Sensitivity analyses results . . . 136
4.5 Process Data . . . 139
4.6 Phenol treatment results . . . 141
5.2 CH4 to Methanol case - Process Data . . . 154
5.3 Heat streams of methanol production process . . . 155
5.4 Wood to CH4 case - Process Data . . . 156
5.5 Heat streams of methane production process. . . 156
5.6 Domestic hot water network . . . 157
5.7 Urban water network . . . 157
5.8 TMD unit - Process Data . . . 158
5.9 TMD characteristic parameters and cost function coefficients . . . 158
5.10 Distances between nodes . . . 159
5.11 Individual cluster results . . . 162
5.12 Remaining heat streams from the phenol cluster . . . 162
5.13 Remaining heat streams from the methane cluster . . . 163
5.14 Heat networks available for the EIP . . . 163
5.15 Mass Networks available for the EIP . . . 164
5.16 EIP results . . . 164
5.17 New remaining heat streams from the methane cluster . . . 173
5.18 Remaining sources and sinks from the methane cluster . . . 173
Introduction
Sustainability is a notion that is taking a greater importance in industrial process en-gineering, as low-cost energy supplies and high quality natural resources, such as clean water, are getting scarcer and scarcer. Moreover, environmental and quality regulations are getting more restrictive, which implies substantial investments in waste treatment units. Industries are looking for innovative ways to maintain or gain a competitive edge while facing new economic and environmental challenges.
Process effluents recovery can be a tremendous source of revenue as well as a smart way to reduce their environmental footprint for industrial processes. Reusing effluents for heating purposes or reducing resource consumption can lead to substantial operating costs savings. Moreover, actual synergies between several companies sharing resources and wastes can be sources of new untapped potentials for reducing resources needs and environmental footprint while improving the economic competitiveness of several industrial partners on a larger scale. This type of cooperation between industrial companies is called an eco-industrial park (EIP).
Therefore, technical solutions to reach these objectives must be designed to be cost-effective and meet modern ecological standards. The method developed to find these solutions must be applicable at different scales: from the process to the territorial level.
The main motivation of this thesis is to help industrial actors (or groups of them resulting in an eco-industrial park) to reduce their consumption of resources and energy, and limit their environmental footprint, without modifying the design of unitary operations within the process. The objective is to find the best economical solution to recycle waste effluents generated by industrial processes and use them as resources to supply heat and matter to the process simultaneously. Thus, limiting the amount of wastes to be treated and discarded back to the environment as well as reducing its dependency to energy suppliers and the swift price variations.
Mass and heat integration must be considered at once because every operation within the process requires matter and energy to accomplish its defined tasks. Matter may be used to transport energy. Energy may be transformed to produce matter. Finding ways to use waste effluents as mass and energy resources can lead to substantial operating costs savings and complying more easily with strict environmental regulations.
Few works have tried to consider these two aspects in a single model, especially when the unitary operations of a given process are modeled as sinks (entry of the unit) and sources (exit of the unit) with available or required fixed flow rates, respectively. More-over, the research on eco-industrial parks structures is quite recent and has really taken off in the last decade. Solving this kind of optimization problem is quite complex because it involves different companies, with different objectives and mutually shared structures (such as pipelines, treatment units, utilities,...). Mathematical optimization techniques are the most appropriate to address this type of problem. Among them, linear formula-tion seems more relevant than non-linear because, even though non-linear approaches are the most studied optimization techniques due to their easy set up, they require an initial guess and can be stuck in a local optimum, if they converge at all. Linear formulation can be demanding in computational power and time, but their resolution is more steady and reliable. Therefore, using a linear formulation of the problem, while avoiding losing accuracy, is a challenging task with an interesting advantage when it comes to solving the problem.
The main contributions produced in the presented work are summarized as follows: • Three systematic and systemic linear models have been developed to optimize
the mass and heat requirements of an heat integrated mass allocation network within any industrial process. Mass streams are characterized by their composition and properties. Several external sources of fresh matter or heating utilities contribution can be considered and optimized in a single problem. The opportunity of non-isothermal mixing is readily available in the model linear formulation to further reduce energy needs.
• The last presented model allow minimizing the operating and capital costs of the optimal mass allocation and heat exchanger networks (MAHEN) simultaneously.
• A generic and simple formulation representing regeneration units can be used in order to integrate them in the design of mass allocation and heat exchanger network.
• The three developed models can be applied at various scales designing local and global heat and mass networks. A few additional notions (sites, clusters, intermediate heat and mass networks) are added to represent the possibilities of sharing resources between companies when addressing an EIP design problem. But, the same models are used to address the problem at each scale.
• A spatial representation of industrial sites are taken into account in an EIP design problem. The distance and the position of each site are considered in the cost of the
The models developed as well as the methodology to use them are presented in the fol-lowing chapters:
• The first chapter of this manuscript describes the societal, environmental and indus-trial issues that motivate this work. A literature review of the various approaches regarding process integration is presented. It helps explaining the scientific objec-tives defined for this work. Finally, the solving methodology is presented.
• The second chapter introduces the general features of the heat and mass integration problem. A first linear model (M1) allows solving solely the mass allocation network constraints to find the minimum fresh resource consumption. Then a second linear model (M2) presents a new superstructure that allows considering the mass and heat aspects of the problem simultaneously. This model aims at targeting the minimum operating cost considering mass and energy related costs. The models are tested on two literature case studies to show the advantage of simultaneous optimization of both heat and mass requirements over a sequential approach. Several sensitivity analyses on different parameters are carried out to evaluate their influence on the optimal solution.
• The third chapter presents the third linear model (M3) which allows designing the optimal mass allocation and heat exchanger networks simultaneously. The objective function of this problem is the total annualized cost considering operating and capital costs. The model introduces new objects (mixer and splitter units) to further reduce the number of heat exchangers in the HEN and consequently its cost. The two previous case studies are used to illustrate the performances of the proposed model compared to literature results and show the capacity of the mixer and splitter units to improve the solution.
• The fourth chapter adds to the three previous models the possibility to use objects named regeneration units that allows modifying properties of mass streams in order to further improve the recycling of waste effluents. A study of the integration of two different technologies (a thermal membrane distillation unit to produce fresh water from salted water and available excess heat, and a liquid-liquid extraction unit to comply with environmental regulations) in on the two previous case studies (the phenol production case) is presented illustrating the possibilities offered by this regeneration unit model and evaluating the influence on the MAHEN design.
• The fifth chapter presents a new linear model (M4) expanding the applicability of the three previous models to larger scales by introducing new concepts (sites, clusters, and indirect heat and mass networks between entities) which allow finding the optimal design an eco-industrial park. A case study is developed to illustrate how is applied the extended model as well as different optimization strategies that can be applied to such problem.
• The last chapter presents the conclusions and proposes perspectives of necessary future developments after this work.
Chapter 1
Context and Challenges
In this chapter, contextual elements are presented to show the link between world systemic constraints (demographic and economic growths), resources consumption (focusing mainly on energy and water) and environmental issues (climate change and upcoming resources scarcity) related to the current production and consumption patterns.
The concepts of circular economy and industrial ecology are introduced as they repre-sent new potential practices that can help current societies making the shift towards true sustainability. They argue that wastes produced by human activities, particularly in the industry, can be considered as readily available and economical resources.
One industrial application of these concepts is the eco-industrial park (EIP) in which various industrial partners share resources and wastes to improve their economic and en-vironmental performances. Two illustrative examples are provided to demonstrate the potential of EIP and the motivations of the thesis are presented.
A state of the art review of the theoretical notions of heat and mass integration as well as coupled mass/heat integration is realized to understand the basic notions that will be use as a framework for the presented work.
Finally, the scientific challenges this work is trying to meet regarding the simultaneous design of mass and heat recovery networks as well as the synthesis of EIP are presented. The developed models and methodology to tackle these challenges are described.
1.1
General overview
1.1.1 Systemic constraints
Since the industrial revolution, the world population has grown exponentially from 1 billion around 1850 to 7.4 billion today (Fig.1.1). It increases at a staggering rate of 80 millions people per year. This expansion can be easily associated with technological innovations; in particular, with the rise and mastering of energy provided by fossil fuels.
Figure 1.1: World population since the Industrial Revolution and its possible variations [113]
It has resulted in a tremendous period of prosperity for human civilization unprece-dented in History (Fig.1.2). The exponential growth of the world’s gross domestic product (GDP) from the 1850s is evidence of it.
However, this population and economic growth put a great and steady pressure on the environment since more and more natural resources are consumed as well as wastes and pollutions are generated. Indeed, in the prevailing linear economic model, resources are extracted and transformed to produce goods and services which are then consumed producing wastes that are more or less discarded as they are to environment.
Figure 1.3: CO2 emissions since the Industrial revolution2
Unfortunately, the human activities has been profoundly linked to an increase in green-house gases emissions and pollutions around the world (Fig.1.3). It results in dramatic changes in the climate and environment with significant consequences on human lives (nat-ural disasters, health issues, political conflicts) which may worsen if the current conditions remain identical. Knowing that in order to limit global warming to 2◦C, a maximum CO2
emissions of approximately 3 000 gigatons (Gt), of which two thirds have already been emitted [38] should not be exceeded. This suggests that the current economic model is not sustainable for the planet as well as for its inhabitants.
A steadily increasing proportion of the population in developing countries (basically countries which are not OECD3 members), particularly in China and India where one third of the world’s population lives, are demanding higher living and working standards; driven by the globalization of markets, information and culture. Therefore, building in-frastructures is necessary to provide a more reliable access to food, water and energy as well as all goods and services that the modern economy of developed countries offers to its inhabitants. For that purpose, their industrial sector will consume more and more natural resources and energy (in particular fossil fuels as shown in Fig.1.4) to meet the growing demands.
The world population is expected to reach 9 billion people around 2050 (Fig.1.1). More and more people will live in cities (by 2050, nearly 70% of the world population will live in urban areas [87]) and will have access to all goods that the economy can offer (cars, computers, Internet, smart phones,...).
1https://ourworldindata.org/gdp-growth-over-the-last-centuries/
2Graph by Robert Simmon, using data from the Carbon Dioxide Information Analysis Center 3Organization for Economic Co-operation and Development
Figure 1.4: Non OECD industrial sector energy consumption forecasts (×1015Btu) [30]
This will create a strong competition for land (between agriculture, industry and hous-ing) and resources (especially in water stress regions between drinking water for people and water necessary for manufacturing goods). Therefore, new ways of producing and consuming must be found to sustain the rising population and its needs while avoiding environmental damages and resources scarcity.
1.1.2 Energy consumption and production
Currently, the world consumes on average 150 000 TWh of primary energy per year. It more than doubled over the last 40 years (Fig.1.5). Fossil fuels (coal, oil, gas) represent the main energy source with 78% of the world primary energy consumption. They are also the main source of greenhouse gases (GHG) emissions.
The world final energy consumption is roughly divided between residential (20%), transport (25%) and industry (55%) mainly provided by fossil fuels [35]. As shown in Fig.1.6, industrial activities account for more than 50% of world GHG emissions (32 Gt in 2014) and its share has been growing rapidly in non-OECD countries (mostly China and India) related to their economic growth. In OECD countries, relocation of industrial activities as well as measures to improve the energy efficiency helped controlling the level of emissions in the last 25 years. However, the global GHG emissions have increased by around 50%.
Figure 1.6: CO2 emissions between 1990 and 2014 [38]
By 2050, the world economy is expected to be four times larger than it is currently [87]. The energy needs will be 80% higher than today if no changes are implemented by then, whether on technical, cultural, political, economic or social levels. Even though the part of renewable energies in the world energy mix is likely to grow faster than any other types of energy source, fossil fuels will remain the most important one (Fig.1.7).
Even though their integration and management on the electrical grid remain a complex problem to be solved due to their intermittent nature, renewable energies are the future of world energy supply. One complementary solution that can help answering current environmental and economic issues would be reducing energy needs by improving radically the efficiency of existing urban and industrial processes. Indeed, energy efficiency aims at reducing energy requirements to produce the same output. In Fig.1.8, it represents around 40% of the total potential for GHG emissions reduction. In particular, it accounts for more than two thirds of the industry potential.
Figure 1.8: Technical solutions to limit CO2 emissions and their potential [37]
Energy efficiency has various economical advantages at different scales. For a company, it can increase a product profitability and reduce the dependency towards energy suppliers. For a country, it helps avoiding energy importations, controlling its trade balance and it will have deep political implications for its geopolitical strategies and budget allocations (seeFig.1.9).
Figure 1.9: Avoided volume and value of energy imports from efficiency investments in IEA (2014) [36]
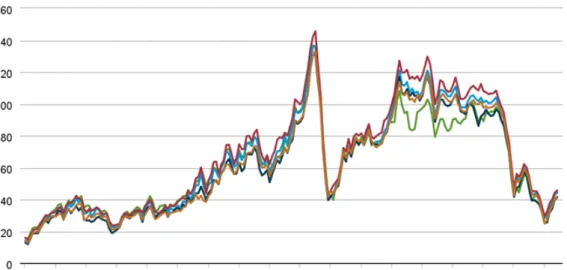
As shown previously, fossil fuels are likely to remain the main energy source for this century and since the beginning of it, oil and gas markets have experienced significant price volatility (Fig.1.10).
Figure 1.10: Crude oil prices variations since the beginning of the century4
The causes of these variations are often rooted in political turmoil (wars in Iraq, Syria and Libya), world economic crisis (sub-primes crisis in 2008) or technical uncertainties (supposed oil peak occurrence, US shale gas potential). These variations influence greatly social and environmental policies as well as profitability of investments. Therefore, reduc-ing energy needs can and will limit the economic impact of swift variations in fuel prices that are likely to occur in the decades ahead.
1.1.3 Water consumption
Over the last few decades, the soaring demand for freshwater, combined with substantial decline in available resources have led to water-supply issues around the world. In addition to water demand for drinking, urban, and agricultural purposes, water is an essential com-modity in many industries. The world consumes approximately 4000 km3 each year [112]. Its consumption increases by 1.6% each year. However, there are important disparities in resources and consumption: a small number of countries share more than half of all fresh water resources while few countries consume a consequent part of these resources (mostly USA, China, India) [87]. This situation can exacerbate tensions in water stress areas (for instance, conflict between Israel and Palestine over Jordan River). Moreover, environmental disasters may worsen (for instance, droughts in Africa or China, wildfires in USA) due to the combination of human activities development, poor water management and climate change. This reinforces the idea that natural resources such as water must be managed more efficiently.
Currently, water consumption is divided mainly into three sectors: domestic (10%), industrial (20%) and agricultural (70%) uses. However, these proportions change sub-stantially between countries as shown in Fig.1.11. Depending on how their economy is structured, the water use (apart from domestic use) will be directed towards the agricul-ture or the industry. If developing countries are using most of their water for agricultural purposes, one can argue that as they shift towards the structure of rich-income countries, industrial water use will grow quite strongly in the next decades, quite similarly as the energy demand.
Figure 1.11: Water consumption by sector [111]
Sustainable industrial development must involve cost-effective strategies for managing water consumption and treatments to conserve water resources and reduce the negative environmental impact associated with discharging wastewater into the environment. Wa-ter is used in various ways: washing operations, transport, solvent, raw maWa-terial and steam utility network. Even if its overall consumption is relatively small, the industry has a significant environmental footprint because wastewater effluents can contain various
Therefore, designing cost-efficient and performing water networks is a major challenge in the industry. European regulations5 aim at driving industrial actors towards zero liquid waste, ideally around 2020. Reusing and recycling as well as developing efficient produc-tion or treatment technologies are becoming essential. These operaproduc-tions and processes often require huge amount of energy. As well as energy production or transportation re-quire substantial amount of water. Therefore, finding ways to take advantage of the link between energy and water use (and more generally natural resources) can help tackle the various problems exposed previously.
1.1.4 Current and future regulations - Constraints on industrial actors
Political actions have been taken at different scales (international, regional or national) to improve resources use efficiency and limit environmental footprint of human activities.
In the early 90s, the Kyoto protocol set targets to signing partners to reduce their CO2 emissions levels by 2010. In march 2007, the European Union adopted new environmental targets even more ambitious than that of the Kyoto Protocol for 20206: 20% in renewable energies in its energy mix, 20% of energy consumption saved by increasing energy efficiency, 20% reduction of GHG emissions based on 1990 levels. Recently, countries met at COP 21 conference and agreed on new objectives for the next 30 years.
In order to reach the objectives in terms of energy efficiency, France decided to base its strategy on energy and fuel suppliers such as EDF, TOTAL or ENGIE [20]. These companies are expected to reduce their energy consumption or their clients’ by a given amount set over a period of time. For instance, the objective was set at 345 TWh cumac (cumulated and actualized) over the period of 2011-2014. EDF was in charge of 40% of the total7. In case the target is not met, the companies would be compelled to pay fines. Therefore, companies like EDF are looking for new and innovative ways to improve the energy efficiency of their clients.
Regarding natural resources such as water, environmental standards concerning their use and their disposal once transformed vary a lot from one country to another. But more and more regulations are tightened around the world since sustainability and pollution protection and prevention have become predominant in political actions.
In France, several laws8 and decrees9 control the use of water on the national terri-tory. In particular, they impose temperature, concentrations and physical and chemical limitations to wastewater effluents as well as specific locations for their restitution to the environment.
52455/2001/CE, 2000/60/CE
6ec.europa.eu/clima/policies/strategies/2020/
7
travaux.edf.fr/construction-et-renovation/demarches-on-vous-guide/les-certificats-d-economies-d-energie
8Loi n◦64-1245, Loi n◦92-3, Loi n◦2006-1772 9Arrêté du 02 février 1998, Arrêté du 5 juillet 2014
These regulations push industrial actors innovating to keep up with them and to keep their edge with respect to their competitors. One of the most promising solutions is to improve the efficiency of existing processes. One way to do so is to consider wastes no longer as liabilities but as resources with great potential.
In summary, the abundant and easy access to energy sources thanks to fossil fuels started an era in human history that led through unprecedented economic and demo-graphic growth. Unfortunately, the massive consumption of fossil fuels, as well as natural resources, has had major consequences on the environment. Now, since the economic and demographic trends are more than likely to keep moving in the same direction and an important part of the world’s population will need and want easy access to utilities and commodities, there is a critical need to shift our production and consumption habits. Moreover, focusing on the industry, companies must face new and necessary environmental regulations acting on their economic performances. Therefore, technical solutions must be designed to be cost-effective and meet modern ecological standards. One interesting solution is improving resources use efficiency of industrial processes. In order to achieve this objective, reusing and recycling waste effluents (heat or mass) allow creating new internal resources and reducing needs for external supplies. This idea is developed in the concepts of circular economy as well as industrial ecology which are the premises of the work presented in this thesis.
1.2
Circular Economy and Industrial Ecology
“A circular economy is restorative and regenerative by design and aims to keep products, components, and materials at their highest utility and value at all times. The concept dis-tinguishes between technical and biological cycles. It is a continuous positive development cycle that preserves and enhances natural capital, optimizes resource yields, and minimizes system risks by managing finite stocks and renewable flows. It works effectively at every scale”.10
Circular economy is a concept that seeks to design every human activity as part of closed-looped processes rather than linear open lines. Instead of exploiting resources and discarding them once transformed, consumed and treated, by-product and wastes can undergo transformations and re-enter the processes to avoid the consumption of new resources and limit the impact on its environment. The European Commission adopted the
Circular Economy Package11 in December 2015 to help its members make the transition
towards this type of economy by setting targets for reduction of waste and establish an ambitious and credible long-term plan for waste management and recycling.
10www.ellenmacarthurfoundation.org 11
In the same philosophy, the concept of industrial ecology can be seen as a particular application of the circular economy concepts. On a given area, industrial partners look for synergies between their processes in order to share resources and wastes that can help all actors to reduce globally their environmental footprint and improve their economic performances. One of the most promising applications of this concept is the development of eco-industrial parks. However, early partial applications appeared with the effort to recycle wastes.
1.2.1 Wastes to Resources
The development of bio-fuels is a good illustration of the interest of giving wastes a new purpose. At first, bio-fuels were and still are produced using agricultural products such as beet-roots or sugar cans for ethanol, or soya, colza or wheat for bio-diesel. However, these crops create a competition with the ones used for feeding people, require new lands, water, energy and chemicals to be produced. These drawbacks limit the interest for these new fuels as they defeat their purposes of being more environmental friendly than fossil fuels. However, the second generation of bio-fuels are based on using agricultural wastes [18]. These new resources do not require any extra use of energy, water or chemicals. They can provide additional revenues for farmers and they are economical for fuel producer. Actually, there are more and more processes developed to transform biomass wastes into fuels and bio-gas such as waste wood [84], wastewater [48] and several other industrial or agricultural wastes [11,85].
These examples are simple illustrations of the circular economy and industrial ecology concepts as wastes from one industry can become a resource for another one; reducing the environmental footprint and improving the profitability of both processes. However, these opportunistic exchanges can be expanded and organized on a larger scale to increase the synergies and reach even greater environmental and economic performances. This organization between several industrial sites is called an eco-industrial park.
1.2.2 Eco-Industrial Park
Chertow [21] defines Industrial Symbiosis as “engaging traditionally separate entities in
a collective approach to competitive advantage involving physical exchange of materials, energy, water, and by-products”. An Eco-Industrial Park (EIP) is “a community of man-ufacturing and service businesses located together on a common property. Members seek enhanced environmental, economic, and social performance through collaboration in
man-aging environmental and resource issues” [79]. Many projects have emerged in last 40
years around this concept and it gains more and more attention recently since it brings an appealing solution to the many economic, social and environmental issues that have been mentioned previously.
Kalundborg (Denmark) is one of the first successful examples of eco-industrial park. It includes nine public and private companies including a power station (Asnaes), oil refinery (Statoil) and the municipality (Fig.1.12).
It started in 1972 when the oil refinery accepted to provide excess gas to a gypsum board producer (Gyproc). The integration between companies gradually evolved over times as they negotiated (without any state intervention) to share water supply, waste heat and other materials over the last 40 years.
Figure 1.12: Eco-Industrial park of Kalundborg, Denmark12
Substantial savings are realized for the different partners: 1.2 million cubic meters of freshwater for Statoil, 30 000 tons of coal for Asnaes, the urban heating network is com-pletely supplied by the power station waste heat, and much more other kind of savings. Overall, the industrial symbiosis avoid 275 000 tons of CO2 emissions per year [95].
Countries around the world are trying to set a legal framework and financial aids to boost the creation of such structures, in particular in China, Japan, the Netherlands and South Korea. The Ulsan eco-industrial park started in much the same way than Kalundborg, around 1985 when regulations were getting tighter in South Korea because severe episodes of environmental pollution. In 2005, it was selected to be part of the governmental program called “Korean EIP Master Plan” launched to develop 8 national EIPs between 2005 and 2020.
It regroups various types of industries as shown in Fig.1.13. The presented structure realized 68.52 millions of dollars of profits in 2012 with a payback time estimated between few months to less than 4 years for the connections implemented. Every year, the EIP
CO2 emissions are reduced by 227 ktons [12] compared to the non integrated situation.
Figure 1.13: Eco-Industrial park of Ulsan, South Korea [12]
Obviously, EIP implementation is a complex matter since it may involve many indus-trial partners and the idea that each company could depend on others can really hinder its deployment or at least slow it down. However, the results of existing structures motivate the study and optimization of future industrial symbioses to reach even greater perfor-mances.
These two examples illustrate well the important gains that can result from industrial symbiosis regarding cost-effectiveness, CO2 emissions reductions and overall resources use efficiency. The approaches took to build and set up eco-industrial parks are really specific to each case. No systemic and systematic methodology exists to search optimal synergies between industrial sites. The development of models and tools dedicated to EIP design would facilitate the dialog between potential industrial partners by testing various sce-narios to find the most appropriate design and encourage strongly the implementation of such structures.
1.2.3 Motivations of the thesis
The main motivation of this thesis is to help industrial actors (or groups of them such as in an EIP) to reduce their consumption of resources and energy, and limit their environmental footprint. The objective is to recycle waste effluents generated by industrial processes and use them as resources to supply heat and matter to the process. Thus, limiting the amount of waste to be treated and discharged back to the environment as well as reducing the dependency of industrial companies to energy suppliers and to swift price variations.
The scientific objective of this work is to develop a methodology that helps designing optimal networks to reallocate, regenerate and treat waste effluents (mainly liquids) as well as heat exchange networks to recover and take advantage of their heat content. Much of the interest of this work focuses on improving existing processes design, not to transform them because most of the potentials can be found in existing structures and industrial companies are often reluctant to modify drastically their processes. The methodology must lead to economically interesting solutions since it is one of the main conditions for an industrial company to implement changes on its process to be more competitive.
The methodology must be based on a systemic approach as it should be able to look at the full resource efficiency potential of the studied system. The approach must be applicable at different scales (process, site, EIP). It should be able to look for further synergies and take into account characteristics constraints and opportunities at each scale. The methodology must also be systematic because it must adapt to any type of industrial processes (refinery, petrochemical, food, paper, metal, chemical industries,...) and be studied with the same approach to be able to compare results with one another. That is why the starting point of this work will relies on the state of the art review of Process Integration methodologies. This research area is looking for approaches to optimize resources consumption in industrial processes meeting all the criteria mentioned previously.
1.3
Process Integration
Process integration is a “holistic approach to process design, retrofitting and operation that
emphasizes the unity of the process” [39]. It is a concept used for improving industrial
process resources consumption. The methodology is based on a systemic and systematic approach. Every operation requires energy and matter as inputs and can produce them as outputs; therefore, looking globally at a process, synergies can be found internally in order to reduce the need for external resources. The main idea is to realize mass and energy balances considering all inlet and outlet streams at once; rather than focusing on each unit composing the process. A recent state of the art review has been realized by Klemes et al. [71].
The main objectives of process integration are:
• Evaluating minimal resources consumption (mass or heat) based on preliminary design of process units ahead of the complete and final process design. This is called
targeting.
• Reducing resources consumption and waste generation (mass or heat) by recovering waste heat or matter looking for matches throughout the whole process.
• Lowering operating and capital costs (OPEX and CAPEX).
By adding constraints (for instance, forbidding heat exchange between two particular heat streams), modifying operating conditions or changing which streams are considered, different integration patterns can be generated. The strength of this methodology is to be able to look at various solutions (depending on costs/benefits analysis or operating constraints) without having to design precisely any elements in the process (such as heat exchangers, reactors, separators,...). Moreover, it allows its application to a variety of process: refinery [29,108], chemistry [33,66], paper [63], food [70].
Research on this topic started during the 70’s with works on heat integration. Af-terwards, during the late 80’s, mass integration was introduced as an extension of the previous research on heat recovery. Finally, in the early 2000’s, research began to focus on a coupled mass/heat problem.
1.3.1 Heat integration
During the oil crisis throughout the 70’s, improving energy efficiency in the industry be-came a topic of interest. The fundamental idea is to seek out every internal need for heating and cooling, and try to match them as well as possible using heat exchangers. Heat loads that cannot be provided or extracted with internal streams are taken care of by external utilities. The evaluation of what could be the Minimum external Energy Re-quirements (MER), Linhoff et al. [76] introduced the concept of Pinch Analysis. Since
then, various approaches have been to tackle the optimization problems of energy require-ments, heat exchanger network (HEN) design or utilities and thermodynamic conversion systems sizing (such as heat pumps or Rankine cycles).
Pinch Analysis is a graphical method that consists of evaluating the minimum external energy requirements for a given set of heat streams characterized by their heat loads and their inlet and outlet temperatures. Given a minimum temperature difference ∆Tmin, which characterizes the balance between heat recovery efficiency and cost-effectiveness, composite curves can be built to show the MER of the design. The main information drawn from this curve is the pinch temperature and heating and cooling targets. The pinch temperature defines two independent problems: above the pinch, where there is a shortage of heat, and below the pinch, where there is an excess of heat.
Once targets have been evaluated, a more detailed study is led to synthesize a network of heat exchangers capable of reaching heating and cooling targets. Moreover, different objectives (utility cost, GHG emissions, number of heat exchangers or capital costs) may be targeted; therefore, moving away for minimum energy consumption. The results of such studies are to design cost-effective networks resulting in a decrease of energy consumption. Multiple strategies were developed from the pinch analysis [76,77] towards mathematical optimization techniques [10,92,117] to reach a more optimal design [61,94] as well as integrated more realistic constraints.
Regarding energy integration at territorial scale, it was initially developed under the name of ‘“Total site analysis (TSA)” by Dhole et al. [29] which was further explained by Klemeš et al. [69]. By then, the methodologies developed tried to extend the pinch analysis to multiple sites as well as including the design of energy conversion systems such as co-generation and heat pumps between several sites. Several recent works are still based on graphical approaches [65,114].
Rodera et al. [97] developed an MILP model based on pinch analysis to distribute directly or indirectly available heat through several plants optimizing the heating and cooling requirements as well as the optimum location of the intermediate fluid circuits. Several works followed improving this initial one and keeping the same overall procedure [7,8,98].
Recently, Farhat et al. [45] proposed a methodology based on the exergy optimization for selecting network temperature and then optimizing in the operating and capital costs including the heat exchanger cost with heating network as well as the length, diameter and pressure losses within the pipes.
1.3.2 Mass Integration
Similarly to heat integration, the objectives of mass integration are to look for internal opportunities to avoid using external resources and reduce waste generation (sent to costly treatment units or the surroundings of the plant subjected to strict regulations). These objectives can be reached by allocating waste streams (sources) towards process units (sinks or demands) that may require specific amount of matter with particular features (i.e. composition or properties).
Indeed, for operating or safety reasons, limitations can be set at the inlet of every process unit. This will translate by defining allowable composition and property ranges. Therefore, the resulting composition and properties of the mixture entering a given process unit must be within the set boundaries. And as heat integration, mass integration first works were based on insights given by composite curves diagram as it is shown in following paragraphs.
Different types of mass integration problem exist depending on what transformations matter can undergo [41]:
• Direct Reuse: Waste streams are used as they are
• Recycle: Waste streams can be treated (with regeneration units) to be either recycled within the process or discharged to the environment
• Reactor network: Waste streams can be transformed and generate new streams with different contents
The work presented in this thesis will focus on the reuse and recycle of waste streams. The definition of the basic reuse/recycle problem can be of two types: fixed pollutant load or fixed flow rate.
1.3.2.1 Fixed pollutant load
Process units considered are the ones where a pollutant load is transferred to a solvent (mainly water). In this kind of process, only the composition is considered. Each process unit is characterized by a fixed pollutant load and limitations in terms of inlet and outlet maximum allowable composition. Inlet and outlet streams are related to each other. The problem is defined as mono-pollutant or multi-pollutant [116].
The objectives of this type of problem are:
• Determining the optimal flow rates to go through each process unit • Finding the optimal inlet and outlet composition
• Establishing the amount of fresh resource required • Designing the optimal network topology
Based on an analogy with heat integration composite curves, Wang et al. [116] built water pinch diagram which plots pollutant load versus maximum concentration (Fig.1.14). Similarly to classical composite curves, targets can be identified from this diagram con-cerning the minimum fresh water requirements as well as the minimum waste discharge. Note that this representation is mostly associated with water network design.
Sev-Figure 1.14: Water Pinch diagram [116]
eral conceptual [32,55] and mathematical models [6,101,102,108] have been developed in order to minimize water consumption in industrial processes for single or multi contam-inant cases. Some of these works included treatment units to further reduce the water consumption [15,46,59,66,72].
The main drawback of this problem definition is that process units are defined by one or several mass loads to be removed; discarding several other types of units such as reactors that can generate or consume materials. Moreover, their characterization are limited to the stream composition (and no other physical or chemical properties such as
pH or COD) and the design of each unit is variable. Therefore, for preexisting processes
where unitary operations designs are fixed, it is interesting to consider “fixed flow rate” problem definition.
1.3.2.2 Fixed flow rate
In this approach, process units can be of any kind as long as they produce or consume a specific matter: mass exchanger, reactors, separators or coolers. They are designated as sources and sinks. The design of each process unit is not considered.
Sources are waste streams with a fixed flow rate and fixed composition and properties. Sinks are process units requiring a fixed amount of matter characterized by composition and properties that are included within acceptable range. Inlet and outlet streams are
The objectives are:
• What amount of fresh resource is required? • What is the topology of the network?
Similarly to the previous problem, graphical approaches based on the pinch analysis were developed to target minimum fresh resource consumption and waste generation by plotting sources and sinks composite curves on a cumulated mass load versus cumulated flow rate diagram (Fig.1.15).
Figure 1.15: Mass composite curves
As the complexity of this problem grows, graphical methodologies can no longer be efficient because they cannot account for all the dimensions of the problem; therefore, mathematical approaches have been developed to address this problem more easily. The characteristic quality can refer to a single contaminant composition [42,49], multiple con-taminants composition [40] or properties [43,67,68,86,93].
This problem definition is more appropriate when trying to build an add-on recycling network rather than make the process fit such network. Moreover, it seems more likely that an eco-industrial park will be built from existing processes which can thus be decomposed into sources and sinks.
1.3.2.3 EIP mass integration
The research on Eco-Industrial Parks structures is quite recent and has really taken off in the last decade. Solving the problem of EIP optimization is complex because it involves different companies, with different objectives and mutually shared structures (such as pipelines, treatment units, utilities,...).
An extensive literature review was realized by Boix et al. [14] showed that among all the EIP optimization studies, most of them focused on optimizing the sharing of a particular resource. This resource is often water or energy. Fewer studies proposed approaches for other specific resources such as H2 which are more case related [56,75,106].
EIP water networks were extensively studied using both kinds of mass integration prob-lems (fixed flow rate and fixed pollution load). This problem is tackled by mathematical programming problems with mostly economic or environmental objective functions. The main differences lay in the problem definition and the modeling of the objectives. There are two types of definition that can be incorporated within the same problem: direct inter-plant integration where plants exchanges water stream directly between them and indirect inter-plant network where mass streams can go through regeneration units before being distributed [24].
Early studies based their methodologies on graphical approaches [47,88,89,107] but their limitation to single contaminant problem and the need to get and optimize the EIP design had led towards mathematical optimization techniques. Intermediate procedure were developed such as the one proposed by Chew et al. [22] where they used a graphical approach coupled with mathematical programming. In this study, an automated pro-duced allows targeting minimum fresh water flow rate, followed by a linear programming approach to design a detailed water network.
Chew et al. [24] introduced the concepts of direct versus indirect inter-plant water integration. The indirect integration allows the use of intermediate entities which were either a storage tank or a regeneration unit (or both). Depending on the selected strat-egy (direct or indirect integration), the formulation of the model was an MILP (direct integration) or an MINLP (indirect integration). The objective was to minimize the fresh water consumption. Lovelady et al. [78] proposed to add an intermediate layer where several interception units could be used to modify the composition of streams prior to being allocated to EIP sinks. The objective function was the total annualized cost which included the use of interception units. Based on a similar problem, Rubio-Castro et al. [99] developed an MINLP model that included the possibility of retrofitting existing inner and outer water networks from multiple plants and designing a shared water treatment plant. Boix et al. [16] introduced a multi-objective model in which the fresh water, regenerated water flow rates and the number of connections are minimized reducing optimizing the operating costs related to water consumption and the complexity of the water network.
is a Pareto front in which a lot of optimal solutions are available from which depending on various and different criteria a solution can be selected. Alnouri et al. [5] proposed an optimization approach to design water networks within industrial cities testing centralized or decentralized strategies for the placement of water treatment interceptors. One of the interesting innovations of the developed MINLP model is that it took into account in its formulation the design of the piping across sites locations and the installation constraints based on the industrial city layout.
In the last decade, approaches based on game theory were developed to select an optimal solution for direct integration schemes [23]. Chew et al. [25] generated several network structures with pinch techniques which were then analyzed and selected using a game theory approach depending on the strategy (cooperative versus non-cooperative) on which the EIP was to be built. Ramos et al. [96] developed a very promising approach to synthesize a water nexus in an EIP solving a multi-leader-follower problem. Base on game theory, the model is formulated as a Nash game where an EIP authority is looking to minimizing the EIP freshwater consumption and each company participating in the EIP wants to minimize its total annualized cost. With this formulation, they were able to conclude that the solution found represents most of the times an equilibrium satisfying fairly all involved partners.
1.3.3 Coupled Heat/Mass Integration
Furthermore, in reality, mass and heat integration must be considered at once because every operation within the process requires matter and energy to accomplish the defined tasks. Matter is used to transport energy. Energy is used to transform and produce matter. Therefore, considering the energy aspect of waste streams reuse can improve substantially the relevance of it. The inlet and outlet of every process unit are characterized by a temperature. Therefore, mass streams connecting two units are considered either hot or cold. Reusing or recycling waste streams imply to choose which flow rate each mass stream will have; therefore, it also implies to define the heat load it will transport or will need. Thus, heat exchanges can occur between them in the same way described for a heat integration problem.
Efficient management of raw materials is essential to improve economic and environ-mental performances of industrial processes. Waste effluents can be considered as mass and energy resources; therefore, finding ways to reuse or recycle them may allow reducing operating costs and complying more easily with strict environmental regulations. However, those solutions may imply additional capital expenditures. Thus, an economic optimum must be found considering reducing energy and resources consumption, waste generation and extra capital costs related to mass and heat recovery. So, over the last decade, the focus has been primarily on creating methodologies to tackle the problem of Mass Allo-cation Network (MAN) and Heat Exchangers Network (HEN) designs. Several
methods and models can be found to tackle this coupled integration problem. They can be sorted into two main categories: Graphical approaches and Mathematical pro-gramming models.
1.3.3.1 Graphical approaches
From the fixed load problem definition, many works have looked to optimize both fresh wa-ter and the energy consumptions. Savulescu et al. [105] developed an approach to simplify the HEN design of already designed water networks using their ability to mix and split. Based on the analysis of the classical composite curves, a temperature versus flow rate diagram called “source–demand energy composite curves” is built. This diagram presents the surplus or deficit of each source with respect to the demands. Therefore, multiple mixing scenarios can be tested resulting in a new HEN design. Building upon this work, Savulescu et al. [103,104] presented the “two dimensional grid diagram” allows to find a water network design that minimizes the use of water and energy before designing the HEN. In a similar approach, Martínez-Patiño et al. [81,82] introduced “temperature versus concentration diagram” and sequentially synthesizes water networks and direct and indi-rect heat exchange networks. Hou et al. [58] introduced Temperature and Concentration Order Composite Curves (TCOCC) which is employed to guide the design of appropriate water networks for heat recovery.
For the fixed flow rate problem, source-demand energy composite curves [80,115] or Modified Problem Table Algorithm [9] have been introduced.
Graphical approaches are used to give useful insight on performances that can be ex-pected of the process in the best case scenario. These techniques have the main advantage to give quick insights but they are limited to single contaminant and small sized problems. Moreover, the resulting design are not economically optimal. That is why mathematical optimization techniques have been developed to tackle such problems and obtain more relevant designs.
1.3.3.2 Mathematical approaches
Mathematical programming techniques are used to tackle more complex problems in a more systematic way. Any physical problem is decomposed into a set of equations that describes the constraints that characteristic variables of the studied system are subjected to. Interesting features of the system are selected and included in an objective function that is optimized. There are several mathematical techniques; but most of them can be classified along one defining feature: Linear or Non-linear.
Linear Programming (LP) model are described by a set of linear equations and a lin-ear objective function. If some variables are integer the model is called Mixed Integer
![Figure 1.1: World population since the Industrial Revolution and its possible variations [ 113 ]](https://thumb-eu.123doks.com/thumbv2/123doknet/2566918.55924/21.892.214.661.313.597/figure-world-population-industrial-revolution-possible-variations.webp)
![Figure 1.7: Projection of world’s final energy consumption by fuel by 2040 ( ×10 15 Btu) [ 30 ]](https://thumb-eu.123doks.com/thumbv2/123doknet/2566918.55924/24.892.201.698.795.1022/figure-projection-world-final-energy-consumption-fuel-btu.webp)
![Figure 1.8: Technical solutions to limit CO 2 emissions and their potential [ 37 ]](https://thumb-eu.123doks.com/thumbv2/123doknet/2566918.55924/25.892.130.767.342.754/figure-technical-solutions-limit-emissions-potential.webp)