Financing the Consumption
of the Young and Old
in France
HIPPOLYTE D’ALBIS
CAROLEBONNET XAVIERCHOJNICKI NAJATELMEKKAOUI ANGELAGREULICH JÉRÔME HUBERT JULIENNAVAUX
Introduction
A BETTER UNDERSTANDING of the resource allocation across ages is fun-damental to put in place welfare reforms in the context of population age-ing. In times of major demographic change, the redistribution of resources between age groups and the funding of the economically inactive aged re-mains a recurring topic of public debate and a major public policy concern in OECD countries. Governments search for a policy mix that will improve the quality of life of the elderly, while at the same time investing in the future of the young and reducing the fiscal burden on the working population. Life expectancy and education requirements are increasing while budget constraints are tightening. This potentially creates tension in the allocation of resources between age groups (Preston 1984; Lee and Mason 2011a). Some authors have shown the negative impact that a growing share of el-derly could have on education spending for the young (Poterba 1997, 1998; Harris et al. 2001). The compact between the generations could suffer as a result (United Nations 2013a; Chen et al. 2018).
With their contribution to the financing of consumption by the young and the elderly, governments influence the distribution of resources be-tween generations. Policy action in this field therefore plays a crucial role for intergenerational equity. However, the family also plays a major role in intergenerational transfers. Consumption expenditure that is not covered by the State and the family is financed by the individuals themselves. In most developed countries, responsibilities between the State, individuals, and the family are shared but the weighting is quite different across coun-tries, and weights have varied significantly over time within countries. How
the funding of private and public consumption at different ages is shared be-tween the State, individuals, and the family reveals the relative importance of these institutions in a society.
By applying the methodology of National Transfer Accounts (NTA), this article analyzes for France (1) how the funding of consumption (public and private) is secured at each age; (2) how the funding of consumption has changed over recent decades; and (3) how the consumption is financed compared to that of other countries (China, Germany, Japan, Sweden, United Kingdom, and United States). We consider three sources for financ-ing consumption: the State (net transfers and in-kind services), individuals themselves (income and assets), and families (inter vivos transfers, excluding bequests, following the NTA methodology) (United Nations 2013b).
To do so, we have built a database that includes age-profiles for 87 variables from the French National Accounts, covering the period 1979– 2011. This unique database contains 281,184 observations. Data on total consumption and on funding of the individual, the State, and the family is
made available on the French NTA website.1
Our work adds to other country-specific studies that have already used the NTA method for analyzing how consumption is funded at
differ-ent ages.2Studies that have used the NTA method for developed countries
converge in finding that over the last three decades the general level of consumption, which is a standard indicator of welfare, has continuously increased across all ages, while at different rates.3 With our analysis of the contribution of the State, the family, and the individual to the financing of private and public consumption by age, we contribute to addressing the question whether governments reinforce or counterbalance generational inequalities in consumption.
Our analysis of the different sources of funding reveals that, while con-sumption increases were more important for the elderly than for the young over the 1979–2011 period in France, the elderly were not favored by the State. The consumption of the elderly did not result from a larger share in public transfers; rather, the elderly were more autonomous and increas-ingly financed their consumption by their own means. On the other hand, the consumption of the young was increasingly funded by public means, especially for two age groups: the very young, who received more generous family benefits; and those aged 18–24, who benefited from higher public investment in education. Longer educational enrollment thus reduced the relative private consumption of the young but increased their relative public consumption. Besides, the young increasingly benefit not only from pub-lic financing, but also from family transfers, while the elderly increasingly finance themselves.
Our international comparison reveals that public funding of the elderly remained significant in France. Nevertheless, this was not at the expense of the young. Even if the Baby Boom cohorts in France may increasingly
HI P P O L Y T ED’AL B I S E T A L. 105
put pressure on public budgets due to their high numbers and increasing life expectancy, public per capita expenditure for the elderly has kept pace with that for younger individuals, while elderly consumption levels have increased.
Measuring intergenerational transfers
with NTA
Context
The first researchers who incorporated demographic change (changes in population size and age structure) into macroeconomic modelling were Allais (1947) and Samuelson (1958). They pioneered the overlapping generations model (OLG), where the economy is seen through the lens of several generations, making it possible to take into account intergenera-tional transfers. Diamond (1965) then incorporated capital into the model and concluded that public and intergenerational transfers may increase welfare and contribute to consumption optimality. This approach was complemented by the life-cycle theory of Modigliani and Brumberg (1954) who argued that individual savings influence national savings and enable exchanges between generations. Lee (1980, 1994) then developed a more comprehensive life-cycle model which includes aggregate consumption, savings, transfers, and government debt while accounting for birth and survival rates. On the empirical side, the method of generational account-ing was developed first by Auerbach et al. (1992). To assess fiscal policy’s redistributive and savings effects on each generation’s financial receipts and obligations, the method incorporates generations’ present expected value of lifetime net payments to the government into public deficit, debt, and fiscal policy. The generational accounting method initially focused on public transfers, leaving out an important aspect of intergenerational transfers resulting from the family (Masson 2002) and the eventual inter-actions between these and public transfers. To overcome this, the allocation of economic resources between ages must be quantified in a unified and comprehensive manner. The NTA method meets this challenge and was successively applied to build Full Generational Accounts that incorporate private transfers (Lee et al. 2017). Another limit in generational accounting is its static approach, which implies that individual reactions to changes in fiscal policy, for example in terms of labor supply and savings, cannot be ob-served (Haveman 1994). Developing NTA over a long period of time should thus help to estimate present expected values of lifetime net payments with-out relying on necessarily sensitive assumptions. Finally, the generational accounting method does not say much on welfare (Kotlikoff 1995; Diamond 1996). We believe that the simple measure of living standard that is given by consumption can nevertheless be understood as a first approximation
of aggregate welfare, supposing that private and public consumption are perfect substitutes.
The aim of the NTA method is to disaggregate income, consumption, and savings by age and therefore to take into account intergenerational transfers made by the State or the family (Mason et al. 2009; Lee and Mason 2011b). NTA is today a well-established empirical tool for understanding the generational economy, with harmonized data available for just under 50 countries (United Nations 2013b).
The NTA method
The NTA method is based on an accounting equation whereby private and public resources and consumption are set equal. An individual’s resources, income from labor and capital plus public and private transfer inflows must be equal to the use made of them, whether for consuming, saving, or mak-ing public and private transfers. Consumption and production levels are then calculated for each age, both individually and in aggregate. Transfers between ages reallocate the wealth produced during the active ages so that individuals can consume at various times in their lives. There are ages when they consume but do not produce—childhood and retirement—and other ages when they produce significantly more than they consume: adulthood.
More specifically, NTA is based on an age-specific flow identity cap-turing economic flows at each point in time. Variables are indexed by (a), which denotes the age of an individual. This flow identity is similar to a budget constraint for individuals of age a, as seen in life-cycle models. It can be written as follows by traditionally grouping the inflows (left-hand side of the equation) and the outflows (right-hand side):
YL(a)+ YK(a)+ TG+(a)+ TF+(a)= C(a) + S(a) + TG−(a)+ TF−(a) (1) where YLis the value of labor income inflow received for age (or age group) a, YKis the asset income inflow (that includes net property incomes), TGis the flow of public transfers, received as denoted by (+) and spent as de-noted by (−), TF is the flow of family transfers also received and spent, C is consumption and, finally, S stands for savings resulting as the residual left between the various types of income net of consumption. These variables capture at the same time flows that are domestic and international.
The life-cycle deficit is a key concept of the generational economy. It is the difference between consumption and labor income for every relevant age (or age group), where consumption includes households’ public and private consumption of various goods and services, including public and private education and healthcare for example, and where labor income in-cludes employees’ earnings with fringe benefits, as well as self-employment and unpaid family workers’ incomes. The flow identity, given by
HI P P O L Y T ED’AL B I S E T A L. 107
equation (1), can thus be re-arranged to reveal how the economic life-cycle deficit (or surplus) is funded by (or distributed through) asset-based reallo-cations (i.e. asset incomes minus savings) and net transfers:
C(a)− YL(a)= YK(a)− S(a) + TG+(a)− TG−(a)+ TF+(a)− TF−(a) (2) In this article, we have decomposed consumption according to our three main sources of funding, namely the individual, the State, and the family. To do so, we have split savings into public savings, denoted SG, and private savings, denoted SF. We also have split asset income into public asset income, YKG, and private asset income, YKF. We obtain:
C(a)= [YL(a)+ YKF(a)− SF(a)]+ [TG+(a)− TG−(a)+ YKG(a)
− SG(a)]+ [TF+(a)− TF−(a)] (3)
The first term refers to individual funding, (labor and capital income minus private savings), the second to State funding (net payments by the State), and the third to net family transfers.
Construction of aggregates and individual profiles by age
The profiles by age are constructed so as to be consistent with National Accounts (NA). Aggregates are constructed in two steps: First, we construct various mean profiles by age and smooth them. Second, we fit these pro-files to the corresponding NA aggregates (d’Albis et al. 2015). Appendix A (online) provides more details on the method applied to construct of aggre-gates and shows numbers of the aggreaggre-gates (public transfers, labor income, private assets, etc.) in France from 1979 to 2001.
The NTA method is based on constructing individual profiles of the financing of consumption by age from survey questionnaires and public statistical data. Appendix B (online) provides an overview of the differ-ent French data sources we used to construct the individual age-specific profiles.
The age profiles of public transfer in-kind inflows were presented in detail in recent work on the life-cycle deficit (d’Albis et al. 2015). Most age profiles for public transfer cash inflows are known at the individual level from family budget surveys (unemployment benefits, retirement payments, etc.).4
One exception is family benefits, which are only known at the house-hold level. Taxes, employees’ contributions and employers’ contributions are also mostly observed at the household level in the surveys. This is also the case for asset income as well as private transfer inflows and outflows between households. For these inflows and outflows that are observed at the household level, consistent allocation keys had to be found in order to individualize them within households. Appendix C (online) provides more
information about the particular allocation keys we developed in order to obtain individual age-specific profiles for these items which are only ob-served on a household basis in the French surveys.
Income from public assets and public savings are allocated according to the profiles of compulsory contributions, using the NTA Manual method-ology (United Nations 2013b).
The labor income profiles by age are determined from household survey data that include information on individual salaries. The age pro-file for salaries is obtained by calculating for each age the mean salary of all survey respondents of that age, with the salaries of non-working respondents set at zero.5 A similar methodology is applied for employers’ social contributions and the income of the self-employed. Intra-household transfers to fund consumption and per capita savings are calculated from individual bases using all the previously calculated variables. Ap-pendix D (online) details the method for calculating intra-household cash transfers.
Funding of consumption at each age: the role
of the State, the family, and the individual
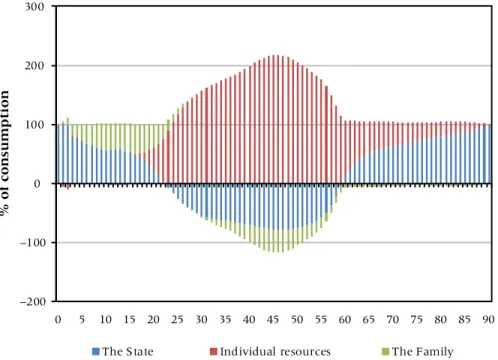
The left column of Figure 1 shows the three funding sources (the State, the family, and the individual) of per capita consumption provided at each age. These are net values, which correspond to inflows received by the individual minus outflows paid by the individual. To ease the comparisons over the period considered, the per capita value of each component is divided by the per capita labor income of individuals aged 30–49.6
The right column of Figure 1 shows the aggregate values of the three components in constant 2011 euros (€), which are thus the product of the individual profiles and the population age distribution. The different years (1979–2011) correspond to the different waves of the “Budget de familles” surveys that we used to compile these data.
The main trend we observe is a shift to the right between 1979 and 2011 for the individual funding of consumption (labor- and asset-based in-come), which can be seen both in the left and the right column. This trend can be explained by two phenomena:
The first concerns the narrowing of the working-age period under the double effect of postponing of age of entry into the labor market and the di-minishing age of exit. Over the period, the age of entry into the labor market increased with the rise of educational attainment7and the increasing diffi-culties of non-educated young people to enter the labor market: between 1975 and 2015, the unemployment rate of individuals aged 20–24 years in-creased fourfold in France. The retirement age dein-creased in the beginning of the observed period, especially following the 1982 reform that allowed for a decrease in the normal retirement age from 65 to 60. However, since
FIGURE 1 F unding sources for consumption—France 1979–2011
FIGURE
FIGURE 1 (continued) SOURCES: French H ousehold Expenditure Survey (Enquête Budget de Famille ), French W ealth S urvey (Enquête Patrimoine) , F rench F inancial Asset Survey (Enquête Actifs Financiers ), French Health and Social Protection Survey (Enquête santé et protection sociale, ESPS ), permanent sample of people insured under the state health insurance scheme (Échantillon P ermanent d ’Assurés Sociaux, EP AS ), 2008 French H ousehold Disability and Health S urvey (Enquête Drees Handicap Santé Ménage ) and 2009 French Institutions Disability and Health S urvey (Enquête Drees Handicap Santé Institutions) , National Accounts. Calculations by the authors.
the mid-1990s, different reforms were implemented in France to ensure the long-term sustainability of the pension system. In particular, the required contribution period to receive a full pension regularly increased over the period, inducing a postponement of retirement age.
The second concerns the shift to the right of the modal age of the pro-file of individual funding of consumption by age. This change can mostly be explained by a change in the labor income profiles (d’Albis et al. 2017). However, private asset income net of private savings also plays an increas-ingly important role in France, especially after age 60, where it represented 64 percent of the individual source of funding in 2011.
Increasing per capita income combined with the demographic weight of Baby Boomers resulted in a strong effect on the aggregate values of indi-vidual funding of consumption by age, as illustrated in the right column of Figure 1. Baby Boomers generated high amounts of resources which were transferred directly to non-working age groups or indirectly through the public transfer system. In 1995, the Baby Boomer cohorts born between 1945 and 1965 constituted the heart of the working age population. At this time, among the age groups that generated net transfers (for which the flow of transfers spent is higher than the flow of transfers received), the Baby Boomers generated 75 percent of the public transfers and 72 percent of the private transfers to the non-working age groups. However, the first baby boom generations are now starting to retire and they are now contributing less to the transfer system.
The young benefited the most from the significant private transfers made by individuals of working age. However, when it comes to State funding of consumption, the per capita net public transfers over the ob-served years did not only increase for the young, but also for the elderly. In 1979, net public transfers of individuals aged 0–24 accounted only for 14 percent of the labor income earned by individuals aged 30–49, while in 2011, they reached 22 percent.8 For the elderly, we observe also a net up-ward flow of public resources from 1979 to 2011. In 2011, the average net public transfers of individuals aged 60+ represented 42 percent of the labor income earned by individuals aged 30–49, whereas it accounted for only 34 percent in 1979. The effect is even stronger for individuals aged 75+. The indicator for this age group was 42 percent in 1979 and reached 56 percent in 2011.
We can conclude that the increase of public transfers to the elderly did not occur at the expense of the young in France, but rather that both age groups benefited from more and more generous State funding. The young also benefited from increasing family transfers, which come especially from the groups at working age: while the elderly generate less and less private transfers to the young, the working age population increase their private transfers to the young over the years.
HI P P O L Y T ED’AL B I S E T A L. 113 TABLE 1 First and last age for which individual resources (labor income and asset income) are higher than total consumption
1979 1984 1989 1995 2000 2005 2011 First age to which C(a)< (YL(a)+ YK(a)− S(a)) 22 23 23 25 24 24 24
Last age to which C(a)< (YL(a)+ YK(a)− S(a)) 59 57 59 59 59 59 59 SOURCES: French Household Expenditure Survey (Enquête Budget de Famille), French Wealth Survey (Enquête Patrimoine), French Financial Asset Survey (Enquête Actifs Financiers), French Health and Social Protection Survey (Enquête santé et protection sociale, ESPS), permanent sample of people insured under the state health insurance scheme (Échantillon Permanent d’Assurés Sociaux, EPAS), 2008 French Household Disability and Health Survey (Enquête Drees Handicap Santé Ménage) and 2009 French Institutions Disability and Health Survey (Enquête Drees Handicap Santé Institutions), National Accounts. Calculations by the authors.
Funding the consumption of inactive
age groups
The relative weight of individual funding, State funding, and family funding of consumption can be measured separately for the periods of economic in-activity during youth and old age. The 0–24 and 60+ age groups have been used for the two periods outside working age for every year from 1979 to 2011. These ages correspond to the earliest and latest ages when individual funding is greater than total consumption (since the year 2000, see Table 1). Young individuals are less independent
in financial terms
Figure 2 shows that in 2011, the State’s role in funding consumption during youth (ages 0–24) gradually decreased with age, while private transfers increased between ages 0 and 16, and individual funding commenced between ages 16 and 24. In 2011, public transfers declined with age from
93 percent of consumption at birth to −18 percent at age 24. Private
transfers rose from 1 percent at birth to 50 percent at age 16 and then fell continuously until age 24. Individual funding was 3 percent at age 16 and 105 percent at age 24.
Figure 3 shows that the main change in the financing of young peo-ple’s consumption between 1979 and 2011 was an increase in the State’s contribution and a decrease in individual funding. In the 1979–1995 period in particular, there was a significant reduction in individual funding, from 38 percent to 19 percent, and a steady increase in State funding from 32 per-cent to 45 perper-cent. In 1979 and 1984, the financing of young people’s con-sumption was relatively evenly balanced between the State, the individual, and private transfers. The State supported 32 percent of this consumption in 1979 and 36 percent in 1984, the individual 38 percent and 34 percent, and private transfers 30 percent in both years. Subsequently, the State share rose and the individual’s share fell.9In 2011, the State funded 45 percent of young people’s consumption, the individual 19 percent, and private trans-fers 36 percent (34 percent transtrans-fers within households, from parents to children, and 2 percent transfers between households). The increase in the
FIGURE 2 Funding sources of consumption—France, 2011
SOURCES: French Household Expenditure Survey (Enquête Budget de Famille), French Wealth Survey (Enquête Patrimoine), French Financial Asset Survey (Enquête Actifs Financiers), French Health and Social Protection Survey (Enquête santé et protection sociale, ESPS), permanent sample of people insured under the state health insurance scheme (Échantillon Permanent d’Assurés Sociaux, EPAS), 2008 French Household Disability and Health Survey (Enquête Drees Handicap Santé Ménage) and 2009 French Institutions Disability and Health Survey (Enquête Drees Handicap Santé Institutions), National Accounts. Calculations by the authors.
percentage of State-financed consumption of the young between 1979 and 2011 is mainly due to the rise in school enrollment and higher education expenditure per capita, reflecting the government’s investment in human capital, but it is also due to the increase in family benefits and a decrease in taxes paid by youth. In 2011, education accounted for 37.4 percent of pub-lic transfers received by individuals from the government. In-kind transfers allocated equally across ages accounted for 27.7 percent of public trans-fer inflows and finally, family benefits accounted for 19.5 percent of public transfer inflows for the age group 0–24.
The increase in the State’s share of funding young people’s con-sumption is most striking for the infant 0–3 age group. For these chil-dren, the State’s share rose between 1979 and 2011 from 56.3 percent to 91.8 percent, while private transfers fell from 27.5 percent to a mere 9.1 per-cent. This increase in public transfers is mainly due to family benefits, which rose from 24 percent of infant consumption in 1979 to 50.8 percent in 2011.10This increase reflects a generous family policy,11the effects of which are recognized for maintaining fertility at one of the highest levels in Eu-rope (around replacement level) while enabling women to remain in the labor market (Luci-Greulich and Thévenon 2013).
HI P P O L Y T ED’AL B I S E T A L. 115 FIGURE 3 Funding sources for consumption before the age of 25—France, 1979–2011
SOURCES: French Household Expenditure Survey (Enquête Budget de Famille), French Wealth Survey (Enquête Patrimoine), French Financial Asset Survey (Enquête Actifs Financiers), French Health and Social Protection Survey (Enquête santé et protection sociale, ESPS), permanent sample of people insured under the state health insurance scheme (Échantillon Permanent d’Assurés Sociaux, EPAS), 2008 French Household Disability and Health Survey (Enquête Drees Handicap Santé Ménage) and 2009 French Institutions Disability and Health Survey (Enquête Drees Handicap Santé Institutions), National Accounts. Calculations by the authors.
This increase in public funding of 0 to 3 year-old children does not, however, lead to the same extent to an increase in total consumption of children aged 0–3. Certainly, the value of family benefits increased steadily
over the period from€5,283 in 1979 to €17,583 in 2011 (constant 2011 €),
with an average annual increase of 3.8 percent over the observed 32 years. However, the consumption of children aged 0–3 has only increased from €21,990 to €34,615 (constant 2011 €) over the period, which represents an average annual increase of only 1.4 percent, as family benefits have crowded out private family transfers after 2000. Indeed, private transfers for children aged 0–3 decreased by 2 percent annually over the period from €6,054 in 1979 to €3,156 in 2011 (they actually increased by 0.6 percent annually between 1979 and 2000, but decreased by 6.7 percent annually between 2000 and 2011).
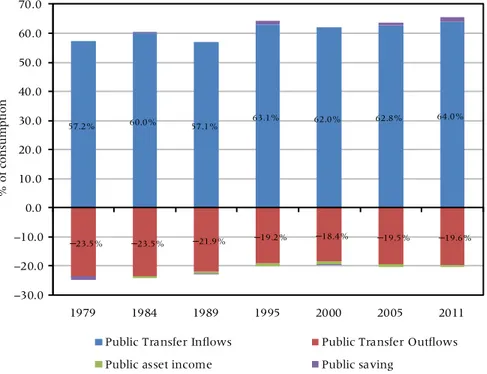
According to the NTA decomposition, State funding consists of pub-lic transfer inflows and outflows, and pubpub-lic asset-based reallocation, made up of income from public assets and public savings. The increase in the
FIGURE 4 Sources of public funding for consumption before the age of 25—France, 1979–2011
SOURCES: French Household Expenditure Survey (Enquête Budget de Famille), French Wealth Survey (Enquête Patrimoine), French Financial Asset Survey (Enquête Actifs Financiers), French Health and Social Protection Survey (Enquête santé et protection sociale, ESPS), permanent sample of people insured under the state health insurance scheme (Échantillon Permanent d’Assurés Sociaux, EPAS), 2008 French Household Disability and Health Survey (Enquête Drees Handicap Santé Ménage) and 2009 French Institutions Disability and Health Survey (Enquête Drees Handicap Santé Institutions), National Accounts. Calculations by the authors.
State’s share of the funding of young people’s consumption is associated with changes in both public transfer inflows and outflows, as we observe a steady increase from 1979 to 2011 in the share of public transfer inflows and at the same time a decrease in public transfer outflows (Figure 4). Public transfer inflows rose from 57.2 percent of the consumption of this age group in 1979 to 64 percent in 2011. Public transfer outflows fell from−23.5 per-cent in 1979 to−19.2 percent in 1995 and then flattened out until 2011. Greater financial independence for the elderly
Similar to what we have seen for young people, the financing of elderly con-sumption depends also mainly on the State in France. While modest at age 60, State funding steadily increases to become the dominant source of con-sumption financing after age 65 (Figure 2). In 2011, 61 percent of consump-tion of individuals aged 60+ was covered by the State and 44 percent by the individuals themselves (Figure 5). Individuals aged 60+ consequently funded younger cohorts with 5 percent of their income (private transfers:
HI P P O L Y T ED’AL B I S E T A L. 117 FIGURE 5 Funding sources for consumption for ages 60+—France, 1979–2011
SOURCES: French Household Expenditure Survey (Enquête Budget de Famille), French Wealth Survey (Enquête Patrimoine), French Financial Asset Survey (Enquête Actifs Financiers), French Health and Social Protection Survey (Enquête santé et protection sociale, ESPS), permanent sample of people insured under the state health insurance scheme (Échantillon Permanent d’Assurés Sociaux, EPAS), 2008 French Household Disability and Health Survey (Enquête Drees Handicap Santé Ménage) and 2009 French Institutions Disability and Health Survey (Enquête Drees Handicap Santé Institutions), National Accounts. Calculations by the authors. −5 percent). State funding came mostly in the form of old-age pensions, which accounted for 63.2 percent of public transfer inflows, and healthcare,
which accounted for 16.9 percent in 2011. Elder care12 represented, with
1.3 percent of public transfer inflows, a relatively small proportion (2.5 per-cent after age 75). The role of old-age pensions is increasing with age. At age 60, gross public pensions (before tax deductions) accounted for 41 per-cent of the funding of total elderly consumption in 2011. They accounted for 70 percent at age 75 and for 74 percent at age 90. Public health consumption is also increasing with age: it accounted for 12 percent of total consumption at age 60, 20 percent at age 75, and 26 percent at age 90 in 2011.
However, Figure 5 also shows that unlike for the young, the share of public transfers in the financing of consumption for individuals aged 60+ fell from 1984 to 2011 from 71 percent to 61 percent (while it had risen slightly from 1979 to 1984 from 68 percent to 71 percent). The continuous fall of State-financed consumption between 1984 and 2011 was compen-sated by a rise in individual financing of consumption. Although individual funding initially fell from 45 percent to 37 percent between 1979 and 1989, it rose from 38 percent in 1995 to 44 percent in 2011.
Figure 5 further shows that the contribution of family transfers to the consumption of 60+ year-olds was negative for the entire study period. On average, the private transfers of the elderly contribute slightly to the consumption of younger cohorts (youth and adults), which means that the consumption of individuals aged 60+ is not funded by private transfers from younger cohorts. However, Figure 5 also reveals a reduction in the share of net private transfers in the financing of consumption for the
observed period, from−12 percent in 1979 to −5 percent in 2011. Private
transfers consist of transfers within and between households. A breakdown of private transfers in the two components shows that the reduction in the share of net private transfers in consumption for individuals aged 60+ is explained by a reduction in both within- and between-household private transfers. The share in consumption of net transfers between households decreased continuously from 1979 (−7 percent) to 2000 (−2 percent), but remained relatively constant thereafter. The share in consumption of net transfers within households decreased from 1979 (−6 percent) to 1989 (−1 percent) and remained relatively constant thereafter. One explanation may be the decrease of net transfers from husbands aged 60+ to their spouses aged 59 or less due to the increased financial independence of women.13
The increase in the share of individual financing of the consumption of those aged 60 and over, illustrated in Figure 5, is largely due to increasing private asset income net of private savings. This income rose sharply as a proportion of individual funding from 1979 to 2005 (Figure 6). It went from 32 percent in 1979 to 72 percent in 2005, and then fell back to 64 percent in 2011. The increased share of net income from savings is mainly due to a steady increase in asset-based income from 1979 to 2000.
Figure 7 shows the evolution of the share of the State, the individual, and the family in the funding of consumption of the elderly over time, for the age groups 60–64, 65–69, 70–74, 75–79, and 80+.
The reduction in the share of public transfers in the funding of con-sumption affected all the older age groups fairly evenly. Along with this reduction, funding from labor income also fell from 1979 to 1984 for the 60–64 group and from 1979 to the early 2000s for those over 65. We also note a slight increase in funding from labor income in the early 2000s for both groups, the result of successive reforms of the retirement pension sys-tem by the Balladur government in 1993 and the Raffarin government in 2003. The increase in the share of private asset-based reallocation (private asset income net of private savings) involves the age groups from ages 60 to 79 in a similar manner, except for the 60–64 age group at the start of the period, when the older groups were catching up from 1979 to 1989. The share of private asset-based reallocation for the 60–64 group rose from 1 percent in 1979 to 27 percent in 2011, whereas that of private asset-based reallocation for the 65–69 group rose from 15 percent in 1979 to 39 percent
HI P P O L Y T ED’AL B I S E T A L. 119 FIGURE 6 Sources of individual resources ages 60+—France, 1979–2011
SOURCES: French Household Expenditure Survey (Enquête Budget de Famille), French Wealth Survey (Enquête Patrimoine), French Financial Asset Survey (Enquête Actifs Financiers), French Health and Social Protection Survey (Enquête santé et protection sociale, ESPS), permanent sample of people insured under the state health insurance scheme (Échantillon Permanent d’Assurés Sociaux, EPAS), 2008 French Household Disability and Health Survey (Enquête Drees Handicap Santé Ménage) and 2009 French Institutions Disability and Health Survey (Enquête Drees Handicap Santé Institutions), National Accounts. Calculations by the authors.
in 2011. Public asset-based reallocation only accounts for a very small share of total consumption in France.14
In terms of intergenerational comparisions, d’Albis and Navaux (2016) computed the per capita amounts of public transfers received by individuals
aged 60+ and compared them to the ones received by individuals aged 25–
59. They showed that individuals aged 60+ received 3.2 times more public transfers than indivduals aged 25–59 in 1979. This ratio remained remark-ably stable over 32 years as in 2011, individuals aged 60+ received 3.1 times more public transfer inflows than individuals aged 25–59. The authors also showed that the increasing aggregate share of public transfer inflows re-ceived by individuals aged 60+ between 1979 and 2011 (which increased from 35.7 percent to 44.9 percent of total public transfer inflows) was en-tirely due to the change in the age structure of the population. Hence, the increase of relative per capita consumption of the elderly has been financed by individual resources rather than public transfers from other age groups. Similarly, we now compute the shares of our three different sources of funding for the different time periods for the two age groups
FIGURE 7 S hare of each funding source in total c onsumption for ages 60 + —France,
FIGURE
7
FIGURE 7 (continued)
SOURCES: French Household Expenditure Survey (Enquête Budget de Famille), French Wealth Survey (Enquête Patrimoine), French Financial Asset Survey (Enquête Actifs Financiers), French Health and Social Protection Survey (Enquête santé et protection sociale, ESPS), permanent sample of people insured under the state health insurance scheme (Échantillon Permanent d’Assurés Sociaux, EPAS), 2008 French Household Disability and Health Survey (Enquête Drees Handicap Santé Ménage) and 2009 French Institutions Disability and Health Survey (Enquête Drees Handicap Santé Institutions), National Accounts. Calculations by the authors.
(25 to 59, 60+), this time by supposing that the profiles by age (consump-tion, income, savings etc.) do not change over time but only the age struc-ture does. We find that with this calculation, the funding shares almost do not change over time for both age groups. We derive from this result that the changes over time in the shares of the State, the individual and the familiy in the funding of consumption by age, which were illustrated in Figures 3 and 5, are thus not caused by demographic changes. Our finding that in France, the young got increasingly dependent and the elderly got increasingly independent in financial terms over the period 1979 to 2011, is therefore due to changes in individual behavior rather than changes in the age structure of the population.
International comparison
Internationally, France is distinctive in its financing of consumption of young and old. Compared with six other members of the NTA project (China, Germany, Japan, Sweden, United Kingdom, and the United States), France is the country where the young benefited most from public
transfers.15 In 2005, the French State funded 43 percent of the
consump-tion of the 0–24 age group, well ahead of Sweden, which came second with 38 percent (Figure 8). The United States came third with 36 percent, followed closely by Japan with 35 percent. China came last in the panel with only 15 percent. France is the only one of the seven countries where
HI P P O L Y T ED’AL B I S E T A L. 123 FIGURE 8 Funding sources of consumption before age 25—cross-country comparison
SOURCES: French Household Expenditure Survey (Enquête Budget de Famille), French Wealth Survey (Enquête Patrimoine), French Financial Asset Survey (Enquête Actifs Financiers), French Health and Social Protection Survey (Enquête santé et protection sociale, ESPS), permanent sample of people insured under the state health insurance scheme (Échantillon Permanent d’Assurés Sociaux, EPAS), 2008 French Household Disability and Health Survey (Enquête Drees Handicap Santé Ménage) and 2009 French Institutions Disability and Health Survey (Enquête Drees Handicap Santé Institutions), National Accounts. Calculations by the authors; for the other countries,
international data from the National Transfer Accounts.
the State’s share of funding is the largest of the three sources. In the other countries, private transfers are largest for the young, particularly in China where private spending on education is very important and private transfers finance 65 percent of the consumption of the 0–24 age group.
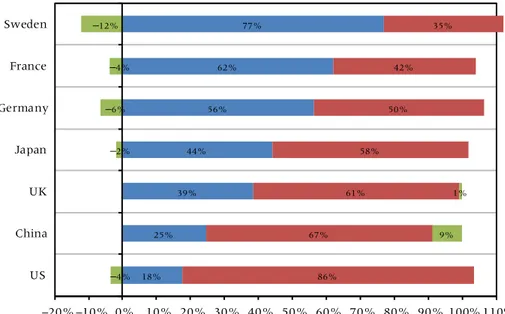
The funding of elderly consumption depends mostly on the State in the three continental European countries. Seventy-seven percent is funded by the State in Sweden, 62 percent in France and 56 percent in Germany (Figure 9). The rest is individually funded, namely 50 percent in Germany, 42 percent in France, and 35 percent in Sweden. All three countries display downward private transfers, much higher in Sweden (−12 percent) than
in Germany (−6 percent) and France (−4 percent). In all the other panel
countries, individual financing is the largest component of elderly consump-tion: 86 percent in the United States, 67 percent in China, 61 percent in the United Kingdom, and 58 percent in Japan. Like the continental European countries, the United States and Japan have downward private transfers, and only China has significant upward private transfers (9 percent) to fund
FIGURE 9 Funding sources of consumption for ages 60+—cross-country comparison
SOURCES: French Household Expenditure Survey (Enquête Budget de Famille), French Wealth Survey (Enquête Patrimoine), French Financial Asset Survey (Enquête Actifs Financiers), French Health and Social Protection Survey (Enquête santé et protection sociale, ESPS), permanent sample of people insured under the state health insurance scheme (Échantillon Permanent d’Assurés Sociaux, EPAS), 2008 French Household Disability and Health Survey (Enquête Drees Handicap Santé Ménage) and 2009 French Institutions Disability and Health Survey (Enquête Drees Handicap Santé Institutions), National Accounts. Calculations by the authors; for the other countries,
international data from the National Transfer Accounts.
the consumption of the elderly. In the United Kingdom, upward private transfers account for 1 percent of consumption.
The analysis of the financing of consumption at each age reveals each country’s special characteristics. In most European countries, governments support programs (public pension and healthcare programs) for the elderly. In France, Germany, and Sweden, from the age of 65, the State provides most funding, whereas it plays only a minor role, even after age 70, in the United Kingdom, United States, and China. Sweden is the country where the State share rises fastest from age 65 to age 70. In all panel countries, the State’s share in funding consumption rises with age, except for China, where it rises until age 74 and then regularly declines (Figure 10).
Conclusion
In this article, we have applied the NTA method to France to gain an un-derstanding of economic flows between generations. Our particular interest
HI P P O L Y T ED’AL B I S E T A L. 125 FIGURE 10 Funding sources for consumption—cross-country comparison
FIGURE 10 (continued)
SOURCES: French Household Expenditure Survey (Enquête Budget de Famille), French Wealth Survey (Enquête Patrimoine), French Financial Asset Survey (Enquête Actifs Financiers), French Health and Social Protection Survey (Enquête santé et protection sociale, ESPS), permanent sample of people insured under the state health insurance scheme (Échantillon Permanent d’Assurés Sociaux, EPAS), 2008 French Household Disability and Health Survey (Enquête Drees Handicap Santé Ménage) and 2009 French Institutions Disability and Health Survey (Enquête Drees Handicap Santé Institutions), National Accounts. Calculations by the authors; for the other countries, international data from the National Transfer Accounts.
HI P P O L Y T ED’AL B I S E T A L. 127
lies in the question how far the State and individuals share the responsibility for financing the consumption of different generations.
By comparing the funding of consumption of the young (ages 0–24), adults (ages 25–59) and the elderly (ages 60+), we find that, while con-sumption of the elderly increased compared to the younger generations over the 1979–2011 period, the funding of that consumption did not result from more public transfers (per capita) to the elderly. The elderly are instead more autonomous and finance themselves increasingly by their own means, not only due to lower public transfers, but also due to reduced financial transfers to younger generations (adults and the young).
At the same time, the financial dependence of the young has been in-creasing over the observed period. The share of individual financing of the consumption of those aged 0–24 decreased between 1979 and 2011. They receive more public, but also—albeit to a much lesser extent—more family transfers to finance their consumption. Increases in the State-funded con-sumption of the young concern especially two age groups: the very young, who receive more generous family benefits, and those aged 18–24, who benefit from higher public investment in education. Longer educational en-rollment thus reduces the relative private consumption of the young but increases their relative public consumption.
Despite the decrease over the last decade in the relative contribution of the State to financing the consumption of the elderly, public funding of the elderly remains significant in France in comparison to other countries. Among the seven NTA countries, France ranks second, just behind Sweden, in the role of the State for the elderly. Yet, our results show that public spending for the elderly has not reduced the relative importance of the State in financing the consumption of the young. For the age group 0–24 years, France is the country where the State plays the largest role, especially for children under the age of 15.
A massive change in the age structure of the French population has occurred over the last decades, in particular due to the Baby Boomer cohorts. We find, however, that the public per capita expenditure for the elderly has remained relatively stable, while their consumption has increased. The increasing financial autonomy of the elderly, combined with decreasing financial independence of the young, is thus a result of changes in individual behavior rather than demographic changes. We find, however, that demographic changes play an important role for the aggregate levels of consumption.
We conclude that, despite a potential conflict in the allocation of public resources between the elderly and the young, population aging in France does not imply a withdrawal from public responsibility to invest in the future of the young. In comparison to the other countries in our analysis, both the elderly and the young depend less on family solidarity, even if fam-ily transfers have increased for the young over the last decades in France.
As individual and public funding complement each other, the system of na-tional solidarity is at the expense of neither individuals nor family solidarity. Consequently, consumption financing in France is most similar to the con-cept of “multi-solidarity,” as it cannot be said that either individual or public responsibility is placed above the other. When it comes to the funding of the young generations, the United States, Japan, Sweden, and Germany may also be classified as countries characterized by “multi-solidarity.” Only in the United Kingdom and China does individual responsibility dominate in the funding of consumption by the young. When it comes to the funding of the elderly, Sweden, Germany, and Japan join France in the concept of “multi-solidarity” with a relatively balanced responsibility between public and private funding. In the United States and United Kingdom, but also in China, the financing of the consumption of the elderly devolves more on the individual, who has greater responsibility to provide for his own needs in old age.
Despite “multi-solidarity” in France for both the young and the elderly, our finding points out that the latter increasingly finance themselves by ac-cumulating assets. This trend may give rise to two risks. First, when individ-ual provision falls short, as it often will, it may increase elderly dependency on other family members. Second, the increasing need to take financial precautions for oneself may come at the expense of inter-generational transfers to adult children and their children. Both are likely to lead to rising inequality, with the first having particularly significant effects on the elderly.
Consequently, even though France succeeds quite well in sharing re-sponsibilities between different agents in comparison to other countries, there is a risk that welfare inequalities will increase in the near future, especially for the elderly. Those inequalities would add—and potentially reinforce—health and longevity inequalities across socioeconomic groups, which are already important in France. For the young, the situation is am-biguous: the increasing importance of (diminishing) family transfers would increase inequalities, while the increasing importance of (still rising) public transfers would reduce them.
Limitations
While the NTA approach contributes significantly to understanding the im-pact of demographic change on the broader economy in France, it faces nevertheless several limitations and challenges. First, the NTA age profiles are a cross-sectional analysis of individuals observed at various time periods, which means we do not trace individuals throughout their lives. As profiles change over the years, the extent to which the NTA profiles can be used to forecast economic behavior of future generations is limited. A possibility to
HI P P O L Y T ED’AL B I S E T A L. 129
overcome this difficulty is to create pseudo-panels as proposed by d’Albis and Badji (2017).
Second, the accuracy of the NTA profiles depends on the quality of the survey data used. Even though all surveys used in this study are rep-resentative of the population, the attribution of observed funding and con-sumption items to different household members turned out to be a difficult undertaking when these items were not observed on an individual but on a household basis. This information gap encourages us to develop attribution tools that are less accurate than if public transfers had been continuously observed on an individual basis in all waves. In general, the lack of data also leads us to apply a common sharing rule for the consumption of goods and services inside the household, which might not always correspond to reality (see d’Albis and Moosa 2016, for a more detailed discussion of this criticism).
Third, the NTA profiles present averages per age, but we do not distin-guish between different populations. We find that on average, the elderly increasingly finance their needs with their own means, especially relying on a steady increase in asset-based income. But we should keep in mind that wealth is unevenly distributed. Besides, certain individuals aged 65+ are de-pendent on private transfers from their families and some others contribute to financing the needs of younger family members. Elderly women might be more in need of private transfers than elderly men, and differences between socioeconomic categories, regions, etc. are certainly also worth taking into account.
Nonetheless, and despite such limitations, the NTA approach employed here represents the best available tool to engage what has throughout his-tory been, and will continue to be, one of the fundamental problems that societies must solve: how to effectively and equitably finance the consump-tion of persons too young or too old to produce income sufficient to finance themselves.
Notes
We thank I. Badji, P.-Y. Cusset, R. Lee, A. Masson, and J. Pelletan as well as anonymous reviewers for their comments and suggestions as well as participants in the final 2017 AGENTA conference (Vi-enna), in the 2017 congress of the Cana-dian Society of Economics (SCSE, Univer-sity of Ottawa), in the 11th Global Meet-ing of the National Transfer Accounts Net-work (Saly), and in the 14th Interna-tional Conference on Pension Insurance and Savings (Paris Dauphine University). Financial supports from France Stratégie,
the Chair “Transition Economiques, Tran-sition Démographiques,” and the Euro-pean Community’s Seventh Framework Pro-gramme FP7/2007–2011 (Grant agreement no. 613247) are gratefully acknowledged. The usual disclaimer applies.
1 https://ctn.site.ined.fr/en/
2 See for example Sambt and Prskawetz (2011) for Austria, Lai and Tung (2015) for Taiwan and Patxot et al. (2012) for Spain.
3 See for example Miller (2011), Mason and Lee (2011) and d’Albis et al. (2017).
4 Expenses in first employment are bro-ken down according to the profiles for unem-ployment benefits and the profiles for indus-trial injury and sickness benefits according to the profiles for income from salaries.
5 See d’Albis et al. (2015) for details of the method for calculating salaries.
6 This normalization is often used in NTA (see Lee and Mason 2011b, d’Albis et al. 2017). It facilitates both intertemporal and international comparisons.
7 The number of years of study has in-creased considerably over the period as a result of policies aiming at raising educa-tional attainment. Schooling life expectancy between the ages of 2 and 29 rose from 16.9 years in 1985–1986 to 18.8 years in 1995–1996, before decreasing slightly un-til 2013–2014, when it reached 18.3 years (Ministère de l’Education Nationale 2016).
8 The increasing age of entry into work-ing life explains part of this result. Note that when we constrain the age group to individ-uals aged 0 to 18, the indicator still increases sharply.
9 The collapse in individual funding from 1984 to 1989 is associated with the decline in labor income for the youngest age groups and on-off features in private transfers in 1989. That year, private intra-household transfers were much higher than the two years before and after 1989.
10 Cash support to families, invest-ments in childhood education (pre-school from age two and a half on), high level of
child care coverage for children aged 0–2 (crèches, subsidies, and tax deductions for child minders and nannies), parental leave benefits.
11 From 1979 to 2011, the increase in family benefit expenditure has been espe-cially rapid due to a rather continuous in-crease in lump sum cash benefits around childbirth and in public child care cover-age, the introduction of child care subsidies (for nannies and child minders) and parental leave benefits during the 1990s, and the in-crease of child care subsidies and parental leave benefits during the 2000s.
12 Elderly individuals in France are el-igible for individualized autonomy benefits (named APA) if they need help for daily activities, for elderly individuals’ solidarity benefits (ASPA) if their income is low, and for supplementary invalidity benefits (ASI) if they have a disability and are below official retirement age.
13 In a gender decomposition of net pri-vate transfers, Renteria et al. (2016) highlight that among the elderly population, women are net private transfer recipients while men are net donors.
14 Public asset-based reallocation ac-counts for 2.9% of total consumption in 2011.
15 We used the NTA data available on May 18, 2018 on www.ntaccounts.org: Germany (2003), Sweden (2003), United Kingdom (2012), United States (2006), Japan (2004), and China (2002).
References
d’Albis, Hippolyte and Ikpidi Badji. 2017. “Intergenerational inequalities in standards of living in France.” Economie et Statistique / Economics and Statistics 491–492: 71–92.
d’Albis, Hippolyte, Carole Bonnet, Julien Navaux, Jacques Pelletan, Hector Toubon, and François-Charles Wolff. 2015. “The Lifecycle Deficit for France, 1979–2005.” The Journal of the Economics
of Ageing 5: 79–85.
d’Albis, Hippolyte, Carole Bonnet, Julien Navaux, Jacques Pelletan, and François-Charles Wolff. 2017. "Lifecycle Deficit in France: An Assessment for the period 1979–2011.” Economie et
Statistique / Economics and Statistics 491–492: 47–70.
d’Albis, Hippolyte and Dalal Moosa. 2016. “Generational Economics and the National Transfers Accounts.” Journal of Demographic Economics 81: 409–441.
d’Albis, Hippolyte and Julien Navaux. 2016. “La répartition par âge des transferts publics en France,” In Choc démographique, rebond économique, edited by Jean-Hervé Lorenzi. Editions Descartes et Cie, Collection Chaire Transitions Démographiques, Transitions Economiques.
HI P P O L Y T ED’AL B I S E T A L. 131
Allais, Maurice. 1947. Economie et Intérêt: Présentation nouvelle des problèmes fondamentaux relatifs au
rôle économique du taux de l’intérêt et de leur solutions. vol. 2 Paris, France: Imprimerie Nationale.
Auerbach, Alan, Jagadeesh Gokhale and Laurence Kotlikoff. 1992. “Generational accounting: A new approach to understanding the effects of fiscal policy on saving.” The Scandinavian Journal
of Economics 94(2): 303–318.
Chen, Tingyun, Jean-Jaques Hallaert, Alexander Pitt, Haonan Qu, Maximilien Queyranne, Alaina Rhee, Anna Shabunina, Jérôme Vandenbussche, and Irene Yackovlev. 2018. “Inequality and Poverty across Generations in the European Union.” IMF Staff Discussion Notes No. 18/01. Diamond, Peter. 1965. “National debt in a neoclassical growth model.” American Economic Review
55(5): 1126–1150.
———. 1996. “Generational Accounts and Generational Balance: An Assessment.” National Tax
Journal 49(4): 597–607.
Harris, Amy Rehder, William Evans and Robert Schwab. 2001. “Education spending in an aging America.” Journal of Public Economics 81: 449–472.
Haveman, Robert. 1994. “Should generational accounts replace public budgets and deficits?”
Jour-nal of Economic Perspectives 8(1): 95–111.
Kotlikoff, Laurence. 1995. “Generational accounting.” NBER Reporter.
Lai, Nicole Mun Sim and An-Chi Tung. 2015. “Who supports the elderly? The changing economic lifecycle reallocation in Taiwan, 1985 and 2005.” Journal of the Economics of Ageing 5: 63–68. Lee, Ronald. 1980. “Age structure, intergenerational transfers and economic growth: An overview.”
Revue économique 31(6): 1129–1156.
———. 1994. “Population Age Structure, Intergenerational Transfer, and Wealth: A New Approach, with Applications to the United States.” Journal of Human Resources 29(4): 1027–1063. Lee, Ronald and Andrew Mason. 2011a. “Generational Economics in a Changing World”, Population
and Development Review 37(supplement): 115–142.
Lee, Ronald and Andrew Mason, eds. 2011b. Population Aging and the Generational Economy: A Global
Perspective. Cheltenham, UK; Northampton, MA, USA: Edward Elgar Publishing.
Lee, Ronald, David McCarthy, James Sefton, and Joze Sambt. 2017. “Full Generational Accounts: What Do We Give to the Next Generation?” Population and Development Review 43(4): 695–720. Luci-Greulich, Angela and Olivier Thévenon. 2013. “The impact of family policy packages on
fer-tility trends in developed countries.” European Journal of Population 29(4): 387–416. Mason, Andrew, Ronald Lee, An-Chi Tung, Mun-Sim Lai, and Tim Miller. 2009. “Population Aging
and Intergenerational Transfers: Introducing Age into National Accounts.” In Developments in
the Economics of Aging, edited by David A. Wise, 89–122. University of Chicago Press, NBER
Book Series— The Economics of Aging.
Mason, Andrew and Ronald Lee. 2011. “Introducing age into national accounts.” In Population Aging
and the Generational Economy, edited by Ronald Lee and Andrew Mason, 55–78. Cheltenham,
UK; Northampton, MA, USA: Edward Elgar Publishing.
Masson, André. 2002. “Méthode et usages des comptes générationnels: un regard décalé.” Économie
et Prévision 154(3): 1–24.
Ministère de l’Education Nationale. 2016. “L’Etat de l’école,” n° 26.
Miller, Tim. 2011. “The rise of the intergenerational state: Aging and development.” In
Popula-tion Aging and the GeneraPopula-tional Economy, edited by Ronald Lee and Andrew Mason, 161–184.
Cheltenham, UK; Northampton, MA, USA: Edward Elgar Publishing.
Modigliani, Franco and Richard Brumberg. 1954. “Utility analysis and the consumption function: An interpretation of cross-section data.” In Post-Keynesian Economics, edited by Kenneth K. Kurihara, 388–436. New Brunswick: Rutgers University Press.
Patxot, Concepcio, Elisenda Rentería, Sanchez Romero, and Guadalupe Souto. 2012. “Measuring the balance of government intervention on forward and backward family transfers using NTA estimates: the modified Lee arrows.” International Tax and Public Finance, Springer 19(3): 442–461.
Poterba, James. 1997. “Demographic Structure and the Political Economy of Public Education.”
———. 1998. “Demographic change, Intergenerational Linkages, and Public Education.” The
American Economic Review 88(2): 315–320.
Preston, Samuel. 1984. “Children and the Elderly: Divergent Paths for America’s Dependent.”
Demography 21(4): 435–457.
Rentería, Elisenda, Rosario Scandurra, Guadalupe Souto, and Concepcio Patxot. 2016. “Intergen-erational money and time transfers by gender in Spain: Who are the actual dependants?”
Demographic Research 34(24): 689–704.
Sambt, Joze and Alexia Prskawetz. 2011. “National Transfer Accounts for Austria: low levels of edu-cation and the generosity of the social security system.” In Population Aging and the Generational
Economy, edited by Ronald Lee and Andrew Mason, 256–268. Cheltenham, UK;
Northamp-ton, MA, USA: Edward Elgar Publishing.
Samuelson, Paul. 1958. “An exact consumption-loan model of interest with or without the social contrivance of money.” Journal of Political Economy 66(6): 467–482.
United Nations. 2013a. “Intergenerational solidarity and the needs of future generations.” Report of the Secretary-General.
———. 2013b. “National Transfer Accounts manual: Measuring and analyzing the generational economy.” Department of Economic and Social Affairs, Population Division.