Fuel Poverty as a Major Determinant
of Perceived Health: The Case of France
Corinne CHATON, Elie LACROIX
Working Paper
RR-FiME-14-03
June 2014
Fuel poverty as a major determinant of
perceived health: The case of France
Corinne CHATON
CABREE, Canada, FiME, France.
Corresponding author: [email protected]
Elie Lacroix
Université Paris–Dauphine
E-mail : [email protected]
Abstract
The numbers of households in fuel poverty is increasing. Indeed, more and more people are struggling to heat their homes and therefore more and more people are exposed to low temperatures which can a¤ect their health. In this paper, we use the French database of the Healthcare and Insurance survey to study the link between a subjective measure of fuel poverty (coldness) and self-reported health. We also analyze the impact of other individual and environmental special features on self-reported health. The estimation of a dichotomous Probit model allows us to infer a negative impact of fuel poverty on self-reported health. Thus, a person in fuel poverty is 2.36 percentage points more likely to report poor or fair health status than a person who is not in fuel poverty. Accordingly, it may be appropriate to implement support for the most vulnerable categories of the health impacts of fuel poverty and cold homes, eg for chronic patients who have di¢ culty heating their homes.
JEL Codes: I1, I32, Q4
1
Introduction
According to the French National Institute of Statistics and Economic Studies (INSEE), in France in 2013, 8:6 million people were considered poor that is to say, lived in household where the standard of living is below the threshold at 60% of the median of standards (poverty threshold). In June 2013, the number of unem-ployed in category A (Jobless jobseekers obliged to actively seek a job) was 3:28 million (more than 10% of the labour force), up 0:5% on month and 11:2% year on year. More and more French people …nd themselves in …nancial exclusion or are in serious debt. Thus, we are witnessing the growth of a real precarious popula-tion. As a result, households are more likely to be restricted in order to heat their homes and move. The number of households in fuel poverty is expected to grow especially considering to the projections of the French Commission for Energy Regulation (CRE), in 2017, the residential regulated tari¤ (respectively profes-sional) will increase by 30:1% (respectively 25:8%) including the Contribution to Electricity Public Services (CSPE).1 But what do we mean by fuel poverty?
The UK government considers that households are in fuel poverty if more than 10 percent of their income is spent on heating.2 10% is twice the median
expenditure on energy consumption calculated from the 1988 Family Expenditure Survey (FES), a survey which provides, among other things, information on UK households such as income and regularity of payments. This objective measure is used by INSEE. Thus, in France, households that spend more than 10% of their income on energy bills are considered to be in fuel poverty. Using this measure and INSEE data in 2013, 3:8 million households seem concerned by this state. But the use of this measure is questionable. Indeed, on the one hand, it is likely that the median level of energy consumption has changed since 1988 and, in addition, that the French level di¤ers from the UK. On the other hand, we can criticize the way this level is calculated and the robustness of the results. For example, a change in temperature threshold used to calculate heating costs can cause large variations in the number of households considered to be in fuel poverty.3 To re‡ect the diversity
of individual situations and to include only households that are poor, it is possible to consider that the households where the “remaining ressources”after deducting unavoidable expenditure is less than 200 euros per month are in fuel poverty.4 But,
the threshold value at 200 euros does not seem justi…ed. And the choice of the fuel poverty de…nition but also of the threshold are important for policy implication.5 In France, the de…nition in the Article 11 of the French commitment to the environment (Grenelle II law) of 12 July 2010 is the following: a household “is in fuel poverty under this Act a person who has di¢ culties disposing of the necessary energy to satisfy his basic needs due to the inadequacy of his resources or his liv-ing conditions”. This de…nition re‡ects the three main factors of fuel poverty3,
heat-ing and insulation standards9 and high energy prices10. On the assumption that
fuel poverty is related to a form of poverty, that it is essential to have a multidi-mensional approach.11 Thus, he proposes a de…nition of fuel poverty based on the
following three criteria: 1) Lack of access to a certain level of utility, among others, the inability to maintain a desired household temperature, or, worse still, unable to keep their housing. 2) The absence of some social primary goods.123) The concept
of capabilities. This concept allows us to understand why habits are distributed in di¤erent ways can be summarized as opportunities to do certain things in order to be in certain states. The capability is the combination of functionings that an individual is capable of achieving. “Functionings represent parts of the state of a person – in particular the various things that he or she manages to do or be in leading a life. The capability of a person re‡ects the alternative combinations of functionings the person can achieve, and from which he or she can choose one collection. The approach is based on a view of living as a combination of various ‘doings and beings’, with quality of life to be assessed in terms of the capability to achieve valuable functionings”.13
People in fuel poverty can not heat their homes at acceptable temperatures set by the World Health Organization (WHO): the main living area must have a temperature of 21 C and the other occupied rooms must have temperatures of 18 C. Thus, the main threat of fuel poverty results in the exposure of the body to low temperatures. To determine the number of households which are in fuel poverty, we use a subjective test such as coldness felt by an individual. Thus, the answer to the question of the french National Housing Survey (database of INSEE): “did you feel cold during the winter?” can approximate the number of French in fuel poverty. The proportion of people responding positively to this question in 2006 was 14:8% against 10:9% in 1996.
The issue of assessment of fuel poverty as part of all precariousness and in connection with other forms of poverty seems essential in order to design e¤ective solutions. One objective of this paper is to understand the interactions between health and fuel poverty. Much British work is devoted to analyzing the links between the various precariousness. Thus, on the one hand, some studies high-lighted the negative impact on the physical and mental health of individuals, liv-ing in cold poorly heated homes.14; 15 On the other hand, others show that a poor
thermal e¢ ciency, often likened to a characteristic of poor housing, increases the risk of falling into fuel poverty.16 In addition, a lack of thermal e¢ ciency promotes mildew and moisture that have negative e¤ects on the health of individuals.17
Using data from the epidemiological study LARES (Large Analysis and Review of European housing and health Status) and a logistic regression model, the rela-tionship between the energy e¢ ciency of each household and the health (diseases or symptoms) of its occupants was estimated.18 . They con…rm, among other things,
the relationship between a poor thermal comfort and an increased risk of respir-atory and cardiovascular diseases. Indeed, the exposure of the body to low tem-peratures a¤ects the health. As a matter of fact, the impact of low temtem-peratures on health is characterized by an increase in cardiovascular and respiratory risk.19
Thus, less than 16 C temperature causes respiratory problems; less than 12 C temperature causes circulatory problems and a temperature between 5 C 6 C leads to the risk of hypothermia. A signi…cant relationship exists between the in-dicator Excess Winter Deaths (EWD) and living in the “Cold-Home”.20 Living in
an environment with low temperature causes 1) an increase in blood pressure due to narrowing of blood vessels and 2) an increase in the blood viscocity.21However,
increased blood pressure and higher blood viscosity, are both factors that increase the risk of Cerebral Vascular Accident (CVA) or heart attacks. Individuals living in a damp house, with the presence of mold and low indoor temperatures, have a higher likelihood of contracting chronic respiratory diseases.22; 23; 24; 25 Five major studies (Warm Front Scheme, the Scottish Central Heating Programme (CHP), the New Zealand Housing, Insulation and Health Study (HIHS) and Housing, Heatind and Health study (HHHS), National Cente for Social research that led a longit-udinal study on the housing conditions and the well-being of children and …nally the U.S. children’s sentinel Nutritional Assessment Program (C-SNAP)) with a quasi-experimental design investigation carried out under programs for housing renovation of individuals who are a priori in fuel poverty, reveal a signi…cant ef-fect of these programs on improving one’s mental health state.
As a result, many studies highlight the link between housing and certain dis-eases. But, on the one hand, many of these studies only contain to statistical analysis and therefore don’t specify a model to estimate. On the other hand, the majority of these studies are British and focus on speci…c diseases. To overcome the lack of French studies on the link between fuel poverty (through feeling cold) and health, we will specify a dichotomous probit model (Section 2) whose para-meters are estimated using the French database of the Healthcare and Insurance survey. So, we analyze the impact of fuel poverty on the health in mainland France undergoing this state, but we also look at other determinants of health, such as, for example the level of education, income, sex, etc. The estimation results are discussed in Section 3. Section 4 contains conclusions.
2
Methods
2.1
Data and de…nition
Database. We use the French database of the Healthcare and Insurance Sur-vey (ESPS). The ESPS is the baseline surSur-vey on health, access to health care and
health insurance in France. Since 1988, data on the state of health, health insur-ance, social status and care utilization in a sample of 8; 000 ordinary households, or 22; 000 people were collected. It represents about 96% of the population living in mainland France. Thus, in 2010, the age distribution of the people who were surveyed were the following: 22% of those surveyed were under 16 years of age, 30% were between 16 and 39 years of age, 35% were between 40 and 64 years of age and 13% were over 65. 50:8% were women. 41% were individuals in gain-ful employment, 6% were unemployed and the the remaining 53% were inactive. 6:4% of those surveyed were single, 8:9% were single parent families, 21:5% were childless couples and 58:8% couples with children. (See Appendix for descriptive statistics)
Fuel poverty. In 2010, the following question was added to the main ques-tionnaire of ESPS submitted to respondents: Over the last winter, has your house-holds su¤ered from the cold, inside your home during at least 24 hours? This question that was also raised in the last national survey French Housing (ENL), conducted in 2006, reveals people undergoing thermal discomfort. Consequently, if we choose as measure of fuel poverty so-called subjective measure or declarative measure that is based on the feeling of cold re‡ecting the su¤ered thermal dis-comfort, the individuals who responded positively to this question are considered to be in fuel poverty. Using data from ENL the proportion of people reporting have been cold in the winter has increased dramatically from 10:9% in 1996 to 14:8%in 2006 (+ 3:9 points). More households reported that they restricted their energy expenditure by giving up thermal comfort.26 Indeed, households were cold in their home more frequently in 2006 than in 2002 have limited their consumption of heating because of its cost (21:5% against 14%). In 2010 ESPS database, 15% of those surveyed reported having been cold last winter. We determine, among other things, whether the fuel poverty is a determining factor in the health status of individuals and in what proportion.
Perceived health. The measurement of health status that we adopt is also a subjective measurement through the following question addressed to the household surveyed: How is your general health? The response categories are …ve in number and are as follows: Very good (30% replied that their health was very good) – Good (43%) –Good (21%) –Bad (5%) –Very bad (1%). This measure of health is considered in the literature as being a good indicator of mortality.27 Thus, the
2.2
Model
Method of clustering. We have three sub bases (two bases consist of 8; 305 observations household and an individual basis consists of 22; 850 observations) that were merged for an individual …nal base of 22; 850 observations. To take pos-sible correlations among di¤erent households into account an econometric treat-ment by Clustering was realized.28
Dichotomous probit model. To determine the probability of self-reporting poor health is dependant on many variables, including those relating to being or not in fuel poverty we use a dichotomous probit model to explain the occurrence an event or not. Let Yi is binary variable equals to 1 if the ith individual say
that their health is bad and 0 otherwise. The reason for the variable health has now only two modes while it has …ve in the database, is that the proportional odds assumption is rarely checked, so we can a¤ord to make this dichotomous variable. The observable outcomes (to report poor health) are represented by a binary indicator variable Yi as follows:
Yi =
1 if Yi > 0 to report poor health
0 otherwise; (1)
Pr( Yi = 1j Xi) = 1 [ Xi0 ] ; (2)
Pr( Yi = 0j Xi) = [ Xi0 ] ; (3)
where Yi is a latent dependent variable, Pr denotes probability, is the Cumu-lative Distribution Function of the standard normal distribution (N(0; 1)) and Xi
all exogenous variables in the model. Yi is generated by a linear regression model of the form:
Yi = 0+ i(F uel P overty)i+ Xi0+ "i; (4)
where 0 is a constant, ithe coe¢ cient associated with the variable F uel P overty
for the individual i, (F uel P overty)i the variable that corresponds to declaring be in fuel poverty for individual i, Xi0 the vector of exogenous variables such as gender, age, level of education, main occupation, the living area, the type of dwelling, tenure (owned or rented), to su¤er from a long-term illness, etc. (see Appendix 1 for the list of variables) and "i the error term is assumed to follow a Normal
(N(0; 1)). Note that the choice of the selection of the control variables is not trivial. Indeed, using the same database, in a previous work, we have identi…ed the socio-economic determinants of fuel poverty and thus specify the pro…le of the potentially most vulnerable as fuel poverty individuals.
3
Results
We use the version of Stata SE 12 to estimate the model (equations (1)–(4)). The highlighted parts in the Table 1 refer to the variables whose coe¢ cients are signi…cant at the 5% and 10% levels. The post-assessment tests con…rm the correct speci…cation. Indeed, the result of the Hosmer–Lemeshow test (a p–value equals to 0:3) notes a good …t for our logistic regression model. The linktest indicates that the speci…cation of our model is correct. Indeed, we observe that the hatsq has a critical probability greater than 0:05 since equal to 0:9. Wald tests indicate that the coe¢ cients are signi…cantly di¤erent from zero even for the coe¢ cient on fuel poverty. The marginal probability e¤ects (see column 8 of Tables 1 a–c) allow for an easy and fast interpretation of the results. Indeed, these e¤ects are the partial e¤ects of each explanatory variable on the probability that the observed dependant variable Yi = 1; thus they interpreted as the elasticity of to change the
variable xij. Consequently, if the marginal e¤ect is equal to x then if xij ranges
from 1% the probability of Yi = 1 for individual i vary by x%:
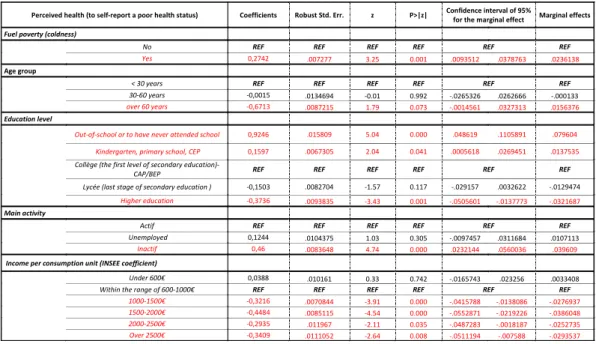
Perceived health (to self-report a poor health status) Coefficients Robust Std. Err. z P>|z| Confidence interval of 95%for the marginal effect Marginal effects
Fuel poverty (coldness)
No REF REF REF REF REF REF Yes 0,2742 .007277 3.25 0.001 .0093512 .0378763 .0236138 Age group
< 30 years REF REF REF REF REF REF 30-60 years -0,0015 .0134694 -0.01 0.992 -.0265326 .0262666 -.000133 over 60 years -0,6713 .0087215 1.79 0.073 -.0014561 .0327313 .0156376
Education level
Out-of-school or to have never attended school 0,9246 .015809 5.04 0.000 .048619 .1105891 .079604
Kindergarten, primary school, CEP 0,1597 .0067305 2.04 0.041 .0005618 .0269451 .0137535
Collège (the first level of secondary
education)-CAP/BEP REF REF REF REF REF REF Lycée (last stage of secondary education ) -0,1503 .0082704 -1.57 0.117 -.029157 .0032622 -.0129474
Higher education -0,3736 .0093835 -3.43 0.001 -.0505601 -.0137773 -.0321687
Main activity
Actif REF REF REF REF REF REF Unemployed 0,1244 .0104375 1.03 0.305 -.0097457 .0311684 .0107113
Inactif 0,46 .0083648 4.74 0.000 .0232144 .0560036 .039609
Income per consumption unit (INSEE coefficient)
Under 600€ 0,0388 .010161 0.33 0.742 -.0165743 .023256 .0033408
Within the range of 600-1000€ REF REF REF REF REF REF 1000-1500€ -0,3216 .0070844 -3.91 0.000 -.0415788 -.0138086 -.0276937
1500-2000€ -0,4484 .0085115 -4.54 0.000 -.0552871 -.0219226 -.0386048
2000-2500€ -0,2935 .011967 -2.11 0.035 -.0487283 -.0018187 -.0252735
Over 2500€ -0,3409 .0111052 -2.64 0.008 -.0511194 -.007588 -.0293537
Table 1 a. - Impact of fuel poverty, age, education level, main activity and income on perceived health.
Perceived health (to self-report a poor health status) Coefficients Robust Std. Err. z P>|z| Confidence interval of 95%for the marginal effect Marginal effects
Sex
Men REF REF REF REF REF REF Women -0,2062 .0052063 -3.41 0.001 -.0279577 -.0075494 -.0177536
Be sad
Permanently .5917181 .0183108 2.78 0.005 .0150549 .086832 .0509435
A lot of the time .5113012 .0118216 3.72 0.000 .0208502 .0671899 .04402
From time to time .3075306 .0089042 2.97 0.003 .0090246 .0439286 .0264766
Rarely .040381 .0084677 0.41 0.681 -.0131198 .0200729 .0034766
Never REF REF REF REF REF REF Be happy
Permanently REF REF REF REF REF REF A lot of the time -.0161751 .0101259 -0.14 0.891 -.021239 .0184538 -.0013926
From time to time .104404 .0107652 0.83 0.404 -.0121109 .0300881 .0089886 Rarely .3318975 .0121715 2.35 0.019 .0047188 .0524301 .0285744
Never .6402075 .0143189 3.85 0.000 .0270536 .0831826 .0551181
Be discouraged
Permanently .9779064 .0157949 5.33 0.000 .0532347 .1151494 .084192
A lot of the time .6426894 .0117196 4.72 0.000 .0323618 .0783018 .0553318
From time to time .3366912 .0086057 3.37 0.001 .0121203 .045854 .0289871
Rarely .1734355 .0078623 1.90 0.058 -.000478 .0303416 .0149318
Never REF REF REF REF REF REF Presence of dampness
Yes REF REF REF REF REF REF No -.0281457 .0071068 -0.34 0.733 -.0163523 .011506 -.0024232
Should not have a long duration disease (LDD)
Yes REF REF REF REF REF REF No -.6432724 .0058312 -9.50 0.000 -.066811 -.043953 -.055382
Table 1 b. - Impact of sex, psychological state and presence of dampness on perceived health.
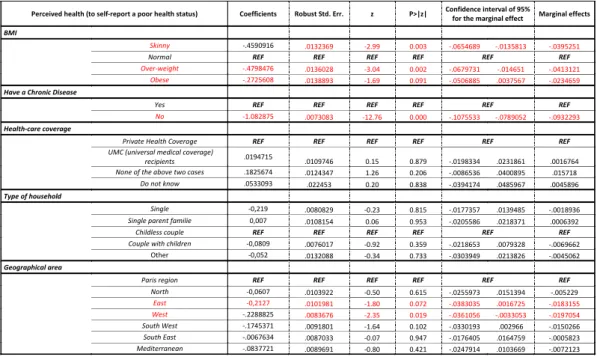
Perceived health (to self-report a poor health status) Coefficients Robust Std. Err. z P>|z| Confidence interval of 95%for the marginal effect Marginal effects
BMI
Skinny -.4590916 .0132369 -2.99 0.003 -.0654689 -.0135813 -.0395251
Normal REF REF REF REF REF REF Over-weight -.4798476 .0136028 -3.04 0.002 -.0679731 -.014651 -.0413121
Obese -.2725608 .0138893 -1.69 0.091 -.0506885 .0037567 -.0234659
Have a Chronic Disease
Yes REF REF REF REF REF REF No -1.082875 .0073083 -12.76 0.000 -.1075533 -.0789052 -.0932293
Health-care coverage
Private Health Coverage REF REF REF REF REF REF UMC (universal medical coverage)
recipients .0194715 .0109746 0.15 0.879 -.0198334 .0231861 .0016764
None of the above two cases .1825674 .0124347 1.26 0.206 -.0086536 .0400895 .015718
Do not know .0533093 .022453 0.20 0.838 -.0394174 .0485967 .0045896
Type of household
Single -0,219 .0080829 -0.23 0.815 -.0177357 .0139485 -.0018936
Single parent familie 0,007 .0108154 0.06 0.953 -.0205586 .0218371 .0006392
Childless couple REF REF REF REF REF REF Couple with children -0,0809 .0076017 -0.92 0.359 -.0218653 .0079328 -.0069662
Other -0,052 .0132088 -0.34 0.733 -.0303949 .0213826 -.0045062
Geographical area
Paris region REF REF REF REF REF REF North -0,0607 .0103922 -0.50 0.615 -.0255973 .0151394 -.005229 East -0,2127 .0101981 -1.80 0.072 -.0383035 .0016725 -.0183155 West -.2288825 .0083676 -2.35 0.019 -.0361056 -.0033053 -.0197054 South West -.1745371 .0091801 -1.64 0.102 -.0330193 .002966 -.0150266 South East -.0067634 .0087033 -0.07 0.947 -.0176405 .0164759 -.0005823 Mediterranean -.0837721 .0089691 -0.80 0.421 -.0247914 .0103669 -.0072123
Table 1 c. - Impact of BMI, Chronic Disease, Health-care coverage, type of household and geographical area on perceived health.
Fuel poverty and health. We …nd a signi…cant impact of fuel poverty on the probability of reporting poor health at the 5% level. Thus, being in fuel poverty (measured subjectively) increases the probability of 2:36 percentage points to declare poor health. This corroborates the results of the studies presented above and mostly made in the UK that highlighted the existence of a negative impact of fuel poverty on health status.20;14, 19
Level of education and health. The results indicate that the level of edu-cation has an impact on the probability of reporting poor health. Indeed, the higher the level of study is important the lower likelihood that an individual de-clares a bad state of health. Being out of school or have never been increases the probability of reporting poor health by 7:9 percentage points compared to a person with a level of education Collège (Lower secondary school)-CAP/BEP (Youth Training /BTEC First Diploma).29 This can potentially be justi…ed by a
higher probability of withdrawal care generally in individuals whose level of edu-cation is low. In contrast, a higher level of eduedu-cation reduces the probability of reporting poor health by 3:2 percentage points compared to having a level of study
Activity, income and health. Regarding the occupation of individuals, it appears that inactivity increases the probability of reporting poor health of almost 3 percentage points compared to an active individual. Without surprise, the variable income per unit of consumption has an impact on the reported health. As in other studies, the higher the level of income per unit of consumption, lower the probability of reporting poor health is important.30; 31 So, the individual with
income per consumption unit (CU) between 1500e 2000e reduces the probability of reporting poor health by about 4 percentage points compared to an individual with a mensuel income between 600e and 1000e.
Psychological state and health. Being constantly sad increases the prob-ability of self-reporting poor health by 5 percentage points compared to an indi-vidual claiming never to be sad. Being discouraged also has a negative impact on self-reported health status. In fact, reported being discouraged continually in-creases the probability of reporting to be in poor health by 8:4 percentage points compared to an individual claiming never be. In contrast, the happy variable has a positive impact on the reported health. Thus, the fact of reporting never be happy increases the probability of reporting poor health by 5:5 percentage points from reporting to be permanently happy.
LDD, chronic illness and health. To not declare a long duration disease (LDD) decreases the probability of reporting poor health by 5:5 percentage points compared to the fact to declare one. Finally, as the LDD, not having declared chronic disease reduces the probability of reporting poor health These results are not surprising since these “objective”health characteristics also a¤ect the percep-tion of our health.
Gender and health. Being a woman increases the probability of reporting poor health by 1:7 poucentage points.
Declaring be obese or underweight reduces the probability of reporting poor health compared to individuals of normal weight. It is di¢ cult to …nd a coherent explanation for this result except perhaps the fact that obese individuals,do not perceive the potential health hazards of their state. Thus, the subjective state-ment on their health may be biased. The interpretation of the parameter of the variable geographical area is also di¢ cult. We can simply note that people living in the East and West regions have a lower probability of reporting to be in poor health than those living in the Paris region. The age variable has no impact on the threshold of 5%. However, at the 10%, be aged over 60 years increases the probability of reporting poor health by 1:5 percentage points compared to a per-son under 30 years. The variable indicating whether individuals live in housing
with a damp moisisure, has no e¤ect. However, some studies highlight a negative e¤ect thereof on the respiratory health of individuals being exposed.25; 22; 23; 24 The
variable indicating the level of coverage of individual by mutual is not signi…cant. Although a person is not covered or partially covered by a mutual may be more reluctant to use the care that a person with a mutual, because of the costs that could result, it turns out that having or not health coverage is not signi…cant on the state to report poor health. This could be justi…ed by the fact that individuals without complementary health refuse to report their actual health status.
4
Discussion
Estimating a dichotomous probit model through the French database of the Health-care and Insurance Survey (ESPS), we can a¢ rm that fuel poverty (coldness) is a determinant of the self-reported health in mainland France. Since fuel poverty has an impact on health, it may be appropriate to target the most vulnerable population. Considering the fuel poverty de…nition of Boardman, two groups of individuals are most likely to fall in fuel poverty.32 On the one hand, those whose
energy consumption is too high in proportion to their income and secondly, those practicing self-restraint to avoid the swelling of their energy bills. Based on this observation, the implementation of a “mutual energy insurance” (provided to the most vulnerable individuals precarious energy –elderly and/or dependent, LDD – and exposing their bodies at low temperatures which would cause the most serious consequences for their health) could respond to the phenomenon of self-restraint. Indeed, self-restriction periods of extreme cold, for example, could be partly lim-ited via this “mutual energy insurance” that would take care of the over‡ow of temporary use. This system is comparable to a complementary health insurance (CHI) type Supplementary Universal Health Care-Coverage (CMU–C: "Couver-ture Maladie Universelle–Complémentaire") where the additional costs would be covered . It would not necessarily smooth consumption over time. But against it would smooth the cost incurred by this consumption due to the support for a portion of these amounts. Funding could be through participation of the State and a slight increase in the Contribution to the Public Electricity Service (CSPE). In parallel, information systems, prevention and rehabilitation of housing could be established as in the UK (Warm Front scheme, CHP, HHHS, HIHS and C-SNAP). Their objectives are to inform individuals of devices available to them to advise them on how to behave in order to achieve energy savings and increase the de-gree of energetic e¢ ciency in housing too ine¢ cient. To focus this proposal on the individuals in “fuel poverty” could potentially prevent a substantial amount of expenses incurred by the Health Insurance caused by diseases contracted from exposure to low temperatures. The issue of health care costs caused by the “fuel
poverty” state (increased medical consultation or prescription medicines for ex-ample) has already been the subject of evaluation work in the UK. Thus, the Chief Medical O¢ cer of the National Health Service (NHS) estimates the cost at 850 million British pounds per year. This amount must therefore challenge poli-cymakers on measures to be implemented to eradicate this growing phenomenon.
Ethical approval
Laboratoire de Finance des Marchés de l’Energie (FiME) Funding
This study was supported by FiME. Competing interests
None declared
References
1. CRE. Le fonctionnement des marchés de détail francais de l’électricité et du gaz naturel. Rapport 2011–2012. Paris; 2013.
2. Barrantes R, Galperin H. Can the poor a¤ord mobile telephony? Evidence from Latin America. Telecommunications Policy 2008; 32:521–530.
3. Hills J. Getting the measure of fuel poverty: …nal report of the Fuel Poverty Review, Centre for Analysis of Social Exclusion. London School of Economics and Political Science; 2012.
4. Hodan N. Politiques environnementales et précarité. 23e convention nationale de L’INTERCOMMUNALITÉ, octobre 2012.
5. Moore R. De…nitions of fuel poverty: Implications for policy. Energy Policy 2012, 49:19– 26.
6. Brechling V, Smith S. Household energy e¢ ciency in the UK. Fiscal Studies, Wiley Online Library 1994, 15:44–56.
7. Whyley C, Callender C. Fuel poverty in Europe: evidence from the European household panel survey, a report for NEA, London, Policy Studies Institute; 1997.
8. Clinch JP, Healy JD. Alleviating fuel poverty in Ireland: a program from the 21st century. International Journal for Housing Science 1999, 23(4):203–215.
9. Guertler P, Preston I. Raising the SAP : Tackling fuel poverty by investing in energy e¢ ciency. Consumer Focus; 2009.
10. Preston I, Moore R, Guertler P. How Much ? The Cost of Alleviating Fuel Poverty, Report to the EAGA Partnership Charitable Trust. CSE,Bristol; 2008.
11. Dubois U. La pauvreté énergétique. Quelles dé…nitions ? Comment mesurer ? Working paper series: REFGOV-IFM -36; 2007.
12. Rawls J. A Theory of Justice. Harvard University Press; 1971.
13. Sen AK. Capability and well-being. In: Nussbaum M & Sen AK, editors. The Quality of Life. Oxford University Press on Demand; 1993
14. Rudge J, Gilchrist R. Excess winter morbidity among older people at risk of cold homes: a population-based study in a London borough. Journal of Public Health 2005, 27(4):353– 358.
15. Liddell C, Morris C. Fuel poverty and human health: A review of recent evidence. Energy Policy 2010, 38(6):2987–2997.
16. Lockwood M, Platt R. Green Streets – Final Report to British Gas. London: IPPR, march 2009.
17. Platt SD, Martin CJ, Hunt SM, Lewis CW. Damp housing, mould growth and sympto-matic health state. BMJ 1989, 298(6689):1673–1678.
18. Ezratty V, Duburcq A, Emergy C, Lambrozo J. Liens entre e¢ cacité énergétique du logement et de la santé des résidents : résultants de l’étude européenne LARES. Environ-nement, Risques & Santé 2009, 8(6):497–506.
19. World Health Organization. Health Impact of Low Indoor Temperatures: Report on a WHO Meeting-Copenhagen 11-14 November 1985, World Health Organization, Regional O¢ ce for Europe; 1987.
20. Wilkinson P, Landon M, Armstrong B, Stevenson S, Pattenden S, McKee M, Fletcher T. Cold Comfort: The social and environmental determinants of excess winter deaths in England, 1986-96. The Policy press, Bristol; 2001.
21. Collins KJ, Easton JC, Bel…eld-Smith H, Exton Smith AN, Pluck RA. E¤ects of age on body temperature and blood pressure in cold environments. Clinical Science 1985, 69:465–470.
22. Peat JK, Dickerson J, Li J. E¤ects of damp and mould in the home on respiratory health: a review of the literature. Allergy, 1998, Wiley Online Library, 53:120–128 .
23. Hyndman S. Making connections between housing and health. In: Robin A. Kearns and Wilbert M. Gesler, editors. Putting Health into Place: Landscape, Identity and Well-being,
24. Collins KJ. Cold, cold housing and respiratory illnesses. International Journal for Housing Science and Its Applications, URAL & ASSOCIATES 2000, 23:203-216.
25. Bornehag CG, Blomquist G, Gyntelberg F, Jarvholm B, Malmberg P, Nordvall L, Nielsen A, Pershagen G, Sundell J. Dampness in buildings and health. Indoor Air 2001, 11(2):72– 86
26. Devalière I, Briant P, Arnault S. La précarité énergétique : avoir froid ou dépenser trop pour se chau¤er. INSEE Première 2011, vol.1351.
27. Idler EL, Benyamini Y. Self-rated health and mortality: A review of twenty-seven com-munity studies. Journal of Health and Social Behavior 1997, 38(1): 21-37.
28. Moulton BR. An Illustration of a Pitfall in Estimating the E¤ects of Aggregate Variables on Micro Unit.The Review of Economics and Statistics 1990, 72(2):334–38.
29. Mackenbach JP, Kunst AE, Carelaars AEJM, Groenhof F, Geurts JJM. Socioeconomic inequalities in morbidity and mortality in western Europe. Lancet 1997, 349(9066):1655 –1659
30. Mackenbach JP. De verklaring van sociaal-economische gezondheidsverschillen. In: Ongezonde verschillen: over sociale strati…catie en gezondheid in Nederland. Assen: Van Gorcum; 1994, 76-133.
31. Reijneveld SA. Reported health, lifestyles and use of health care of …rst generation im-migrants in The Netherlands: do socioeconomic factors explain their adverse position? Journal of epidemiology and Community Health 1998, 52:298–304.