HAL Id: tel-01226534
https://pastel.archives-ouvertes.fr/tel-01226534
Submitted on 9 Nov 2015HAL is a multi-disciplinary open access archive for the deposit and dissemination of sci-entific research documents, whether they are pub-lished or not. The documents may come from teaching and research institutions in France or abroad, or from public or private research centers.
L’archive ouverte pluridisciplinaire HAL, est destinée au dépôt et à la diffusion de documents scientifiques de niveau recherche, publiés ou non, émanant des établissements d’enseignement et de recherche français ou étrangers, des laboratoires publics ou privés.
Xiaolan Sha
To cite this version:
Xiaolan Sha. Personalizing trending content in social media. Sociology. Télécom ParisTech, 2013. English. �NNT : 2013ENST0026�. �tel-01226534�
2012-ENST-0026
EDITE - ED 130
Doctorat ParisTech
T H È S E
pour obtenir le grade de docteur délivré par
TELECOM ParisTech
Spécialité « INFORMATIQUE et RESEAUX »
présentée et soutenue publiquement parXiaolan SHA
le 6 mai 2013Personnalisation du Contenu et Tendances
dans les Médias Sociaux
Directeur de thèse :Pietro Michiardi
Jury
M. Ernst BIERSACK,Département Réseaux et Sécurité, EURECOM Président
M. Guillaume URVOY-KELLER,Laboratoire I3S, Université Nice Sophia Antipolis Rapporteur
Mme. Elena BARALIS,Dipartimento di Automatica e Informatica, Politecnico di Torino Rapporteur
M. Daniele QUERCIA,Yahoo ! Lab, Barcelona Examinateur
TELECOM ParisTech
Abstract
Social media continuously draws the interest of researchers from a variety of perspec-tives - networks, sociology, marketing etc. In this networked age, the role of mass me-dia at spreading information is increasingly opening itself to individual contributions. Researchers have therefore focused on how information is disseminated by individuals through social networks. Fluctuating along user connections, some content succeeds at capturing the attention of a large amount of users and suddenly becomes trending. Un-derstanding trending content and its dynamics is crucial to the explanation of opinion spreading, and to the design of social marketing strategies. While previous research has mostly focused on trending content and on the network structure of individuals in social media, this work complements these studies by exploring in depth the human factors behind the generation of this content. We build upon this analysis to investigate new personalization tools helping individuals to discover interesting social media content. This work contributes to the literature on the following aspects:
• An in depth analysis on individuals who create trending content in social media that uncovers their distinguishing characteristics;
• A novel means to identify trending content by relying on the ability of special indi-viduals who create them;
• A mechanism to build a recommender system to personalize trending content; • Techniques to improve the quality of recommendations beyond the core theme of
accuracy.
Our studies underline the vital role of special users in the creation of trending content in social media. Thanks to such special users and their “wisdom”, individuals may dis-cover the trending content distilled to their tastes. Our work brings insights in two main research directions - trending content in social media and recommender systems.
Résumé
Actuellement, les médias sociaux retiennent continûment l’attention des chercheurs dans des domaines varies comme par exemple les réseaux, la sociologie, le marketing, etc. À notre époque où tout devient interconnecté, les médias de masse accordent de plus en plus d’importance aux contributions des individus dans la diffusion de l’information. Les chercheurs se sont donc intéressés à la façon dont l’information se propage dans les réseaux sociaux. En fonction des connexions entre utilisateurs de ces réseaux, certains contenus peuvent bénéficier d’une large audience et tout d’un coup se transformer en tendance. Comprendre comment du contenu peut se transformer en tendance est donc crucial pour pouvoir expliquer la propagation des opinions ainsi que pour établir des stratégies de marketing sociale. Les précédentes études se sont concentrées sur les carac-téristiques du contenu pouvant se transformer en tendance et sur la structure du réseau d’individus dans les médias sociaux. Ce travail complète ces études en explorant les fac-teurs humains derrières la génération du contenu tendance. Nous nous appuyons sur cette analyse pour définir de nouveaux outils de personnalisation permettant aux indivi-dus de repérer le contenu qui les intéresse dans les médias sociaux. Les contributions de ce travail sont les suivantes :
• Une analyse approfondie des individus créant du contenu tendance dans les mé-dias sociaux ce qui permet de découvrir leurs caractéristiques distinctives ;
• Un nouveau moyen d’identifier le contenu tendance en s’appuyant sur la capacité des individus spéciaux qui le créent ;
• Un mécanisme d’élaboration de système de recommandation afin de personnaliser le contenu tendance ;
• Des techniques d’amélioration de la qualité des recommandations allant au-delà de la seule évaluation de la précision.
Nos études montrent le rôle vital de certains utilisateurs spéciaux dans la création de contenu tendance dans les médias sociaux. Ces utilisateurs avec leur sagesse permettent aux autres individus de découvrir du contenu tendance à leur goût. Notre travail contri-bue aux deux principales orientations de recherche : le contenu tendance dans les médias sociaux et les systèmes de recommandation.
Acknowledgements
This manuscript covers my research work at EURECOM as a PhD candidate. However, what it does not spell out are the good days and the great people happened to be there, without whom this thesis would not have been accomplished.
First, I would like to send a big and sincere thanks to my advisor Prof. Pietro Michiardi, who has opened me the door to research, and has supported me throughout the entire thesis with his passion of research, giving me the freedom to proceed in projects the way I like (and learn from my mistakes). Also, a special, enormous, thanks to Dr. Daniele Quercia and Dr. Matteo Dell’Amico, from whom I have received interesting discussions, great advices, big encouragement, and amazing inspirations. I am grateful to my jury, Prof. Ernst Biersack, Prof. Guillaume Urvoy-Keller, and Prof. Elena Baralis, as well as to all the anonymous reviewers who have been kind and patient to give valuable feedback. These years would not have been the same without the members (or ex members) of our group, Francesco Albanese, Mario Pastorelli, Antonio Barbuzzi, Daniele Venzano and Duy-Hung Phan, with whom I have shared the offices, the cluster, as well as the sour of fails and the sweetness of our successes. Beyond our group was the corridor, and my EURECOM friends, Leyla Bilge, Davide Balzarotti, Pierre-Antoine Vervier, Jako Fritz, Olivier Thonnard, Hadrien Hours, Andrea Lanzi, as well as the chinese community: Heng Cui, Lei Xiao, Kaijie Zhou, Juan Hao, Xuran Zhao, Rui Min, Xinping Yi, Xueliang Liu, Jinbang Chen, Jingjing Zhang, Qianrui Li, Shengyun Liu. Thanks to them, the jour-ney towards the completion of this thesis was full of joy. Special thanks to KuangTing Liu, Huiyi Chen Haiying Zhou, and Jianyi Huang, with whom, I have enjoyed the leisure time in shopping, dining out, some skiing, golf and the exercise called swimming that I still don’t know how to do.
A final thought to my husband Corrado Leita for his unconditional support and caring. I thank my family for their understanding. Last, I would also like to remember Alessandro Duminuco and Marco Paleari for having shared with me their wonderful journey to a PhD, and that inspired me into starting this challenge.
Contents
List of Figures xiii
List of Tables xv
1 Introduction 1
1.1 Motivations . . . 1
1.2 Research Problems and Contributions . . . 5
1.3 Organization of the thesis . . . 6
2 Background and Related Work 7 2.1 Trends in Social Media . . . 8
2.1.1 Identification . . . 8 2.1.2 Characterization . . . 10 2.1.3 Influentials . . . 12 2.2 Recommender Systems . . . 12 2.2.1 User Preferences . . . 13 2.2.2 Collaborative Filtering . . . 14 2.2.3 Evaluation . . . 17 2.3 Summary. . . 20
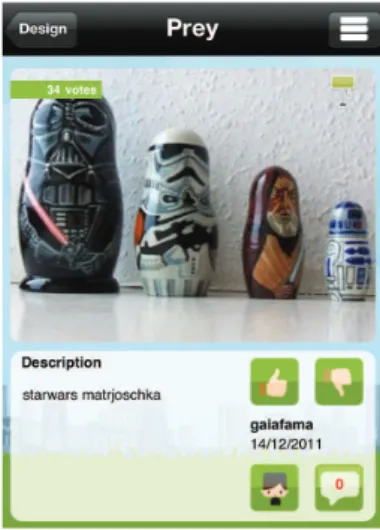
3 Who Creates Trends 23 3.1 Background on the Mobile Social Application . . . 23
3.2 Dataset . . . 25
3.2.1 Uploads and Votes . . . 25
3.2.2 Geography. . . 26
3.2.3 Following . . . 26
3.3 Identifying Trend Makers and Spotters. . . 28
3.3.1 Defining Trend Spotters and Trend Makers . . . 28
3.3.2 Characterizing Trend Spotters and Trend Makers . . . 30
3.3.3 Who trend spotters and trend makers are . . . 33
3.4 Predicting Trend Makers and Spotters . . . 35
3.4.1 Regression Models . . . 35
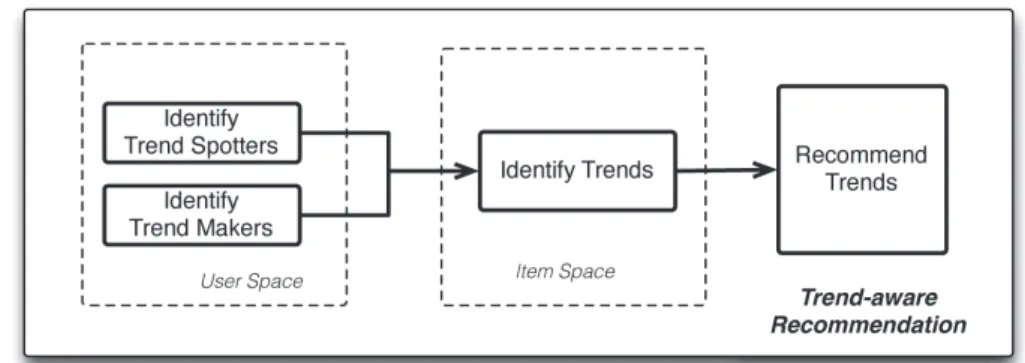
3.5 Discussion . . . 39 3.5.1 Theoretical Implications . . . 39 3.5.2 Practical Implications . . . 40 3.6 Summary . . . 40 4 Personalizing Trends 43 4.1 Background . . . 43 4.2 Trend-aware Recommendation . . . 44
4.2.1 Identify trend makers and trend spotters . . . 45
4.2.2 Identify Trends . . . 48
4.2.3 Recommend Trends . . . 48
4.3 Evaluation . . . 49
4.3.1 Classifying users into trend spotter(maker) classes. . . 50
4.3.2 Determining whether an item is a trend or not . . . 50
4.3.3 Recommending trends . . . 51 4.4 Discussion . . . 54 4.5 Summary . . . 56 5 Serendipitous Recommendations 57 5.1 Background . . . 58 5.2 Our Proposals . . . 58 5.2.1 Basic Algorithms . . . 59
5.2.2 Beyond User History . . . 61
5.2.3 Beyond User Routine. . . 62
5.3 Evaluation . . . 63
5.3.1 Evaluation Metrics . . . 64
5.3.2 Data . . . 65
5.3.3 Validating Modeling Assumptions . . . 65
5.3.4 Accuracy vs. Serendipity . . . 68
5.4 Discussion . . . 72
5.5 Summary . . . 73
6 Conclusion and Future Work 75 6.1 Thesis Contributions . . . 76 6.2 Future Work . . . 77 Bibliography 81 Appendix 90 A Synthèse en Français 91 A.1 Introduction . . . 91 A.1.1 Motivation. . . 92
Contents xi
A.1.2 Objectifs de la these et contribuations . . . 95
A.1.3 Structure de la these . . . 97
A.2 Qui Crée Les Tendances . . . 97
A.2.1 Identification de Trend Makers et Spotters . . . 97
A.2.2 Caractérisations des Trend Spotters et Trend Makers . . . 98
A.2.3 Prédiction de Trend Makers et Spotters . . . 100
A.2.4 Résumé . . . 102
A.3 Personaliser Les Tendances . . . 102
A.3.1 Trend-aware Recommendation . . . 103
A.3.2 Notre Expérimentes . . . 104
A.3.3 Résumé . . . 107
A.4 Recommendations à La Sérendipité. . . 107
A.4.1 Notre Proposition. . . 108
A.4.2 Evaluation . . . 111
A.4.3 Résumé . . . 113
A.5 Conclusion . . . 114
A.5.1 Contributions . . . 115
List of Figures
3.1 Screenshot of the mobile application. . . 24
3.2 (a) Number of uploads per user; (b) Number of votes per user; (c)
Distri-bution comparison on uploads and votes (log-scale on x-axis) . . . 26
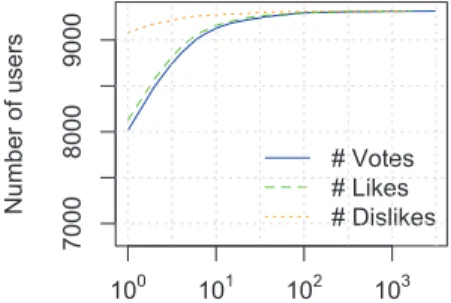
3.3 Empirical CDF of the number of votes, likes, and dislikes.. . . 26
3.4 Number of uploads from each country (Top 6) . . . 27
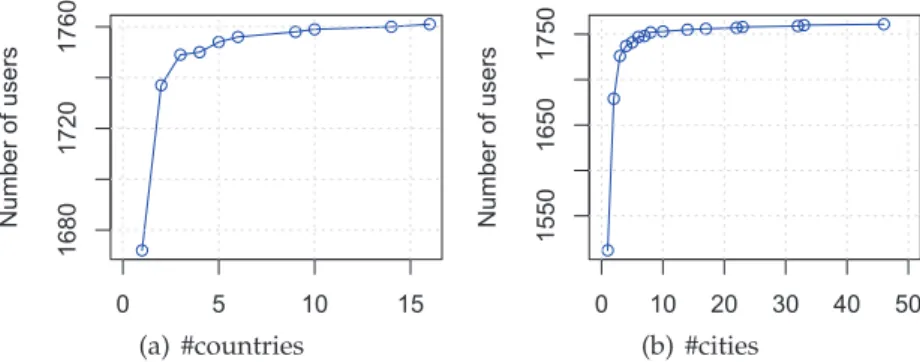
3.5 Empirical CDF of number of countries (cities) from where each user has
uploaded, with y-axis representing the cumulative number of users. . . . 27
3.6 Empirical CDF of the number of followers and followees. . . 27
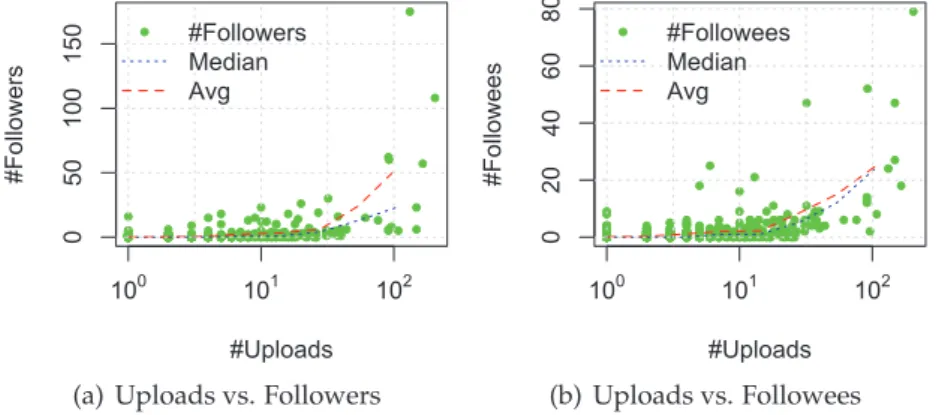
3.7 Number of followers(followees) and number of uploads per user . . . 28
3.8 Number of followers(followees) and number of votes per user . . . 28
3.9 Empirical CDF of spotter (maker) scores (log-transformed) versus top-n
ranked items. . . 29
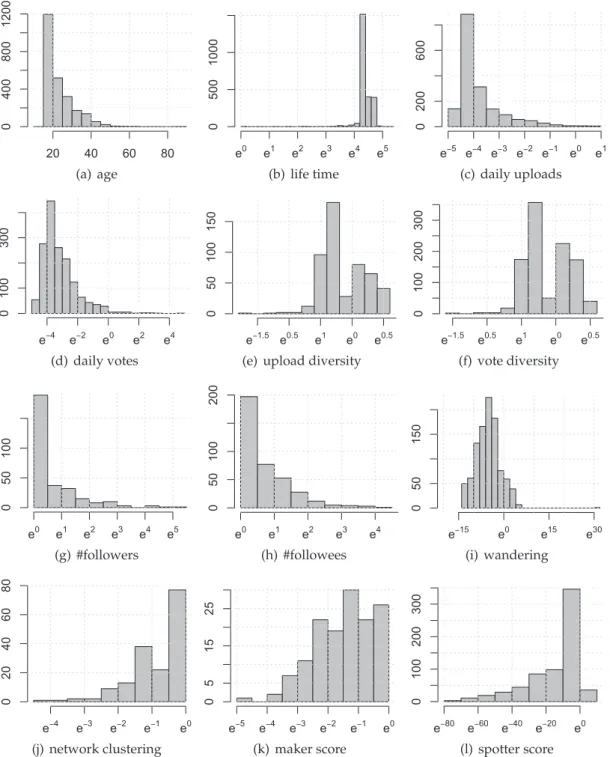
3.10 Distributions of features (a-j), trend maker (k) and trend spotter (l) scores with log-transformed values (except for the age feature). The x-axis repre-sents the range of log-transformed features, and the y-axis reprerepre-sents the
number of users. . . 32
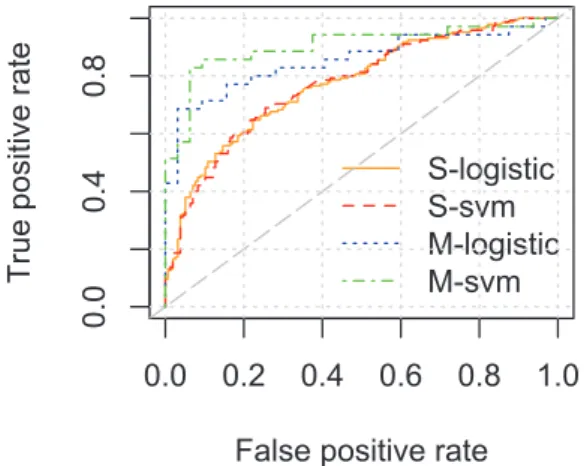
3.11 ROC curve of logistic regression and SVM model (S: trend spotters; M:
trend makers). . . 39
4.1 Trend-aware Recommender System . . . 44
4.2 Trend spotter score (log). We split trend spotters into three classes using a
proportional 3-interval discretization, as the two vertical lines show. . . . 47
4.3 ROC curve for the logistic regression that predicts whether an item is a
trend or not. . . 51
4.4 Precision and Recall. Results for trend-aware recommender vs. item-based
recommender. The size of the recommended list is N . . . 52
4.5 Precision and Recall. Results for two trend-aware recommenders
(item-based and Implicit SVD) and for recommendations of most popular trends. 53
4.6 Number of days an item (a) vs. a trend (b) receives votes for. . . 54
5.1 Probability of a user moving at a certain distance. . . 66
5.2 The distribution of a venue’s mixing (i.e., ability to attract all sorts of “user
tribes” among the k tribes) by category. Grey bars reflect the overall average
5.3 Probability of visiting venues by mixing value. . . 68
5.4 Percentage of Checkins per Hour of a Day. . . 69
5.5 Accuracy of the Bayesian model based on LDA . . . 70
5.6 Accuracy and Serendipity of (top 10) Recommendations. This considers
all users (i.e., users who visited at least two venues). . . 71
5.7 Accuracy and Serendipity of (top 10) Recommendations. This considers
users who visited at least 5 venues. . . 72
5.8 Accuracy and Serendipity of (top 10) Recommendations. This considers
users who visited at least 10 venues. . . 72
5.9 Impact of users with different tendencies for social mixing. . . 72
A.1 La courbe ROC de régression logistique et le modèle de SVM (S: trend
spotters; M: trend makers).. . . 102
A.2 Systeme de Recommendation Trend-aware . . . 103
A.3 Précision et Recall. Les resultats de recommandation trend-aware vs.
re-commandation item-based. Le N signifie le nombre de rere-commandations. 106
A.4 La précision et le recall. Les resultats de deux recommandations de trend-aware (item-based et Implicit SVD) et celui de recommander des tendances
de le plus populaires. . . 107
A.5 La précision et la sérendipité de (top 10) recommendations. Ils considèrent
tous les utilisateurs (i.e., des personnes qui ont visite au moins deux venues).112
A.6 La précision et la sérendipité de (top 10) recommandations. Ils considèrent
des utilisateurs qui ont visité au moins 5 venues. . . 112
A.7 La précision et la sérendipité de (top 10) recommandations. Ils considèrent
des utilisateurs qui ont visité au moins 10 venues. . . 113
List of Tables
2.1 Four possible outcomes of recommending an item to a user. . . 18
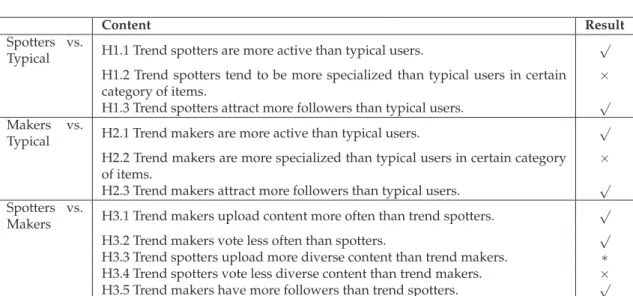
3.1 Our Hypotheses (√: accept hypothesis;×: accept the alternative
hypothe-sis;∗: unknown) . . . 34
3.2 Summary of Kolmogorov-Smirnov test results of our hypotheses.
D-values with significance level < 0.05 are highlighted and come with∗. M,
S and T stand for trend makers, trend spotters and typical users. We test a pair of distributions at a time - e.g., for S > T, we test whether the daily upload distribution for trend spotters is greater than that of typical users,
and report the corresponding D-value.. . . 34
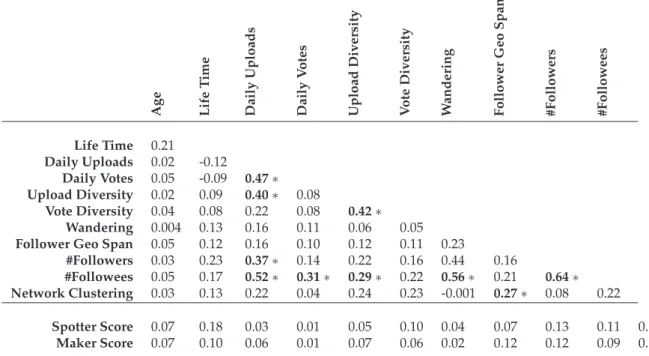
3.3 Pearson Correlation coefficients between each pair of predictors.
Coeffi-cients greater than±0.25 with statistical significant level < 0.05 are marked
with a∗. . . 36
3.4 Coefficients of the logistic regression. A correlation coefficient within 2
standard errors is considered statistically significant. We highlight and
mark them with *. . . 37
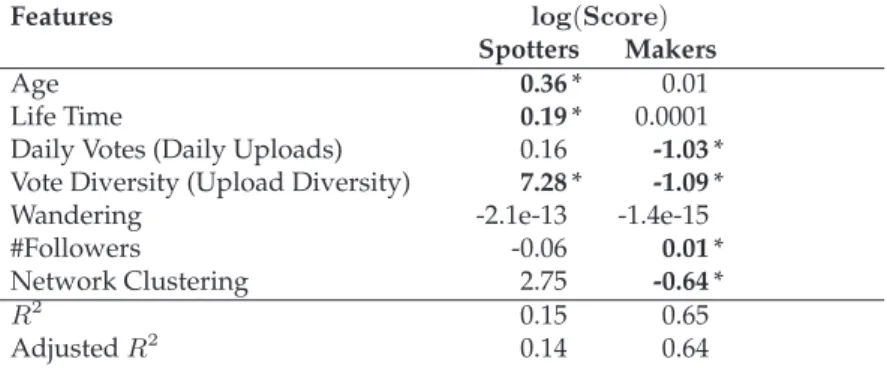
3.5 Coefficients of the linear regression. A correlation coefficient within 2
stan-dard errors is considered statistically significant. We highlight and mark
them with *. . . 37
3.6 AUC and best accuracy of each predictive model. . . 38
4.1 Coefficients of the logistic regression (a correlation coefficient within 2
standard errors is statistically significant. The significance levels are
marked with∗’s: p < 0.001(∗ ∗ ∗), p < 0.01(∗∗), p < 0.05(∗))) . . . 51
5.1 One’s unwillingness of traveling far to visit venues of each category. The
higher α, the shorter the trip to a venue for a given category. . . 66
5.2 Mixing of venues per category. . . 67
5.3 Accuracy and Serendipity of our three basic algorithms. For LDA in the
last model, the number of tribes k is set to 100 because of its best accuracy
compared to other k’s. . . 70
A.1 Nos Hypothèses (√: hypothèse accepté;×:hypothèse alternative accepté;
A.2 Résumé de les résultats de Kolmogorov-Smirnov test. Les values D avec
ses niveaux significatifs < 0.05 sont mis en évidence et sont livrés avec∗.
M, S et T représent les trend makers, spotters et utilisateurs typiques. Nous testons un pair de distributions a la foi - e.g., pour S > T, nous testons si la distribution de daily upload de spotters est plus grande que cela des
utilisateurs typiques, et nous rapportons le valeur D correspondant. . . . 99
A.3 Coefficients de régression logistique. Un coefficient de corrélation dans les 2 erreurs standard est considéré comme statistiquement significatif. Nous
les soulignons et marquons avec *. . . 100
A.4 Coefficients de régression linéaire. Un coefficient de corrélation dans les 2 erreurs standard est considéré comme statistiquement significatif. Nous
les soulignons et marquons avec *. . . 101
A.5 AUC et le meilleure précision de chacun modèle de prédiction. . . 102
A.6 La précision et la sérendipité de nos trois algorithmes de base. Pour LDA dans le dernière modèle, le nombre de user tribes (k) est fixé a 100, en
C
HAPTER1
Introduction
That the majority of people are building an online society is an obvious fact.
Social networks are growing beyond being the playground where connecting is the only purpose. It is more a phenomenon that we are enthusiastic about. As a phenomenon, we are ready to share all sorts of information (e.g., photos, parties, alimentation, gossips, political discussion, etc.) along our connections. Through social networks, we also orga-nize social events, e.g. meetings, parties, club activities and even political campaigns. In short, we continue to migrate offline activities to social networks.
This “social” phenomenon with its rich collection of our online behavior has certainly attracted lots of research interests. Many different questions were raised, but solutions were sought particularly by understanding aggregated user behavior and information diffusion along network connections. People noticed that when information is propa-gated along connections, some is more widely adopted than others, and some is spread faster. Moreover, there is a moment that these information reach the critical mass all of a sudden. Such a moment is the so-called “tipping point”, defined by Gladwell in [39]. In this Thesis, we present our studies about digital content that triggers the “tipping point” in online social networks. We call such content trending content - trends for short - in the following chapters. Specifically, we study the human factors behind the creation of trends, and, we design a system to provide people early discovery of trends that they might be interested in.
1.1
Motivations
Formally, a trend is defined as any form of behavior that develops among a large population and is collectively followed with enthusiasm for some period, generally as a result of the behavior’s being perceived as novel in some way [62]. Two primary properties of trends emerge from the
definition: broad adoptions and temporal effectiveness. These properties are the key factors that social marketers and researchers have shown great interests in identifying trends. It is vital to identify trends in social networks, because knowledge about trends can be translated into event identification, opinion spreading, brand management, etc. These concepts are similar to each other in that they are widely adopted and spread fast. To clarify the role that the term “trend” plays in different scenarios, we elaborate with some examples. • Event Identification. A trend is an event. An example comes from Twitter.1 People
tweet about what they see or what they encounter. It can be big global events such as the Olympic games, or small local ones such as neighborhood gatherings. In 2009, an Editor in Chief at Mashable - Adam Ostrow, observed that “earthquakes are one thing you can bet on being covered on Twitter first, because, quite frankly, if the ground is shaking, you’re going to tweet about it before it even registers with the USGS and long before it gets reported by the media2”. Indeed, that happened for the 2009 Japan earthquake: tweets about the earthquake have travelled around the world much quicker than the official media reports of its occurrence. This has inspired and motivated many researchers to identify real-world events by keeping track of information diffusion in social networks [13,14,63,103].
• Opinion Spreading. A trend is a piece of opinion. Examples are comments to news threads, reviews to shopping items, and political or societal discussions are all dif-ferent types of opinions that spread in the Internet. Borge-Holthoefer et al. [18] have studied a particular case - the discussion of 15-M movement invoked by economic crisis in Spain in 2011. By collecting Twitter messages (tweets) for one month (ap-proximately from two weeks before the movement till a week after it took place), they noticed that the “movement-in-the-making had been brewing for a while in the so-cial media” [18]. Hashtags related to the discussions of camping the Puerta del Sol square in Madrid have been mentioned by tons of tweets, and the underlying “fol-lowing” and “followers” structure in social networks have pushed their reach of receivers much further. Understanding how opinions are spread is undoubtedly of great importance. In addition to its impact on societal and political opinions, Wu et al. [127] have also studied how public opinions form in online voting and review systems.
• Brand Management. A trend is a fashion fad. Jansen et al. proposed to use micro-blogging as online word-of-mouth branding [54]. They stated that in commercial situ-ations, a positive word-of-mouth branding has strong effect on consumers, since it is based on the trust built upon social relationships. Coupled with sentiment anal-ysis, their studies of tweets collected for 13 weeks show that user satisfactions with the brands change with time: these changes are correlated with the word-of-mouth spreading. Motivated by such word-of-mouth effect, researchers also proposed to 1http://www.twitter.com
1.1. MOTIVATIONS 3
leverage social blogs in new product development [36], as well as the early predic-tion of customers’ reacpredic-tions [17].
Having discussed that various types of “trends”, which all receive a burst of attention at a certain time and require people to react fast, a natural question to ask is the following:
How to Detect Trends?
To react fast, we have to be aware of trends sufficiently early. However, capturing a trend before its “tipping point” is hard. Great research efforts have also been spent on characterizing trends. Most of the devised solutions are built upon the fact that trends result from aggregated user behavior. In other words, the main signal of the birth of a trend is the intensive responses from people. Therefore, many studies have been carried out to study trends from different user reactions, namely:
• Clicks. A click, on the Web, is a basic reaction that indicates implicitly our interests. Learning from the aggregated clicks in the video sharing site YouTube,3 Crane et
al. [28] identified different patterns of aggregated clicks associated to different types of trends. Relying on these clicks patterns, one can tell exogenous trends (those triggered by factors external to the site, e.g. reporting of a piece of news on TV) from endogenous ones (those triggered by internal factors, e.g. spreading of a piece of news within the site).
• Posts/Retweets. Posts or retweets activities are more explicit and proactive than clicks. They show explicitly one’s willing to spread the content. Crawling trending topics from Twitter and associating them with related tweets, Nikolov [81] pro-posed a statistical nonparametric classification method to capture trending topics by learning their time series pattern of tweeting rate.
• Content. Direct analyses about the content of trends are also studied with a certain granularity. An example of exogenous trends as news disseminating in Twitter, is that these tweets often contains an url pointing to the external media site where the news was reported [77].
• Social Connections. “Following” and “followers” are the fundamental function-ality provided in any social networks. Thanks to these social links, information flows from one to another. Intuitively, people who establish many links have better chances to propagate content to others; this is the case that generates endogenous trends such as celebrities’ gossips [77,130].
Knowing the characteristics of trends is of great help to detect trends. But, unveiling how do trends evolve with human dynamics can provide people (e.g. social marketers) the
knowledge of who create trends. To this end, searching “influentials” within the network becomes the central theme.
Who are Influentials?
The fundamental theory of “influentials” goes back to the two-step flow paradigm pro-posed by Katz and Lazarsfeld in 1955 [64], which was originally formulated to under-stand how public opinions form. It says that the information diffusion cascade is “a process of the moving of information from the media to opinion leaders, and influence moving from opinion leaders to their followers” [20].
For decades, the two-step flow theory had been dominant in the research of information diffusion processes. Their definition of opinion leaders has been well accepted and later on also adopted as the definition of influentials [73]. That is, influentials are those individuals who are likely to influence other persons in their immediate environment [64].
Modern studies about influentials (especially with the easy access to information diffu-sion traces in online social networks) have developed two different opinions.
• Influentials are special individuals. Adhering to the two-step flow theory, re-searchers in this group believe that influential individuals are different from the crowd to some extent. Gladwell in his book The Tipping Point states that “the suc-cess of any kind of social epidemic is heavily dependent on the involvement of people with a particular and rare set of social gifts” [39]. He identifies three actors as special indi-viduals who created social epidemics (trends), that is connectors (those who know many people in the community), mavens (information specialities) and salesman (persuaders). By modeling and analyzing information diffusion in social networks, researchers have confirmed the existences of these different types of special indi-viduals who are able to spot trends early on [64,101]. These special individuals are socially well connected (connectors) [57]; are able to easily influence others (sales-man) [45]; are considered to be experts (mavens) [113,125]; or are celebrities [130]. • Influentials can be anyone. Duncan Watts claims that being influential is mostly an
accident of location and timing [10, 121]. It is a matter of adopting correct opinions at a correct moment, regardless of who you are. Also, he stated that the influentials are not necessarily “head of formal organizations, nor public figures such as news paper columnists, critics, or media personalities, whose influence is exerted indirectly via orga-nized media or authority structures” [122]. To highlight the concepts of unexpectedness and unplanned, the individuals who are involved in the diffusion of trends are then called as “accidental influentials” [121].
We have seen that identifying trends can be translated to event identification, opinion spreading, brand management, etc. A variety of studies of trends are performed with two themes. That is, 1) what are trends; 2) who creates trends. We have given a brief overview about how people try to detect trends by their characteristics, as well as the debate on
1.2. RESEARCH PROBLEMS AND CONTRIBUTIONS 5
whether the individuals who create trends are special (more detailed background and related work please refer to Chapter2). Next, we define our research scope of this Thesis and position our contributions with respect to the literature on trend exploration and the associated tools at our disposal.
1.2
Research Problems and Contributions
We have stated that trends result from aggregated user behavior. They are pieces of infor-mation that are disseminated in the network and obtained a wide coverage of adopters. Unsurprisingly, the notion of diffusion within the network is the focus. However, the complete process of the birth of a trend should also include the creation of the informa-tion itself. It is an undeniable fact that people who create the informainforma-tion (who initially bring it into the network) are an important filter to the information from the outside of the network.
Considering both the creation and the diffusion process of trends, there are some questions that still need a clear answer. These quesquestions are raised from three main aspects -human factors behind trends, identifying trends and exploring them.
• Human Factors. In spite of the debate on influentials, the human dynamics of in-dividuals who create trends (no matter whether they are special) are still unclear. Considering both the individuals that originally bring the information to the net-work and the ones that spread them, what are their characteristics? Do they share any common traits and what are their differences?
• Identification. Knowing the characteristics of people who create trends, is it possi-ble to identify trends by leveraging their knowledge? To which extent trends could be identified accurately as such?
• Exploration. Suppose that we are able to precisely identify trends. How can we build upon this ability to help users discover the trends of their interests? To the end of providing such personalized content exploration, how to guarantee the quality of the personalizations?
In this Thesis, we are going to tackle these questions in steps. In the course of seeking the answers, we make the following contributions:
• We approach the analysis of who creates trends by defining two distinct classes of individuals: trend spotters (those who rate items before they become trends) and trend makers (those who upload items that become trends). We characterize them by combining multiple characteristics including their activity, content, network and geographical features. We find that trend spotters and trend makers differ from typical users, in that, they are more active, show interest in a variety of items, and attract social connections. We then study what differentiates trend spotters from
trend makers. We learn that successful trend spotters are early adopters who hold interests in very diverse items, while successful trend makers are individuals of any age who focus on specific types of items (Chapter3).
• Using linear regression, we predict the extent to which one is a trend spotter or trend maker. Then, with an existing machine learning algorithm (SVM) and with a logistic regression, we perform a binary classification of whether one is likely to be a trend spotter (trend maker) or not. While linear regression has produced informative results, SVM and logistic regression have returned accurate predictions (Chapter3).
• We propose a method that detects trends by relying on the activities of two types of users: trend makers and trend spotters. We then construct a preference matrix based on the identified trends, and test the extent to which a state-of-the-art matrix factorization algorithm (Implicit SVD [51]) effectively recommends trends (Chap-ter4).
• Going beyond the goal of making accurate recommendations, we explore the pos-sibility to enrich serendipity in final recommendations by leveraging network anal-ysis techniques, and validate our proposals in the context of a location-based mo-bile recommender system. To be precise, we tackle the possibility of introducing serendipity by promoting places that go beyond those that would be recommended based on past visited places and on one’s typical routine. We quantitatively evalu-ate to which extent we are able to introduce serendipity without compromising the accuracy of the recommendations upon the real-world dataset (Chapter5).
1.3
Organization of the thesis
Chapter 1has spelled out our research problems.
Chapter 2gives the background of our work from two principal related research direc-tions, i.e., trends in social medias and recommender systems.
Chapter 3differentiates trend makers and trend spotters from typical users, characterizes them and experimentally shows that they can be accurately predicted with a variety of features.
Chapter 4proposes a recommender system to satisfy people with personalized trending contents.
Chapter 5 leverages network analysis techniques to introduce serendipity into recom-mendations.
Chapter 6concludes our research work and summarizes our contributions to the state-of-the-art.
C
HAPTER2
Background and Related Work
The concept of trend is tied to abrupt spikes in the attention toward a specific item or concept. Such a property underlines how the term of trend can be generalized to a variety of related concepts in the literature, e.g. events, opinions, topics, social memes, etc. This Chapter aims at providing an overview on the current state of the art on trend modeling and identification.
We have motivated our research work in the previous Chapter through its impact on event identification, opinion spreading and brand management. In this Chapter, We first provide a broad overview of the literature related to the concept of trends (Section2.1). We identify two main approaches to the problem of trend identification and analysis: approaches to identify spikes of interest inherent of the nature of a trend, and approaches to study their overall characteristics. Finally, trends are produced by aggregated user activities, and the human role in the generation of trends has been the subject of debate in the scientific community. In Section 2.1.3 we will review the debate on the role of “influential” users in the generation of trends.
One of our main research objectives of this work is to help users discover and consume trends. After having studied and understood the mechanism behind the generation of trends, we will therefore focus on the problem of identifying trends of one’s interests. This type of problem is analogous to that of making personalized recommendations. In Chapter 4, we study how to recommend personalized trends by leveraging the power of the crowds by using collaborative filtering techniques. We review in this Chapter (Section 2.2) the current state of the art in collaborative filtering techniques developed in recommender systems and their applications, tools that will be later used as building blocks to our work.
2.1
Trends in Social Media
The general topic of studying trends in social media has received considerable interests by the research community, motivated by the demand of understanding viral marketing, opinion spreading, and event and topic identifications. We review relevant studies on trends from two aspects: 1) how to identify trends; 2) what are the characteristics of trends.
2.1.1 Identification
The sharp increase in user interest is generally regarded as a signal for identifying trends. In the literature, capturing such bursts of interests is one of the main research approaches to the problem of trend identification, and most related work is built upon time series analysis and modeling. Depending on the types of content, different approaches are pro-posed to identify bursts in social media. For instance, text mining techniques have been widely explored when the content is text, e.g. news streams. When dealing with other types of content such as pictures and videos (whose content is more complex and costly to mine), the identification of trends relies instead more often on the dynamics of the user activities or interactions (e.g. posting, replying, forwarding, viewing, commenting, etc.).
Text mining
Text mining techniques are commonly applied in detecting and tracking emerging topics in news streams. Mostly, they are built upon word segmentation and topic modeling. To identify trends in general topics, Kleinberg developed a framework to describe the time stream of the frequency of words with a finite state automaton, in which the bursts could be signaled at the state transitions [58]. His further analyses on the burst patterns of the terms reveal that the mixture of these “trending” terms form a latent hierarchical structure that has a meaning - that is, a topic. Therefore, the detection of trending terms could contribute to the identification of trending topics. Kleinberg’s model describes the temporal change of co-occurrence of words, which can be viewed as the topic change over time. Instead, the approach proposed by Wang and McCallum assumes that topic itself does not change (i.e., the term mixture of a topic), while the topic co-occurrence patterns of documents change over time [119]. With a different granularity of pattern mining over time, their approach exhibits a better performance on the trending topic identification. Both of the previous approaches focus on mining trending topic from a single text stream. But in some cases, different data streams may cover the same topics. Such situation is commonly seen in the applications of news media. When a major event happens, the same news could be reported by multiple news agencies, and thus are disseminated through multiple news streams. Wang et al. discover that the bursts of related topics from different media triggered by the same events are correlated from the temporal
as-2.1. TRENDS IN SOCIAL MEDIA 9
pect [120]. By mining such correlated bursty pattern, the authors show that it is possible to identify global trending topics across multiple news streams regardless the language used in the stream. Moreover, such bursty pattern could tell the local trends apart from the global ones.
While these models have been successful at identifying trending topics in news media, in a larger scale, Leskovec et al. studied the information dissemination of news cycling, in which information does not stay “locked” within its news media, but gets propagated to social medias like blogs through the user interactions among different web services [66]. By quantitatively analyzing millions of articles collected from over one million media sites and blogs, they found that there exist competition among individual “memes” (i.e., trending topics in the news streams) to become the trends. The fact that such competi-tion occurs is likely associated with another findings from their studies, which states that different news agencies are very close to each other on what to report and when to pub-lish. On the level of local news trends, the authors observed that the volume of attention decreases exponentially in both direction from the peak of its bursts (i.e., both prior to and after the peak). Additionally, another notable phenomenon they found is that for the same story which becomes a trend, the time it gets trendy in blogosphere is in average 2.5 hours later than in news media stream.
Overall, trends and topic identification in news and blogosphere has been widely studied by text mining. Diverse probabilistic models have been built above the mixture of terms to successfully capture the temporal dynamics of the trends [3,15,40, 47,58,119,120]. When applying similar analysis to social media content, because of the limited size of the content (e.g., Twitter), the approach to detect bursts usually can be simplified and applied to the identification of terms that appear in a certain time period much more frequently than expected [14,77,78,90].
User activity and interactions
The approaches to identify trends based on text mining work well when the entity of trends are textual content, e.g., news and blogs. However, the Internet enables increas-ingly rich approaches for sharing information that go beyond simple text. Mining in-formation out of an image, or a video, can be extremely expensive and this renders the application of similar mining approaches to these formats more costly. Especially when analyzing the heavily used social medias, the identification of trends may need to build upon different types of information such as the way in which the mass of users respond to them.
When looking at the dynamics of the aggregated user activities and at the response time, researchers have documented two opposing behaviors. The reaction to trends has in fact been shown to be either completely random, or highly correlated with the activities of others [12,46,118]. When looking at the latter case, researchers have distinguished between trends generated by highly correlated user activities within the user community
and those that are resulted from other factors outside the community. This has led to the respective definition of endogenous and exogenous trends [28,108].
To sort out the bursts of user activities of different types (i.e., endogenous or exogenous trends), Crane and Sornette have analyzed the time series of daily viewing patterns in YouTube1 (an online video sharing service) [28]. Their studies reveal that the distribu-tion of the waiting time before the user’s response to the videos is sufficient to describe the different burst patterns for endogenous and exogenous trends. More precisely, in the case of endogenous trends the burst of attention is preceded by a smooth increase, associated to the gradual spreading along the social connections within the community. In the case of exogenous trends, instead, the burst happens shortly after the upload of the videos. These immediate peaks of attention are triggered by factors that are external to the social media, e.g., reporting of a piece of news on TV, and they thus bypass the social interactions. Similarly, to capture the trending hashtag/topic in Twitter, Nikolov et al. proposed a non-parametric classification algorithm to learn the temporal pattern for the tweeting rate of trending hashtags/topics, and succeeded to capture the trends approximately half an hour before the topics were shown as trends on Twitter [81]. In addition to the work on identifying trends by catching the bursts of user activities, re-searchers have attempted to understand the descriptive and comparative characteristics of trends. Such studies were widely done in the context of micro-blogging social media like Twitter.
2.1.2 Characterization
Rather than focusing on the identification of trends, a parallel branch of research has focused on leveraging trends to extract insights from social media (e.g. predicting large-scale events) [14,77,130]. In general, researchers have attempted to gather a better un-derstanding of trends by means of descriptive and comparative analyses, often focusing on trends or content related to real-life events in Twitter.
Generic studies on trends
People tend to tweet about real-world events prior to the traditional news media [63,
89,103]; this fact led several research efforts to attempt to analyze the trends and events identified in Twitter. To estimate the location of an earthquake or the trajectory of ty-phoon, Sakaki et al. have studied social, spatial and temporal characteristics of earth-quake/typhoon related tweets [103]. By analyzing the early messages associated with an event, Petrovic et al. [89] discovered that the number of users who tweet about the event is more indicative than the volume of the tweets written about the event.
2.1. TRENDS IN SOCIAL MEDIA 11
Looking at local news events, Yardi et al. [129] studied the characteristics of messages related to them, and those of the users who posted them. They found that active users who are in the center of the online network are more likely physically centered around the local events. They also found that the local networks are denser than the global one, so that local news sources and the people who witnessed the local events are more efficient at spreading the events.
Focusing instead on a more global scenario, that of the trending topics in Twitter, Kwak et al. [63] have analyzed tweets of top trending topics from the temporal behavior and user participation. These trending topics were mostly news headlines and user response to fresh news, and were found to be active for durations of a week or shorter. Long-lasting trending topics did not always have new users joining the discussion. Similar temporal characteristics were found in [9] as well. Asur et al. discovered that trends in Twitter were determined by the retweets from other users instead of users who posted them originally, and were more related to their content instead of the characteristics of users [9].
Studies on categorized trends
As we have reviewed in the previous section, in a social media site, there are two types of trends - exogenous (if trends are caused by factors external to the social media) and endogenous (if trends are created because of factors within the social media). These two types of trends have been shown to exhibit different temporal patterns of waiting time (i.e., the duration of time before user respond to the content) [28]. Exogenous and endogenous trends with their distinguishable temporal patterns were also observed in Twitter [63]. Among all the identified trends, the authors found larger percentage of ex-ogenous trends (e.g., headline news) than endex-ogenous ones. Focusing on Twitter data from a metropolitan area (New York City), Naaman et al. separated trends into different groups by refining the original exogenous and endogenous categories [77]. Their work suggested that even within the same category of trends, different types of trends existed and could be distinguished from a rich set of features - content, user interactions and social networks [77]. Based on the differences lying in these features for different types of trends, Becker et al. then used clustering techniques to distinguish real world events from non-events messages in Twitter [14].
While a large percentage of trends in Twitter were found to be exogenous, and were news stories in particular, Yu et al. have explored the trends in weibo (Twitter-alike service in China), 2 and found trends in China were mostly created due to the retweet of content such as jokes, images and videos, and were thus mostly endogenous [130].
2.1.3 Influentials
In addition to trend analysis and identification, researchers have also looked at the indi-viduals behind them and have tried to investigate the process of the generation of a trend. Research efforts to answer this question intersected with the studies on opinion forma-tion and informaforma-tion disseminaforma-tion in social networks. Mainly, there are three different views on the trend creation process.
Special individuals
The first vision sees trends as generated by influentials. In his popular book “The Tipping Point”, Malcolm Gladwell argued that the creators belong to the “special few”, and are often called “influentials” [39]. These influentials are found to be special kinds of individ-uals who: are able to spot trends early on [39,64,101]; are socially well connected [57]; are able to easily influence others [45]; are considered to be experts [113, 125]; or are celebrities [130].
Accidental influential
The second view on trend creation sees trends as generated by coincidences: anyone can be influential. As a result, what becomes popular in a network does not depend on the initiators and is thus an accidental process. Duncan Watts uses the terms “accidental influentials” as he considers social epidemics to be “mostly an accident of location and timing” [121], and ideas spread and ultimately become popular only if there is societal willingness to accept them.
Combined process
Lately, researchers have found that there are different classes of individuals who con-tribute to two parallel processes: early participants start contributing and thus create random seeding, and that contribution spreads then through low threshold individu-als [8,44]. Based on this recent literature which has focused on the two parallel processes, our work in this Thesis will take a close look at the individuals who contribute to those processes.
2.2
Recommender Systems
Good user experience is what makes online services enticing. To be outstanding, many services not only try to provide easy access to the content of what users are looking for,
2.2. RECOMMENDER SYSTEMS 13
but also attempt to help them discover new information which they might be interested in. Mostly, these services use recommender systems to give personalized suggestions to each user [99,100]. Depending on the context of the applications, recommended items are of all kinds - e.g., books, CDs [69], movies [5,135], videos [32], news [31], music [133], events [95], places [134], search keywords [67], social connections [23] etc. However, the fundamental idea of all these recommender systems is the same, that is, to seek relevant items into one’s preferences. In general, two essential components are needed to con-struct a recommender system: 1) user preferences; and 2) algorithms.
2.2.1 User Preferences
To make personalized recommendations that are highly likely to be accepted by the end user, understanding one’s preferences is evidently of great importance. Depending on the applications, user preferences can be collected in two ways: through explicit or implicit ratings.
Explicit Ratings
To obtain explicit feedbacks, users are asked to rate items on a Likert scale (e.g., on a scale of 1 to 5 points) depending on the degree of their preferences. For example, the online e-commerce platform Amazon 3 collects customer reviews about products on the scale of one to five stars [69], and similar Likert scaled feedbacks are also collected in movie recommender system MovieLens [74]. But, the user self-expressed ratings were found not as robust to quantify their real preferences as expected [6]. Users might report incon-sistent ratings because of the impacts of environment, and thus introduce noises into the user preferences [6,55,83]. To reduce such inconsistencies, some services simplify the explicit rating to a single “thumb up” if a user likes an item, e.g., YouTube [32].
Implicit Feedbacks
Explicit ratings are not always available in all the applications. When they are missing, an alternative to infer one’s preference is to extract his/her implicit feedbacks. Implicit ratings could be obtained by measuring different user behaviors [82, 114], depending on the items to recommend. Binary implicit ratings only formulate whether one likes an item, and the user behavior to indicate such “likes” include a purchase [69, 97], a click [114], the fact of joining a community/group [24], etc. The numerical values of explicit feedbacks requires finer grained information about user behaviors, which often tend to describe the frequency of actions [51]. For instance, it could be how much time the user watched a certain show [51], how often a user listens to an album [87], etc.
Implicit preferences inferred from user behavior are inevitably noisy, but they provide the confidence of the fact the users like an item [51]. For instance, by performing user studies in the context of music consumption, the time one listens to an album is shown to be clearly correlated with the explicit ratings from the user [87].
2.2.2 Collaborative Filtering
There are a variety of algorithms designed for recommender systems of all kinds. In the literature, Adomavicius et al. [2] provided a comprehensive overview about the state of the art of the algorithms by grouping them into content-based, collaborative filtering and hybrid approaches, as well as the pros and cons of each group, while Su et al. [110] conducted a survey dedicated to collaborative filtering techniques in particular. Instead of giving yet another overall review of these diverse algorithms, in this section, we will focus on two notable collaborative filtering algorithms (i.e., item-based and SVD) that are often used as baseline in the field, which will be also applied later on in our work (will be presented in Chapter4and Chapter5).
As classified in [2], there are three groups of algorithms designed for recommender sys-tems - content-based methods, collaborative filtering techniques and hybrid approaches. Among them, collaborative filtering techniques are the most successful ones [110]. Col-laborative filtering is a term coined from the first recommender system Tapestry [42], and is meant to “helping people help each other” [115]. Its main idea is to leverage the “the wisdom of crowds” [111] and recommend items that people with similar tastes and preferences liked in the past [11]. A typical collaborative filtering based recommender system takes the user preferences ratings (explicit ratings or implicit ones inferred from user behaviors) as input, and outputs/predicts the missing preferences (i.e., ratings on not yet consumed items). Items are then sorted according to the predicted ratings, and top N ranked items are returned as recommendations (known as Top-N Recommenda-tions). Depending on the way to predict the ratings, two types of collaborative filtering techniques are spotted - memory-based and model-based approaches.
Memory-based
Memory-based approaches [19, 34, 35, 65, 98] predict ratings based on the entire col-lection of previously rated items by the users [2]. The most common memory-based approaches are k-nearest neighbor models, and the original model is user-based [48] ap-proach. Such user oriented approach tries to predict missing ratings based on the ratings from like-minded users. Due to its better scalability and more accurate predictions, an analogous approach but item oriented (known as item-based approach [104]) are better adopted in practice than user-based. The item-based approach makes recommendations in two steps: 1) computing similarity between items; 2) predicting missing ratings by aggregating user preferences on similar items. Items are then sorted by their predicted
2.2. RECOMMENDER SYSTEMS 15
ratings in the descending order. The top N ranked items are commonly output as final recommendations.
Computing Similarity. Similarity computation is the critical step to find the k-nearest neighbors of the items that one likes. The similarity between each pair of the items should be examined, and it could be determined by user preference ratings. There are a number of ways to compute the similarity si,j between item i and item j. Popular ones include
cosine-based, correlation-based and adjusted cosine similarity.
User preferences ratings are commonly used to construct a preference matrix, in which each row corresponds to a user, and each column is an item. Each element of the matrix describes one’s preference towards the corresponding item. Under such formulation, item i and j can be thought as two vectors in the user space. Therefore, the cosine of the angle between these two vectors can be viewed as their similarity si,j:
si,j = cosine(~i,~j) = ~i ·~j
||~i||2× ||~j||2
(2.1)
Another widely adopted method to measure similarity is the Pearson Correlation Coeffi-cient, which measures the degree of linearity on the intersection of the pair of item pro-files. To make the correlation computation accurate, it’s better to focus on ratings from the set of users (U) who co-rated both of the item i and j [104]. Then, the correlation-based similarity could be computed as:
si,j =
P
u∈U(ru,i− ¯ri)(ru,j− ¯rj)
pP
u∈U(ru,i− ¯ri)2pPu∈U(ru,j− ¯rj)2
(2.2) where ru,iis the rating user u gave to item i, and ¯riis the average rating item i received.
Counting that users may have different rating scales - some may prefer to give neutral feedbacks then extreme “likes” or “dislikes”, an adjusted cosine similarity measurement is also proposed to offset such situation by subtracting the corresponding user average rating from each co-rated pair [104]:
si,j =
P
u∈U(ru,i− ¯ru)(ru,j− ¯ru)
pP
u∈U(ru,i− ¯ru)2pPu∈U(ru,j− ¯ru)2
(2.3) in which ru,i is the rating user u gave to item i, and ¯ru is the average rating that user u
used to give.
There are also other ways to compute similarities (e.g., Jaccard similarity, Euclidean dis-tance, etc). Different similarity measurement metrics may lead to different effects in rec-ommendations, and one may outperform another in different datasets.
Predicting Ratings.Once the most similar items are identified, we need to predict ratings of unrated items for each user. To predict the rating ru,kthat user u might give to unrated
item k, the most common way is to aggregate u’s ratings towards the set of similar items (N ) of k. And, the rating ˆru,k could be predicted as the weighted average of ratings on
nearest neighbors:
ˆ ru,k =
P
i∈N(si,k× ru,i)
P
i∈N(|si,k|)
(2.4) Items are then sorted according to their predicted ratings, and the Top-N are returned as recommendations. With item-based approach, what user receives as recommendations are the items that are similar to what they ever liked. The easy explanation of why one receives the list of recommendations as such, has also contributed to its success.
Model-based
In contrast to memory-based models which are based on the entire user ratings, model-based approaches use a sample dataset constructed from a subset collection of rat-ings. Typically, for these algorithms, a learning phase is dedicated to learn user pref-erence/rating models, which then are used to make predictions about user preferences on unrated items. In the literature, research efforts tried to model the user preferences using data mining or machine learning algorithms [110].
One of the problems that recommender systems face is data sparsity. That is, the number of items rated by each user is always a small portion with respect to the full set of items in the application. The unrated user-item combination results is a sparse preference matrix. A prominent algorithm to address such problem is based on matrix factorization, which is often built upon dimensional reduction techniques - such as Singular Value Decompo-sition (SVD) [105].
As addressed in [4], the key of an SVD decomposition of a matrix is to find a new lower dimensional feature space, in which each feature represents a “concept” and the impor-tance of each of the concept is eligible to be computed. Applying SVD decomposition on a preference matrix (R) with n users and m items in a recommender system, is to find two descriptive matricesU (n × r) and V (r × m) for a given number of new features r, that can be used to approximate the original preference matrix in a lower dimensional feature space:
R = UλVT (2.5)
in which λ is a diagonal matrix that contains singular values (which represent the semi-axes of the r-dimensional ellipsoid of the “concept” space). TheU matrix can be inter-preted as the “user to concept” similarity matrix, while theV matrix is the “item to con-cept” similarity matrix.
By uncovering the user-item latent relationships with “concepts”, there are two different ways to use the decomposed matrices in making recommendations [105].
2.2. RECOMMENDER SYSTEMS 17
• In the low dimensional feature space, one could measure similarity between each pair of users (or items) to identify the k-nearest neighbors in that reduced space. Therefore, memory-based recommender systems can be further applied.
• Relying on the decomposed matrices, the ratings for a user to an item can be de-scribed as the dot product between the user’s feature vector (U) and the item’s feature vector (V). In other words, for a user u and item i, the predicted rating ˆru,i
is: ˆ ru,i= r X f=0 Uu,f × Vf,i (2.6)
There are other matrix factorization techniques (e.g., Principle Component Analysis -PCA) [43], and their different variants such as the Non-negative Matrix Factorization have also been used in the literature [128]. These algorithms are similar to SVD in the sense that they all aim to decompose the ratings matrix into two matrices, one of which contains features that describe the users and the other contains features describing the items.
We have seen that the basic process to build a recommender system requires two steps: 1) extracting user preferences from their explicit ratings or by inferred from user behaviors; 2) choosing an algorithm to predict user preferences on unrated items. The decision about which algorithm to use is difficult to make without any performance metrics to optimize for. Next, we take a brief look at how recommender systems are evaluated.
2.2.3 Evaluation
The performance of recommender systems is difficult to evaluate, because 1) an algo-rithm may perform differently depending on the datasets; 2) the goal that a recommender system is expected to achieve differs from one application to another [49].
The main stream of algorithms handle the task of making personalized recommendations as solving the problem of predicting ratings. To evaluate how well an algorithm is able to make such predictions, an experimental dataset is often required and it gets split into two parts - a training and a testing subset. While the algorithm learns user preferences from the training set, it tries to predict the withheld preferences in the test set. The most common way to quantify its power of prediction is that of accuracy metrics.
Accuracy
Prediction accuracy is the most commonly measured quality of a recommender system. Based on the different focuses, there are three classes of accuracy metrics: 1) measuring the accuracy of predicted numeric ratings; 2) measuring the accuracy of binary prefer-ences (e.g., whether one performed an activity); 3) measuring the ranking of the items
in the recommendation list [107]. Now, we present three popular accuracy metrics from each class of the accuracy measurement respectively.
MAE and RMSE.As we have discussed in Section2.2.1, some applications require users to rate items on a Likert scale (e.g., from 1 to 5 points). In such cases, to evaluate the predicted numeric ratings, Mean Absolute Error (MAE) and Root Mean Square Error (RMSE) are probably the most popular metrics. In a test setT , if the withheld rating ru,i
from user u to item i is predicted as ˆru,i, the accuracy of the algorithm under evaluation
could be computed by MAE and RMSE respectively as below:
M AE= 1 |T | X (u,i)∈T |ˆru,i− ru,i| (2.7) RM SE= v u u t 1 |T | X (u,i)∈T (ˆru,i− ru,i)2 (2.8)
Both of these two metrics focus on the numeric difference between the real rating and its predicted value. However, if using these two metrics to compare different algorithms, RMSE favors the algorithm whose predictions are all associated to small errors, while MAE metric gives preference to algorithms with minimal errors in most cases tolerating a certain number of predictions with large errors [49]. A recommender system with accu-rate predictions evaluated with RMSE would make general acceptable recommendations to all the users. The one with accurate predictions evaluated with MAE would give per-fect relevant recommendations in most cases, but it is likely to make extremely incorrect recommendations sometimes.
The consequence is that an accurate recommender system yielded from the comparison on RMSE would make generally acceptable recommendations to most of users, while the one outperform in the terms of MAE would give perfect relevant recommendations in most cases, but might also makes extremely incorrect recommendations.
Precision and Recall. There are many applications, where user preferences are not ex-plicit ratings on a numeric scale, but are inferred as binary from user behaviors (e.g., 1 if the user made a purchase, 0 otherwise). In these applications, the objective of a rec-ommender algorithm could be thought of as to predict whether one might perform an activity. On top of the withheld facts (i.e., hidden information on the fact that one has purchased a certain item) in the test set, the outcome of a recommendation from such binary predictions would fall into four cases as shown in Table2.1.
Recommended Not Recommended Adopted True Positive (TP) False Negative (FN) Not Adopted False Positive (FP) True Negative (TN) Table 2.1:Four possible outcomes of recommending an item to a user.
2.2. RECOMMENDER SYSTEMS 19
Counting these possible outcomes, the overall accuracy of the algorithm could be quan-tified by the precision and recall metrics defined as following:
P recision= |T P |
|T P | + |F P | (2.9)
Recall= |T P |
|T P | + |F N| (2.10)
It should be noticed that precision and recall metrics are dependent from the number of recommendations the user receives, that is, they depend on the size of the recommen-dation list. So, while comparing different algorithms using these two metrics, it’s often preferred to control the size of recommendations, and to measure the accuracy using precision/recall at N (i.e., top-N recommendations).
Percentile Ranking. Predicted ratings are not the only property to reflect the accuracy of recommendations. The position of the relevant items (i.e., the recommended item that was adopted by the user) in the recommendation list also matters. An accurate algorithm ranks the most relevant items in the top tier of the recommendation list. One of the metric to address such fact is percentile ranking [51].
Before the final output of top-N recommendations, all the unrated items are sorted ac-cording to their predicted ratings. In such ordered list of items, each item i receives its percentile ranking ranki,uas:
ranki,u =
index of item i in the ordered list
size of the ordered list (2.11)
In this way, ranki,u = 0 would mean that item i is predicted to be the most desirable
for user u. Taking consideration of the withheld rating ru,i from user u to item i in the
test setT , the overall accuracy of the algorithm could be quantified using such percentile ranking as following:
rank = P
i,u∈T ri,u× ranki,u
P
i,u∈T ri,u (2.12)
Invariably from the size of the recommendation list, a lower rank in such metric tells a better accurate recommender system.
Depending on the applications of recommendations, different metrics should be chosen carefully to measure the accuracy. In the literature, the prediction accuracy has been re-garded as the major property of a recommender system. Such importance is built upon the assumption that an accurate prediction is a good recommendation. However, pre-diction accuracy itself is insufficient to explain one’s decision to adopt a recommenda-tion [107], thus is not enough to conclude about the quality of recommendations. Com-plementary evaluations on other properties of recommender system should be explored and investigated.
Beyond Accuracy
In [72], McNee et al. pointed out that accuracy is not enough to describe the quality of a recommender system, and that the focus of accuracy may start to hurt user experiences. They underlined how recommendations shown to be accurate according to the algorith-mic metric sometimes are not useful to users. To tackle this problem, they proposed to shift the attention to user-centric recommendations.
Various properties of recommendations then have been taken into consideration [107], e.g., novelty [60], serendipity [76,133], diversity [131,137], etc.
Novelty.Novel recommendations are the recommended items that users did not know about [60,
107]. Based on such definition, a direct way to evaluate whether the recommended item is new to the user is to perform a user study [21,56]. In the offline experiment setting, the evaluation could be done by splitting the dataset into training and testing subsets along the time, simulating one’s knowledge about items [107].
Serendipity. A serendipitous recommendation is an unexpected (or surprising) recommenda-tions that users do enjoy. Quantifying such “surprises” is challenging. An early attempt from Murakami et al. thought serendipity of recommendations as deviation from a “na-ture” prediction [76]. And Zhang et al. has tried to quantify the serendipity as the amount of information relevant but new to the user in recommendations [132].
Diversity. A diverse recommendation list contains items that are very different from one to another. It could be measured as the new item’s diversity from the items already in the list, which is commonly quantified using distance metrics (i.e., the opposite of similarity computation in item-based approach) [137].
While the concepts of these new evaluation aspects of recommendations remain the same across various applications, their measurement metrics are often tailored according to the context. Moreover, the exploration of techniques to improve the recommendations from these new perspectives are still in its infancy.
2.3
Summary
In this Chapter, in the social media setting, we have introduced various approaches de-veloped in the community to detect trends based on their nature of bursts of interests, as well as the characteristics of identified trends of different kinds. From the perspective of human factors, we also discussed the debate on the role of “influentials” in the creation of trends.
In addition to the background on trends in social media, we have also presented ommender systems - the tools to personalize user content. We see that to build a rec-ommender system, the common practice includes: extracting user preferences on items;
2.3. SUMMARY 21
choosing a suitable algorithm to predict one’s preferences about unrated items; and eval-uating the quality of recommendations. The development of recommender system faces a number of challenges, and the quality of recommendations beyond the accuracy is in particular at demand.
Based on the background and related work in these two different fields, we notice that the studies about “influentials” in the creation of trends have been focused on their power of influencing others to adopt an idea or an item, while the dynamics of their diverse online behaviors in a social media are still unclear. Moreover, it is yet unclear to which extent the knowledge of these people could benefit the identification of trends, and the user consumption of trending content in a social media. In this Thesis, our work aims at tackling these questions by: 1) exploring the characteristics of the people who create trends in a social media; 2) designing a recommender system dedicated to facilitate users discover trending content of their interests; 3) proposing a few approaches to improve the quality of recommendation by introducing serendipity.