STATISTICAL MID-LEVEL FEATURES FOR BUILDING-UP AREA EXTRACTION FROM HIGH-RESOLUTION POLSAR IMAGERY
W. Yang1, 2, *, Y. Liu1, G.-S. Xia2, 3, and X. Xu1
1School of Electronic Information, Wuhan University, Luo-Jia-Shan,
Wuchang, Wuhan 430072, China
2The State Key Laboratory LIESMARS, Wuhan University, 129 Luoyu
Road, Wuhan 430079, China
3CNRS CEREMADE, University of Paris Dauphine, Pl. Marechal De
Lattre De Tassigny, Paris 75016, France
Abstract—This paper addresses the problem of designing statistical features for the extraction of building-up areas (BAs) from high-resolution polarimetric synthetic aperture radar (PolSAR) imagery. The idea is to represent a building-up area by the distribution of its mid-level components, called intermediates, which are statistical patterns unsupervised learnt from PolSAR images. More precisely, by analyzing the structural properties and the polarimetric characteristics exhibited in various terrain types, we propose two kinds of mid-level features for small regions: the cluster based statistical feature (CSF) and the scattering mechanism based statistical feature (SMSF). In detail, for the CSF, the intermediates are the clusters with unsupervised kmeans Wishart classification of the PolSAR images; for the SMSF, the intermediates are the scattering mechanism categories obtained by a four-component decomposition with deorientation based unsupervised classification of the PolSAR images. In contrast with existing features for describing BAs, the proposed features, i.e., CSF and SMSF, capture more complex context information of BAs. We compare the proposed features with those based on the Gaussian Markov random field models, which have been proven to be suitable for BAs mapping. Experimental results on RADARSAT-2 datasets demonstrate the effectiveness of the proposed features.
Received 10 June 2012, Accepted 17 September 2012, Scheduled 29 September 2012
1. INTRODUCTION
As population centers, building-up areas (BAs) represent the most dynamic and complicated ecological environment. Timely and accurately collecting and analyzing the dynamics of BAs have become a key issue in sustainable development planning. The extraction of BAs provides valuable information for many applications, such as the evaluation of ecological environment, population estimation, urban construction and planning, emergency management and fast response to natural disasters [1].
With the sensitivity to the dielectric and geometric characteristics of objects and the weather independent imaging capability, synthetic aperture radar (SAR) has demonstrated its potential in BAs extraction [2]. One way to extract further information on BAs is to exploit the complex scattering nature of the signal by using the modern SAR sensors, for instance the RADARSAT-2 which enables to provide high resolution fully polarimetric SAR (PolSAR) data. Notice that, comparing with classical imaging radars, PolSAR is highly advantageous [3]. It has become a powerful and indispensable tool for the identification and interpretation of BAs [4].
Problem This paper addresses the problem of extracting BAs from high-resolution PolSAR imagery. Using PolSAR images as information source for the extraction of BAs has many advantages. For instance, in addition to the well known “amplitude-only” SAR related properties, it provides much more information on textual fine structure, target orientation, symmetries, and material constituents, etc. [5]. However, the quickly evolving resolution and enriching information of the PolSAR images also bring many challenges to the detection of BAs:
• The information contained in a resolution cell of high-resolution SAR images are richer and more specific. In the case of high-resolution SAR images, target entity usually shows regional characteristics of texture in geometric shapes, structures and contextual information. Instead of reflecting the global physical scattering property of target, the scattering properties of pixels in BAs are more closely related to the target details. It implies that the intra-class variance of the pixel-level features increases while the inter-class variance decreases.
• BAs are geometrically complex landscapes. They are composed of various natural terrain types, artificial objects and other unpredictable elements, such as cars in different patterns [6]. The variety of object properties (e.g., material, size, height) and the overall layout of objects result in different appearances within the
same type of BAs, i.e., different BA types correspond to different composition patterns in terms of geographic location, natural environments and building structural types and materials. Thus, it is of great interest to develop effective and applicable features to extract BAs from high-resolution PolSAR imagery, which describe not only the local pixel-level information but also context information of objects.
Previous work RADARSAT-2 was launched by the Canadian Space Agency (CSA) in December 2007, carried with a C-band polarimetric SAR sensor. It can provide a variety of imaging results, including different polarization frequencies, spatial resolutions and incident angles. The high resolution of RADARSAT-2 SAR images can reveal certain details such as the arrangement of buildings, narrow roads or vegetation distributed in BAs. Nevertheless, few studies have focused on extracting BAs from RADARSAT-2 SAR images. Hu [7] developed object-based and rule-based classification methodologies for extracting urban land-cover information from multi-temporal RADARSAT-1 and RADARSAT-2 images. Based on multi-temporal RADARSAT-2 data, Niu [8] investigated both object-based and pixel-based classification schemes for detailed urban land-cover mapping. Regarding the adopted features, Hu [7] selected a subset of features including spectral, shape and texture features, while Niu [8] compared various polarimetric parameters for their concerns. Reigber et al. [9] applied several advanced SAR image processing methods for detection and classification of urban structures with airborne PolSAR data. It is worth noticing that no feature was particularly designed to exploit the characteristics of the BAs. And feature description of BAs in high-resolution PolSAR images has not caught enough attention.
Moreover, the pixel-level features and the pixel-based methods can not handle the problem caused by the increasing of image resolution. Although the Gaussian Markov random field (GMRF) model [10] based textural feature demonstrated its suitability for operational BAs extraction from SAR images [11, 12], it does not capture contextual information and polarimetric characteristics. Therefore, for the better interpretation of BAs in high-resolution PolSAR images, there is a strong need to put forward special feature descriptors in region level which can integrate enriched context information and polarimetric characteristics.
Contributions In comparison with other terrain types, BAs are usually mixed of various natural objects (e.g., trees, grassland) and man-made objects (e.g., buildings, roads) with wide diversities of materials, orientations and size, etc.. Motivated by the composed patterns of BAs, the main idea for BA modeling is to represent
a building-up area by the distribution of its components, a mid-level components as the basic elements of BAs modeling, named intermediates. They are clusters of pixels unsupervised learnt from PolSAR images. We use the statistics (for instance, the marginal distributions) of the intermediates within each sample to characterize BAs. More precisely, by analyzing the structural properties and the polarimetric characteristics exhibited in various terrain types, we propose two kinds of mid-level features. One is the cluster based statistical feature (CSF), which represent a building-up area by the distribution of the K-means clusters with Wishart distance of the PolSAR images in region level. The other is the scattering mechanism based statistical feature (SMSF). The scattering mechanism categories are obtained by relying on a four-component decomposition with deorientation of the PolSAR images. The experimental results will show the effectiveness of the proposed feature descriptors for extracting BAs from RADARSAT-2 imagery.
In the rest of this paper, Section 2 uses a case study to explain why to choose mid-level features rather than pixel-level ones, Section 3 presents how to compute the new mid-level feature descriptors for BAs, Section 4 evaluates the experimental results based on the RADARSAT-2 PolSAR images, and the last section concludes this work.
2. WHY MID-LEVEL FEATURES: A CASE STUDY
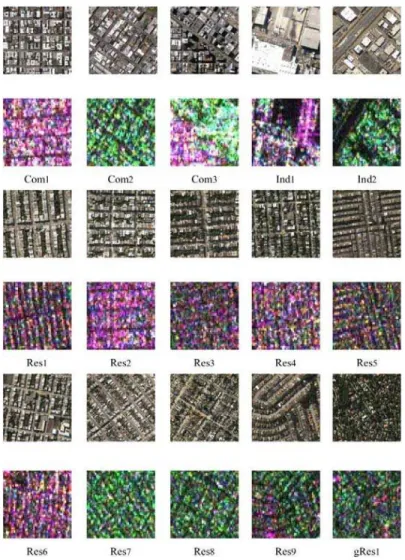
In this section, we use a case study of BAs in San Francisco as an example to explain in detail why we use mid-level features. Figure 1 shows the PolSAR images obtained by RADARSAT-2 for BAs in San Francisco, where the optical images belonging to the same BA type are also displayed correspondingly. For the sake of visualization, each PolSAR image is illustrated as a RGB-color image, with the R, G, and B channels referring to the |HH|, |HV | and |V V | of the PolSAR image respectively.
From Figure 1, we can observe that different BA types correspond to different composition patterns in terms of geographic location, natural environments and building structural types and materials. For instance, the commercial areas are representative of large-building areas, where buildings are high and most constructed by glass and metal. Many streets and little vegetation are around here. As shown in Figure 1, sample Com1 and Com2 obtained from commercial BAs
exhibit bright color in PolSAR images. Also composed of buildings, industrial factories, as shown in the samples Ind1and Ind2, are mainly
located in the city industrial zone. Buildings in the industrial areas are usually with large size, regular shape, concrete materials and smooth
Figure 1. Samples of BAs in San Francisco. The lower row of each sample shows the PolSAR image, and the upper row shows the corresponding optical satellite images. Refer to the text for more details.
material of the roof. The surroundings are spacious cement streets. Large buildings are reflected as bright blocks in PolSAR images, while the surrounding spacious cement roads and grounds appear as large dark pieces in the image. Urban residential districts mainly refer to the areas in the city with regularly and densely aligned buildings. Comparing with the two BA types mentioned before, The buildings
in residential areas have smaller size and are usually surrounded by trees, regular grass and cement roads. However, there are many factors that make the polarization representations of these residential samples more or less different. For instance, the local layout is either in strips or in blocks (Res1 and Res2). The colors reflected in PolSAR images
are both red, while the latter is brighter. In terms of the texture characteristics, the former presents salient linear structure and the latter shows block texture. Different greening levels in residential areas (Res3 and Res4) affect the mixture degree of green color (vegetation)
in red (buildings). Building material can also have an effect on the polarization representation, such as sample Res5 and Res6. Compared
with Res1 and Res7, samples of the same type but different layout
orientation also differ from each other. In addition, sample Res7
and Res8 present similar polarization appearances but have a little
different composition patterns. Sample Res9 shows either in red
strips or in green strips, because the buildings are aligned in twists and turn along the meandering terrain, which results the big changes of the angles between the buildings and the radar sensor. Sample gRes1 represents the “green” residential area. Here, “green” means
that the residential areas are far from the city center but close to mountain with the properties of high vegetation content and irregularly distributed buildings, which produces the green and red spots inclusion phenomenon.
In a word, the BAs are complicated and various in the case study. Taking into account the cultural and geographical diversities and the territory planning difference, the variety of BAs in different countries will be larger. We can see that it is difficult to detect and identify BAs with pixel-level features, such as the marginal distributions of pixel values. However, as we show before, BA is composed of various component objects (e.g., buildings, trees, streets, etc.), and can be represented by the distribution of its components.
Thus, In the following parts, we adopt a mid-level components, called intermediates, which are categories unsupervisedly learned from PolSAR images, bypassing labeling and recognizing all the pixels. We then model the distribution information of the intermediates within the sample to characterize BAs.
3. DESIGNING OF STATISTICAL MID-LEVEL FEATURE DESCRIPTORS
In this section, we propose two statistical features associated with different intermediates for extracting BAs. First, in order to utilize the polarimetric characteristics of BAs, we adopt the unsupervised Wishart
classifier to learn the intermediates, which are the K-mean clusters with Wishart distance of the PolSAR images. So, we name the mid-level feature as cluster based statistical feature (CSF). Secondly, taking the scattering mechanism categories as the intermediates, we can represent a building-up area by the distribution of its intermediates. The intermediates are unsupervisedly learnt from PolSAR images based on a four-component decomposition with deorientation of polarimetric coherent matrix. The scattering mechanism based statistical feature is shorten as SMSF hereafter.
3.1. Cluster-based Statistical Feature (CSF)
For monostatic radar imaging of a reciprocal medium, the measured scattering matrix define a polarimetric target vector
k = [Shh Shv Svv]H (1)
where the superscript H denotes the matrix transpose.
The complete polarimetric information of the observed target is conveyed in the covariance matrix, which is defined as
C = 1 n n X i=1 k(i)k(i)∗H (2)
where k(i) denotes the scattering vector of the i-th sample, the superscript “*” denotes the complex conjugate, and n is the number of looks. The covariance matrix C follows a complex multivariate Wishart distribution [13, 14]. Applying the maximum likelihood (ML) classifier to the Wishart distribution, a Wishart distance [15] measure was derived
d(C|Σm) = T r(Σ−1m C) + log(|Σm|) (3) where T r is the trace of a matrix, C the measured covariance matrix of the query pixel, and Σm the mean covariance matrix of the m-th class.
A maximum likelihood (ML) classifier based on Wishart distance measure is expressed as Eq. (4). The pixel is assigned to the class with the minimum distance.
d(C|Σi) ≤ d(C|Σj), ∀θj 6= θi (4) where the pixel is finally assigned to class θi, i ∈ {1, . . . , K}, and K is the number of clusters. The ML classifier in Eq. (4) can be equally applied to the coherency matrix, which is linearly related to the covariance matrix.
Unsupervised classification algorithms based on the Wishart distance measure can be implemented by combining the Wishart ML
classifier and a clustering algorithm (e.g., K-means). The unsupervised K-means Wishart classification algorithm is shown in Alg. 1.
Algorithm 1: Unsupervised K-means Wishart classification Input: Covariance matrices C for N pixels;
The number of clusters K. Output: Class label for N pixels. Speckle denoising with boxcar filter; Initializing cluster centers Σ0
k with k = 1 to K; for i ← 1 to I do
// I indicates the maximum iteration number for n ← 1 to N do
for k ← 1 to K do
Calculate Wishart distance dCn, Σi−1k as Eq. (3); Classify pixel n according to Eq. (4);
// update cluster centers for k ← 1 to K do
Σi
k← Σj∈θk(Cj);
Label pixels assigned to class θk as k.
Based on the unsupervised K-means Wishart classification algorithm, each pixel is assigned to the corresponding cluster and has its initial class label. The K clusters are expressed as intermediates and the complex context of BAs can be described by the distribution of intermediates. So we model the context information by building a histogram. One bin of the histogram corresponds to one cluster learnt from the unsupervised K-means Wishart classification algorithm and its value suggests the composition state of a particular element. The cluster based statistical feature, shorten as CSF, captures both the distribution information of the composition elements in terrain samples and the polarimetric statistics distribution characteristics.
3.2. Scattering Mechanism Based Statistical Feature (SMSF)
BAs contain scatterers with a variety of distinctive scattering mechanisms. In order to combining the polarimetric scattering properties exhibited in different land cover areas and the context knowledge, we propose the scattering mechanism based statistical feature (SMSF). This feature is based on the fact that the composition elements of BAs interact with the transmitted radar signals
in complicated ways and therefore exhibit various backscattering mechanisms including surface scattering, double-bounce scattering, volume scattering and helix scattering. Due to the high resolution of the RADARSAT-2 data, the return signal of each pixel is generally governed by a single dominant scatter. In general, trees or vegetation are dominated by the volume scattering and assigned with green color. For surfaces of water, ground and road, the surface scattering is dominant. A smooth surface causes specular reflection of the incident energy and thus appears as darker toned areas on an image, while a rough surface will scatter the energy in all directions and will appear brighter in tone on an image. The double-bounce scattering (red) is particularly strong in structures including road surface-building wall, ground-trees, and man-made targets. Additionally, the helix scattering is relevant for the complicated shapes in man-made structures whereas disappears for almost all natural distributed scattering.
The physical scattering mechanisms of the natural distributed target areas can be illustrated well by the three-component scattering model developed by Freeman and Durden [16], which models the observed covariance matrix as a linear sum of surface scattering, double bounce scattering and volume scattering. However, it is inconsistent with the general scattering case encountered BAs due to the assumption of scattering reflection symmetry. Yamaguchi et al. [17, 18] extended the three-component scattering model by adding the helix scattering mechanism as the fourth component to deal with the observed actual phenomenon. The model can be expressed as
hT i = fs[T ]surface+ fd[T ]double+ fv[T ]volume+ fc[T ]helix (5) where, T is the measured coherency matrix. [T ]surf ace, [T ]double, [T ]volume and [T ]helix correspond to the coherency matrix for surface scattering, double-bounce scattering, volume scattering and helix scattering respectively, and fs, fd, fv and fc are the corresponding coefficients.
To eliminate the negative power in the four-component decom-position, a power constraint was introduced by Yajima et al. [19]. In addition, the orientation of buildings with respect to the radar illumi-nation also affects their polarimetric properties. Thus, it is possible to confuse those BAs with vegetation. A rotation of the coherency matrix (namely deorientation) is first employed by An et al. in the three-component decomposition [20] and later work [21] applied the deorientation prior to the four-component decomposition. The deori-entation is defined as
where [Q] = " 1 0 0 0 cos(2θ) sin(2θ) 0 − sin(2θ) cos(2θ) # (7)
where θ denotes the orientation angle, and Tθ is the rotated coherence matrix.
The deorientation procedure can remove the fluctuant influence of randomly distributed target orientation angles on polarimetric scattering, and it can make two identical targets with different orientation angles yield the same polarimetric matrix.
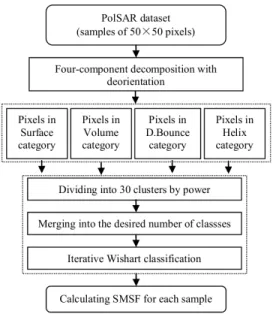
Based on the three-component decomposition scheme, Lee [22] proposed an unsupervised terrain classification algorithm. In this section, we extend this unsupervised classification algorithm by incorporating the four-component decomposition with deorientation of coherency matrices for initial categorizing, followed by iterated refinement using the complex Wishart ML classifer. The classification and merging processes are restricted to the pixels in the same scattering category, which preserves the purity and homogeneity of physical scattering characteristics. A flowchart of the unsupervised classification algorithm based on four-component decomposition with deorientation is given in Figure 2.
We list some differences as follows:
Figure 2. Flowchart of the unsupervised classification algorithm based on four-component decomposition with deorientation.
• In the process of initial categorization according to the dominant scattering power, we adopt the four-component decomposition with deorientation instead of three-component decomposition for better characterizing BAs;
• When merging clusters within each category, the between-class Wishart distance is calculated
Dij = 12{ln(|Vi|) + ln(|Vj|) + T r(Vi−1Vj+ Vj−1Vi)} (8) Two clusters with the shortest distance are merged until reaching the desired number of clusters Nd. Considering the data volume in our case, we limit the size of classes no larger than
Nmax= 10N/Nd (9)
Here N is the total number of pixels in all the samples, and we set equal number of clusters for each scattering category instead of being proportional to the number of pixels.
There are different components in various terrain types and they exhibit various backscattering mechanisms. Dihedral structures of wall-ground in BAs, mountain rocks and trunk-bareland, bridge girder-deck and ship mast-girder-deck exhibit strong double bounce scattering, while road and water are characterized by surface scattering, trees or vegetation are dominated by volume scattering. The contextual information from the perspective of scattering mechanisms is the different scattering mechanism components exhibited in the sample region. Therefore, the intermediates here are the scattering mechanism categories. Relying on the unsupervised classification algorithm based on the four-component decomposition with deorientation of the PolSAR images, each pixel is assigned to one particular category and pixels belonging to the same category exhibit similar physical scattering mechanism. So we describe a given sample by counting the number of times each category label appears within that sample. Thus one histogram is built and then normalized with the overall number of pixels in sample region. The value of the kth bin gives a measure of the composition ratio of one particular scattering mechanism within the sample. The histogram is a numerical statistic which reflects the distribution of the scattering mechanism categories and captures the context information.
4. EXPERIMENTAL RESULTS
4.1. Datasets and Experimental Settings
Two experiments were carried out in this section to illustrate the effectiveness of the proposed feature descriptors (CSF and SMSF) in
BA extraction. One is based on the RADARSAT-2 PolSAR sample datasets which including seven-class samples selected from six large scenes. The 6 RADARSAT-2 full polarimetric SAR images are taken over San Francisco (14416 × 2823 pixels), Gibraltar (11739 × 2156 pixels), Vancouver (13299 × 2120 pixels), Altona (12953 × 2822 pixels), Flevoland (12944 × 2823 pixels) and Oberpfaffenhofen (12594 × 2409 pixels) respectively. The seven classes are BAs (540), water (185), crop (160), forest (90), mountain (214), bridge (58) and ship (40), and the size of all samples are 50 × 50 pixels. The other is based on two RADARSAT-2 PolSAR scenes with size of 1000 × 1000 pixels taken over Wuhan, China in December 7, 2011.
We compared the proposed features with those based on the Gaussian Markov random field (GMRF) models, which have been proven to be suitable for BAs mapping [12]. Moreover, for better evaluating the performance of the proposed feature descriptors (CSF and SMSF) in BA extraction, we adopted F value [23] and accuracy as evaluation measures. F value measures the performance of a system on a particular class (in our case, BAs). It reflects the average effect of both precision and recall, which is suitable for our purpose. Accuracy reflects the overall classification performance when regarding the task of BA extraction as solving the problem as a binary classification. Remarkably, accuracy does not fully reflect the performance of BA extraction, as the non-BAs samples take a major proportion in our testing dataset. Considering the internal optimization mapping property of SVM classifier [24], KNN classifier with K = 5 was used for the experiment based on the sample datasets, while SVM classifier with RBF kernel was applied when testing on large images, and the cost parameter C was set to 10.
4.2. Results on RADARSAT-2 Sample Datasets
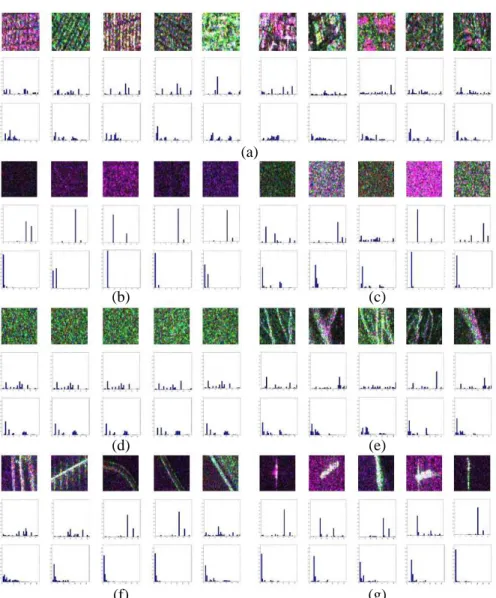
Figure 3 illustrates CSF and SMSF features for RADARSAT-2 sample datasets, which are selected with large within-class variation as possible.
The intermediate strategy allows us not to clearly point out what specific element each dimension of CSF corresponds to, since we only concerned the overall composition pattern of each sample. As observed in Figure 3, different composition patterns of various terrain types make their values of CSF differ from each other. BAs belong to the complex scenes and then most of bins for CSF have non-zero values. There exist differences among CSF values of BAs because of their diversity types. For the samples of water, the composition elements are simple and only few bins of CSF have values. Similarly, other terrain types have their unique patterns of CSF values. However, features of
(a)
(b) (c)
(d) (e)
(f) (g)
Figure 3. Illustrating CSF and SMSF for RADARSAT-2 samples. The first row are original PolSAR samples, the second and third rows are the corresponding CSF and SMSF histograms, respectively. (a) BAs. (b) Water. (c) Crop. (d) Forest. (e) Mountain. (f) Bridge. (g) Ship.
some BAs exhibiting green color in PolSAR images are easily confused with ones of forest samples. SMSF of PolSAR sample datasets are also shown in Figure 3. Observe that for BAs some dimensions belonging to double bounce scattering and helix scattering have values. For water
and forest samples, the feature values have a dense distribution, the former mainly falling in the top dimensions of surface scattering and the later in some dimensions of volume scattering. The feature value distribution of crop varies with its growth. We also find that SMSF obtained in the sample level distinguishes the BAs from the rest land cover types.
For the whole sample datasets, 162 samples (30%) of BAs were selected to cover complete BA types as much as possible, and the rest 378 samples (70%) were used to construct the testing set. We randomly choose 50% respectively from the other six negative classes as training set and the remainder as testing set. Five-fold experiments were performed and the means and standard deviations of F values and accuracies were recorded.
The effect of different window sizes for GMRF and different feature dimensions for CSF and SMSF on BAs extraction were investigated. Then the appropriate dimension were selected for the performance comparison between the proposed features and the baseline ones.
GMRF Features computed with a window size of 15 × 15 pixels has already proven to be suitable for BAs mapping in medium to high resolution SAR images [12]. In the experiment, we compared the performance based on 2-order GMRF (GMRF2 in short) with the proposed features CSF and SMSF respectively. First, we investigated the effect of the window size in our case. We divided the sample of 50 × 50 pixels into N non-overlapping patches with size of h × h, and then concatenated all the GMRF2 (6 dimensions) computed in patches as the feature descriptor (6N dimensions) of the sample. In the case of h = 15, we chose N = 9, 16 respectively and resized the sample size from 50 × 50 pixels to 15√N × 15√N . The results of GMRF2 for extracting BAs were shown in Table 1.
Consistent with [12], a window size of 15 × 15 pixels is a good choice. In addition, N = 9 performs much better. So we chose the 54-dim GMRF2 as our baseline. Besides, we also calculated the bag of words representation for GMRF2 (abbreviated as bowGMRF2) based
Table 1. Results of building area extraction based on GMRF2.
Parameters h = 10, N = 25 h = 15, N = 16 h = 15, N = 9 h = 25, N = 4
Dimensions dim = 150 dim = 96 dim = 54 dim = 24
Acc ± std
(%) 81.29 ± 1.06 81.80 ± 1.33 85.35 ± 0.78 84.17 ± 0.52 F ± std 0.812 ± 0.010 0.825 ± 0.008 0.854 ± 0.008 0.848 ± 0.011
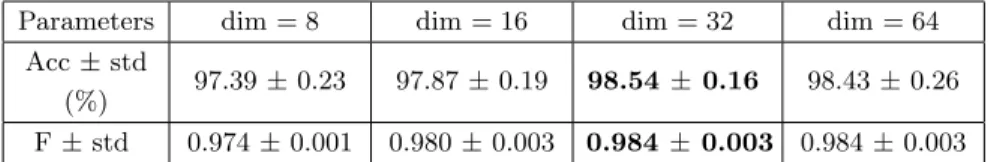
Table 2. Results based on CSF with different dimensions.
Parameters dim = 8 dim = 16 dim = 32 dim = 64
Acc ± std
(%) 97.39 ± 0.23 97.87 ± 0.19 98.54 ± 0.16 98.43 ± 0.26 F ± std 0.974 ± 0.001 0.980 ± 0.003 0.984 ± 0.003 0.984 ± 0.003 Table 3. Results based on SMSF with different dimensions.
Parameters dim = 8 dim = 16 dim = 32 dim = 64
Acc ± std
(%) 98.14 ± 0.16 97.36 ± 0.30 98.59 ± 0.33 99.40 ± 0.30 F ± std 0.981 ± 0.006 0.974 ± 0.004 0.986 ± 0.003 0.994 ± 0.003
on patches with size of 5 × 5 pixels and 32 codewords, the accuracy is 84.02 ± 0.45, and the F measure is 0.831 ± 0.006.
We also considered different dimensions (cluster numbers) of CSF for analyzing the performance of extracting BAs. From Table 2, the overall accuracies and F values were relatively stable. As the cluster number refers to the possible category number of all the pixels, it is too small to cover all the categories. However, taking into account the stability of K-means clustering algorithm, it should not be too large. As shown in Table 2, CSF with 32 dimensions perform the best, so we finally chose 32 as the dimension of CSF.
SMSF was calculated in pure unsupervised way using all the training and testing samples. Table 3 shows the effect of the finally merged cluster number for experimental results. When the final category number is 32 or 64, the classification accuracies are both over 98%, F values also surpass 0.98. Note that the performance deteriorates significantly when the dimension values 16 or 8. For computational efficiency, the dimension of SMSF was selected as 32.
From Tables 1–3, we observed that the proposed features CSF and SMSF outperform the GMRFs, which specially designed for BAs mapping. We also noticed that CSF has similar performance as SMSF.
4.3. Results on RADARSAT-2 Scenes
The optical and PolSAR images (R: HH, G: HV, B: VV) of RADARSAT-2 scene-1 are shown in Figure 4(a) and (b), scene-2 corresponding to Figure 4(c) and (d). Most of scene-1 are densely and regularly aligned residential areas, which have low buildings and are surrounded by many trees, cement trails and wide trunk streets. Due to the orientation of building blocks and houses, residential areas
(a) (b)
(c) (d)
Figure 4. Two RADARSAT-2 scenes in Wuhan, China. (a) Optical image of scene-1. (b) Optical image of scene-2. (c) Polarimetric SAR image of scence-1. (d) Polarimetric SAR image of scence-2.
exhibit either green line or dark red line structures in SAR images. The areas characterized by bright wide belt structures alternated with dark stripe ones are high-rise BAs just completed or under construction.
The bright red masses are large factories with blue roof in Wuhan. In left bottom of Figure 4(b) there is a large scale of red area. It is a
(e) (f)
(c) (d)
(a) (b)
Figure 5. Extraction results of scene-1 with different features. (a) Polarimetric SAR image. (b) Ground truth. (c) GMRF2 (dim = 54). (d) BowGMRF2 (dim = 32). (e) CSF (dim = 32). (f) SMSF (dim = 32).
university, where exists many large high-rise buildings. We also observe the dark blocks because of the lake and the stadium. For background regions, it is worth noticing that bridges and ships both have strong
(a) (b)
(c) (d)
(e) (f)
Figure 6. Extraction results of scene-2 with different features. (a) Polarimetric SAR image. (b) Ground truth. (c) GMRF2 (dim = 54). (d) BowGMRF2 (dim = 32). (e) CSF (dim = 32). (f) SMSF (dim = 32).
Table 4. BAs extraction results of scene-1 with different features.
Features GMRF2 bowGMRF2 CSF SMSF
Acc (%) 79.60 87.02 91.58 90.04
F 0.837 0.885 0.924 0.911
Table 5. BAs extraction results of scene-2 with different features.
Features GMRF2 bowGMRF2 CSF SMSF
Acc (%) 57.42 75.90 88.97 87.20
F 0.591 0.704 0.838 0.819
double bounce scattering powers. In scene-2, BAs occupy a relatively smaller part and the background regions are more complex. Crop lands are the dominant type and they are in different growth periods or still unseeded. In contrast to scene-1, there exist a lot of irregularly aligned and highlighted regions with block structures, which are new high-rise BAs and industrial areas. The densely distributed houses in residential areas are just built and with medium height and red roofs. In addition, there are many isolated groups of buildings scattered in scene-2.
For each scene, we divided it into half-overlapped samples of 50 × 50 pixels, and pick 15 BA samples and 20 background samples as the training set. The BAs extraction results of scene-1 and scene-2 are shown in Figure 5 and Figure 6 respectively. The ground truth maps in Figure 5(b) and Figure 6(b) mark BAs as red color. Tables 4 ∼ 5 show the BAs extraction accuracies and F values on two large images with different features, which further verify the superiority of CSF and SMSF in extracting BAs from PolSAR images.
The sample size of 50 × 50 pixels can hold the composition of different terrain types and capture sufficient context information. However, the yielded block effects are obvious in the building-up extraction results from large scenes. We could also apply our algorithms directly at pixel level by extracting a patch at every pixel, but this would be computationally expensive.
5. CONCLUSION
In this paper, two statistical feature descriptors, referred to CSF and SMSF, for extracting BAs from PolSAR images have been presented. Both of them introduce the contextual information at patch level. More precisely, CSF is from the a perspective of composition complexity, while SMSF is from the scattering mechanisms contained in sample
regions. Experimental results on RADARSAT-2 PolSAR datasets show very promising performances and the method significantly outperforms the commonly used features. To reduce the blocking artifacts that sometimes appear around the borders of patches, it may help to use smaller and/or more densely sampled patches or an over-segmentation based scheme for the patch-to-pixel label mapping.
ACKNOWLEDGMENT
The research was supported in part by the National Natural Science Foundation of China (NSFC) 61271401 and China Postdoctoral Science Foundation (CPSF) 20110491187.
REFERENCES
1. Soergel, U., Ed., Radar Remote Sensing of Urban Areas, 1st Edition, Springer, Heidelberg, 2010.
2. Stasolla, M. and P. Gamba, “Spatial indexes for the extraction of formal and informal human settlements from high-resolution SAR images,” IEEE J. Selected Topics in Applied Earth Observations and Remote Sensing, Vol. 1, No. 2, 98–106, 2008.
3. Evans, D. L. and J. J. Van Zyl, “Polarimetric imaging radar: Analysis tools and applications,” Progress In Electromagnetics Research, Vol. 03, 371–389, 1990.
4. Jin, Y.-Q., “Polarimetric scattering modeling and information retrieval of SAR remote sensing — A review of FDU work,” Progress In Electromagnetics Research, Vol. 104, 333–384, 2010. 5. Ferro-Famil, L. and E. Pottier, “Dual frequency polarimetric SAR
data classification and analysis,” Progress In Electromagnetics Research, Vol. 31, 247–272, 2001.
6. Kong, J. A., S. H. Yueh, H. H. Lim, R. T. Shin, and J. J. Van Zyl, “Classification of earth terrain using polarimetric synthetic aperture radar images,” Progress In Electromagnetics Research, Vol. 3, 327–370, 1990.
7. Hu, H. T., “Urban land-cover mapping with high-resolution spaceborne SAR data,” Ph.D. dissertation, Geoiniformatics KTH, Sweden, Nov. 2010.
8. Niu, X., “Multitemporal spaceborne polarimetric SAR data for urban land cover mapping,” Ph.D. dissertation, Geoiniformatics KTH, Sweden, Feb. 2011.
9. Reigber, A., M. Jager, W. He, L. Ferro-Famil, and O. Hellwich, “Detection and classification of urban structures based on
high-resolution SAR imagery,” Urban Remote Sensing Joint Event, Paris, France, Apr. 11–13, 2007.
10. Chellappa, R. and S. Chatterjee, “Classification of textures using gaussian markov random fields,” IEEE. Trans. Acoustics, Speech and Signal Processing, Vol. 33, 956–963, 1984.
11. Corbane, C., F. Faure, N. Baghdadi, N. Villeneuve, and M. Petit, “Rapid urban mapping using SAR/optical imagery synergy,” Sensors, Vol. 8, No. 11, 7125–7143, 2008.
12. Corbane, C., N. Baghdadi, X. Descombes, G. Wilson, N. Vil-leneuve, and M. Petit, “Comparative study on the performance of multiparameter SAR data for operational urban areas extrac-tion using textural features,” IEEE Geosci. Remote Sens. Letters, Vol. 6, No. 4, 728–732, 2009.
13. Yueh, S. H., J. A. Kong, J. K. Jao, R. T. Shin, H. A. Zebker, T. Le Toan, and H. Ottl, “K-distribution and polarimetric terrain radar clutter,” Progress In Electromagnetics Research, Vol. 03, 237–275, 1990.
14. Lee, J. S., K. W. Hoppel, S. A. Mango, and A. R. Miller, “Intensity and phase statistics of multilook polarimetric and interferometric SAR imagery,” IEEE Trans. Geosci. Remote Sens., Vol. 32, 1017– 1028, Sept. 1994.
15. Lee, J. S., M. R. Grunes, and G. De Grandi, “Polarimetric SAR speckle filtering and its impact on terrain classification,” IEEE Trans. Geosci. Remote Sens., Vol. 37, No. 5, 2363–2373, 1999. 16. Freeman, A. and S. Durden, “A three-component scattering model
for polarimetric SAR data,” IEEE Trans. Geosci. Remote Sens., Vol. 36, No. 3, 963–973, 1998.
17. Yamaguchi, Y., T. Moriyama, M. Ishido, and H. Yamada, “Four component scattering model for polarimetric SAR image decomposition,” IEEE Trans. Geosci. Remote Sens., Vol. 43, No. 8, 1699–1706, 2005.
18. Yamaguchi, Y., Y. Yajima, and H. Yamada, “A four-component decomposition of POLSAR images based on the coherency matrix,” IEEE Geosci. Remote Sens. Lett., Vol. 3, No. 3, 292– 296, 2006.
19. Yajima, Y., Y. Yamaguchi, R. Sato, H. Yamada, and W. M. Boerner, “POLSAR image analysis of wetlands using a modified four-component scattering power decomposition,” IEEE Trans. Geosci. Remote Sens., Vol. 46, No. 6, 1667–1673, 2008. 20. An, W. T., Y. Cui, and J. Yang, “Three-component model-based
Remote Sens., Vol. 48, No. 6. 2732–2739, 2010.
21. An, W. T., C. H. Xia, X. Z. Yuan, Y. Cui, and J. Yang, “Four-component decomposition of polarimetric SAR images with deorientation,” IEEE Geosci. Remote Sens. Lett., Vol. 8, No. 6, 1090–1094, 2011.
22. Lee, J. S., M. R. Grunes, E. Pottier, and L. F. Famil, “Unsuper-vised terrain classification preserving polarimetric scattering char-acteristics,” IEEE Trans. Geosci. Remote Sens., Vol. 42, No. 4, 722–731, 2004.
23. Chinchor, N., “MUC-4 evaluation metrics,” Proc. of the Fourth Message Understanding Conference, McLean, Virginia, Jun. 16– 18, 1992
24. Chang, C. C. and C. J. Lin, “LIBSVM: A library for support vector machines,” 2001, Software available at http://www.csie.ntu.edu.tw/∼cjlin/libsvm.