Thesis
Sovereign Wealth Funds
Name: Idriss Mrani Alaoui
Academic Program: Grande Ecole Program – Finance Major Submitted to: Prof. Jacques Olivier
Table of content
Abbreviations and Acronyms... 3
1. Introduction ... 4
1.1. Defining Sovereign Wealth Funds ... 4
1.2. The emergence of Sovereign Wealth Funds ... 5
1.3. The Santiago principles and the new regulating environment ... 7
2. A review of empirical research on SWFs’ investment strategy ... 10
2.1. SWFs’ impact on target firms ... 10
2.2. Target firms’ profile ... 15
2.3. The role of SWFs’ transparency... 18
2.4. The role of political relations in SWFs investments ... 21
3. Empirical study ... 26
3.1. Data and descriptive statistics ... 26
3.2. The market reaction to announcements of SWF investments ... 29
3.3. Difference in means test ... 32
3.4. Panel regressions ... 36
4. Interviews ... 40
4.1. FSI – Fonds Stratégique d’Investissment... 40
4.2. OECD – Organisation for Economic Co-operation and Development ... 42
5. Conclusion... 44
References ... 46
Acknowledgement... 48
Appendix ... 48
Abbreviations and Acronyms
SWF Sovereign Wealth Funds
IWG International Working Group of Sovereign Wealth Funds IMF International Monetary Fund
GAPP Generally accepted principles and practices KIA Kuwait Investment Authority
AUM Asset Under-Management
IFSWF International Forum of Sovereign Wealth Funds
OECD Organisation for Economic Co-operation and Development FOI Freedom of Investment process
GIC Government of Singapore Investment Corporation
EBITDA Earnings before interests, tax, depreciation and amortization FSI Fonds Stratégique d’Investissment
FDI Foreign Direct Investment CAR Cumulative Abnormal Return
1. Introduction
1.1. Defining Sovereign Wealth Funds
What is a sovereign wealth fund? In my opinion this is a key question when approaching this topic. The high variety of SWFs available in terms of governance and objectives sometimes makes it difficult to clearly identify them. They are largely defined as government-owned investment funds with investments in foreign financial assets. I decided to use the IWG definition for SWFs1 which was developed during the writing of the “Santiago principles” in 2008, principles which will be discussed later. This definition excludes foreign currency reserve assets held by monetary authorities for the traditional balance of payments or monetary policy purposes, operations of state-owned enterprises in the traditional sense, government-employee pension funds and assets managed for the benefit of individuals.
It also establishes three key criteria in order to facilitate the identification of SWFs. First, regarding the ownership it states that “SWFs are owned by the general government, both central and subnational governments”. Secondly, the investment strategies should include foreign financial assets, excluding those funds that merely invest locally. Finally the last criterion concerns the purposes and objectives of the fund, which should be defined by the general government and for macroeconomic purposes. This criterion allows for a certain flexibility concerning the investment strategies and time horizon, however it insists in the fact that they cannot be created only for the traditional balance of payments.
Due to the large heterogeneity of the different funds, the IMF categorizes SWFs according to their main objective into five types2 (see Table 1).
Some funds can have multiple objectives or can change them over time, this is why this classification should be used in a flexible way. It is important to identify and clearly define a SWF’s objective to be able to determine the best time horizon and risk-return profile of the investment strategy.
1
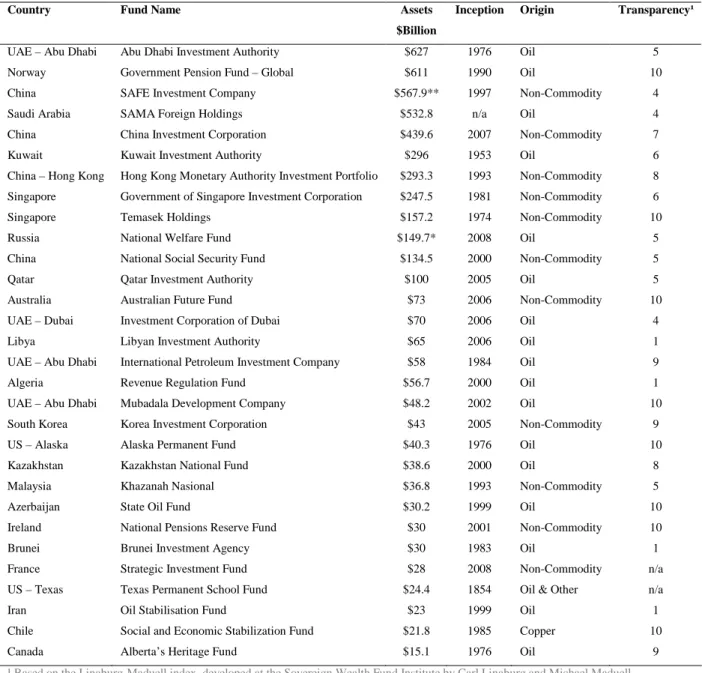
SWFs are defined “as special purpose investment funds or arrangements, owned by the general government. Created by the general government for macroeconomic purposes, SWFs hold, manage, or administer assets to achieve financial objectives, and employ a set of investment strategies which include investing in foreign financial assets.” (IWG, 2008, “Santiago Principles”, Appendices and references). A list of the most important SWFs is available in Appendix A
Table 1. Sovereign wealth funds classification according to the IMF
Type of fund Main objective
Stabilization funds Insulate the budget and the economy against commodity price volatility Savings funds for future
generations
Convert non-renewable assets into a more diversified portfolio of assets and mitigate the Dutch disease3 effects
Reserve investment corporations Increase the return on reserves (can be counted as reserve assets)
Development funds Contribute to raise a country’s potential output growth
Pension reserve funds without explicit pension liabilities
For contingent unspecified pension liabilities on the government’s balance sheet
1.2. The emergence of Sovereign Wealth Funds
Sovereign Wealth Funds have existed for decades now. The first one was created in 1953, the Kuwait Investment Board which became afterwards the Kuwait Investment Authority (KIA), was established 8 years before Kuwait’s independence to invest the proceeds from oil for the future generations. The sudden interest in this kind of investors comes from their fast growth in number and AUM these last years. Before 2000 there existed around two dozens SWFs investing state-owned profits coming from different sources, like fiscal surpluses and commodities such as oil and copper. Now-a-days we have more than 50 investing proceeds from very different sources and established in a high variety of countries. This growth accelerated in 2002 due to the rising prices of commodities, especially crude oil, and the current account surpluses of fast growing Asian countries.
The main concerns regarding this kind of investors include their potential influence on the global financial markets and their possible political motivations. This kind of investors remains powerful despite the financial crisis, +45% since 2007 (see Figure 1).
3 Dutch disease refers to the situation where a boom in a commodity sector of the economy could lead to a loss of competitiveness for other sectors in this economy contributing to a loss of jobs. This is generally caused by an increase of the local currency real exchange rate
Figure 1. Sovereign Wealth Fund market size Total financial assets in $ trillion
3.3 4.1 4.0 4.4 4.8 0.00 1.00 2.00 3.00 4.00 5.00 6.00 2007 2008 2009 2010 2011 SOURCE: SWF Institute
Their weight in the financial landscape, even if it is still relatively small, is also increasing and as we can see is geographically diversified (see Table 2).
Table 2. Financial wealth by region and by investor type Financial assets owned by residents, 2010 $ trillion
United States
Western
Europe Japan China
Other developed¹ Other Asia² Latin America MENA Rest of the world Total Institutional investors Pensions³ 15.0 5.3 3.3 0.5 2.4 0.6 0.7 0.4 0.1 28.3 Insurance 6.6 9.6 3.5 0.6 0.7 1.0 0.3 0.1 0.3 22.7 Endowments & foundations 1.1 0.2 0.0 -- 0.1 -- 0.0 0.0 -- 1.4 Corporations Banks 4.0 11.9 6.7 3.9 1.4 0.9 0.9 0.5 0.5 30.7 Nonfinancial corporations 2.0 1.7 1.2 3.8 0.3 1.3 0.3 0.2 0.2 11.0 Governments Central banks 2.3 1.7 1.0 2.5 0.2 1.9 0.5 0.4 1.5 12.0 Sovereign Wealth Funds 0.1 0.6 -- 0.7 0.1 0.9 0.1 1.7 0.2 4.4 Other government -- -- -- 1.1 -- 0.4 0.5 0.3 0.1 2.4 Total 31.1 31.0 15.7 13.1 5.2 7.0 3.3 3.6 2.9 112.9
¹ Includes Australia, Canada, and New Zealand
² Includes both developed countries and emerging markets
³ Includes defined-contribution plans and individual retirement accounts (IRAs)
SOURCE: National sources; McKinsey Global Institute “The emerging equity gap: Growth and stability in the new investor landscape”
Despite the concerns of the recipient countries of SWFs’ investments, policy toward SWFs has not resulted in protectionist stances in most countries. Moreover, they have been relatively solicited during the financial crisis for their capital. Their capacity to initiate a
dialogue with recipient countries through the “Santiago principles” and the OECD efforts to provide guidelines for good policy responses have also helped to construct a stable environment.
1.3. The Santiago principles and the new regulating environment
It was in the interest of both recipient countries and SWFs to develop a framework in order to integrate the operations of the SWFs within the macroeconomic policy framework of their home countries and within the structures for multilateral monitoring. The IWG was formed in May 2008 and comprises 26 IMF member countries with SWFs4. The objective was to develop a set of principles in order to properly reflect the investment objectives and practices of SWFs. The IWG recognized both the beneficial and critical aspect of SWFs’ investments to international markets. The generally accepted principles and practices (GAPP) tried to highlight the following guiding objectives for this kind of investors:
i. To help maintain a stable global financial system and free flow of capital and investment ii. To comply with all applicable regulatory and disclosure requirements in the countries in which they invest
iii. To invest on the basis of economic and financial risk and return related considerations iv. To have in place a transparent and sound governance structure that provides for adequate operational controls, risk management, and accountability
The idea was to cover the main concerns regarding SWFs’ activity5. First, the way they fit within the policy framework and the policy coordination in their home countries. The establishment of a SWF can be a critical issue for the domestic economy6, Yinqiu Lu, Christian Mulder and Michael Papaioannou tried to identify the ideal conditions that justify the creation of this kind of funds. They highlighted the fact that even if they have benefits in terms of portfolio diversification and that during the recent financial crisis they have played a crucial role in their home economies, an assessment of their impact on the economic policy objectives and potential sovereign balance sheet risks is necessary. Secondly, their operations
4
IWG member countries are Australia, Azerbaijan, Bahrain, Botswana, Canada, Chile, China, Equatorial Guinea, Islamic Republic of Iran, Ireland, Korea, Kuwait, Libya, Mexico, New Zealand, Norway, Qatar, Russia, Singapore, Timor-Leste, Trinidad and Tobago, the United Arab Emirates, and the United States. Permanent observers of the IWG are Oman, Saudi Arabia, Vietnam, the OECD, and the World Bank 5 For a more detailed discussion, see “Economics of Sovereign Wealth Funds, Issues for Policymakers” by the IMF, Chapter 5
may affect the global financial markets’ flows and prices. SWFs are long-term investors that are usually not leveraged. These characteristics provide them with the capacity to contribute to financial markets stabilization in case of distress. However, in certain cases it can also increase the price volatility when for example there are rumours surrounding a certain transaction. For example, the Qatar Investment Authority’s failed takeover in February 2007 on J. Sainsbury badly impacted the stock price. Third, a good corporate governance of SWFs is also a critical issue. There have been a number of works with the aim to rank the level of transparency of these funds, especially relevant is the blueprint for SWF best practices developed by Edwin M. Truman7. Fourth, one of the main issues concerns SWFs’ investment objectives and practices. I will develop more in detail this topic later by analyzing two empirical studies.
In line with this logic the GAPP are structured in the following way. A first section is oriented on the legal framework, the objectives and coordination with macroeconomic policies. Followed with a section on the institutional framework and governance structure, and concludes with some guidelines on the investment and risk management framework. Globally the GAPP insist in the need for a strong institutional framework and governance structure, combined with clear investment strategies in accordance with the fund’s main objective. This work should be supported by a reliable risk management framework for accountability purposes.
The fact that the initiative came from SWFs countries and their ability to reach a consensus in such a short time demonstrate their strong commitment for a greater transparency and cooperation with the recipient countries of their investments. However there is still a lot of work to be done and as the merger and acquisitions activity is increasing again, and through it SWF visibility, this seems a priority. In this sense the establishment of the International Forum of Sovereign Wealth Funds (IFSWF) as a successor of the IWG is another step in the right direction. The objective of this entity is to gather some feedback regarding the implementation of good practices.
The OECD also contributed to the whole process providing the IWG with its expertise and developing a guideline for recipient countries’ policies in order to avoid any kind of
protectionism. The OECD already had a number of investment policy principles8 that should be applied to the treatment of all foreign investors, including SWFs (April 2008)9:
Non discrimination, between domestic and foreign investors
Transparency, any restriction towards foreign investor should be clear and accessible Progressive liberalisation
Standstill, avoid including new restrictions
Unilateral liberalisation, avoidance of reciprocity
The report also includes some guidelines that directly address the national security issue. A number of countries use this aspect in order to introduce restrictions to foreign investments. Kathryn Gordon10 noticed that the tendency over several decades has been to expand the number of risks covered by national security plans. From preserving national boundaries and integrity of the state against foreign attacks, to the extent of covering all major sources of threat to the security of a nation. As with the IFSW, the existence of the Freedom of Investment (FOI) process roundtables help to monitor the countries’ adherence to these principles and provide a forum for experience sharing and for exerting peer pressure.
8 The OECD general investment policy principles are established in the OECD Code of Liberalisation of Capital Movements, adopted by the OECD country governments in 1961, and the OECD Declaration on International Investment and Multinational Enterprises of 1976 as revised in 2000, adopted by forty-one OECD and non-OECD country governments.
9 OECD (Organisation for Economic Co-operation and Development), 2008, “Sovereign Wealth Funds and recipient countries - Working together to maintain and expand freedom of investment”
2. A review of empirical research on SWFs’ investment strategy
As we have seen there are a number of issues surrounding SWFs’ activity, especially regarding their transparency, investment strategies and the possible presence of political objectives. A number of papers tried to find out if these concerns are justified, the idea was to compare their investment behaviour to those of other institutional investors. I decided to focus the review on these three aspects as they seem to be the most important ones for the recipient countries of SWFs’ investments and consequently a critical point in the SWFs’ capacity to invest abroad.
The foreign ownership of these funds combined with a lack of transparency regarding their structure and activities difficult their work. I experienced how difficult it was to find information regarding their investments or strategy when constructing my database.
In most of the empirical studies they try to find parallelisms between SWFs’ activities and the impact of their investments, and those of other institutional investors (e.g. J. Kotter, U. Lel, 2011).
The review is structured in the following way. First, the impact of SWFs’ investments on the target companies is analyzed. Secondly, identify what are the target companies’ characteristics. Third, quantify the impact of SWFs’ transparency on the companies’ valuation. Finally, analyse if the political relation between the SWF domestic country and the recipient country may influence the investments decisions.
2.1. SWFs’ impact on target firms
The impact of SWFs on target firms can be studied in the context of the literature on large shareholders as generally they invest large amounts in the target companies (e.g., Holderness, 2003; Lins, 2003; Claessens, Djankov, Fan, and Lang, 2002). As a starting point in their paper, Kotter and Lel11 (2011) do a review of all the possible outcomes associated with large shareholders. In this context SWFs can be associated with favourable outcomes for the shareholders of target firms through active monitoring and certification of the quality of the target firm (e.g., Shleifer and Vishny, 1986; Ferreira and Matos, 2008; Li, Moshirian Pham, and Zein, 2006). As we have seen during the recent financial crisis SWFs’ access to cash can certify the long-term viability of the target firm. Other studies however point out the fact that SWFs could expropriate wealth from minority shareholders by transferring assets out
11 For a more detailed discussion, see Jason Kotter, Ugur Lel, “Friends or foes? Target selection decisions of sovereign wealth funds and their consequences”, Journal of Financial Economics 101 (2011) 360-381
of the country for example (e.g., Shleifer and Vishny, 1997; Johnson, La Porta, Lopez-de-Silanes, and Shleifer, 2000). This kind of situations could help to trigger protectionism measures in behalf of the national security. Another source of problems is the government ownership, because SWFs are government-owned, their target firms are indirectly partially government-owned as well. Shleifer and Vishny (1994) examine the role of political influence on firms and note that “public enterprises are highly inefficient and that their inefficiency is the result of political pressures from the politicians who control them” (page 995). The high level of corruption in some countries holding a SWF supports the idea that their objectives may not be driven by a risk-return profile.
De Palma, Leruth, and Mazarei12 examine the possibility of reducing the concerns about the possible political motivations behind SWFs’ investment decision using fund managers located in the recipient countries. Through the agency theory they arrive to the conclusion that this is not a solution and that this could lead to further protectionism from recipient countries. They cover a large range of assumptions, including other objectives than the profit maximisation, like learning by investing. They suggest that a possible solution is the one adopted by the Temasek fund in Singapore, which created a new division including third party investors like the general public.
Short-term impact
Among others, it seems that transparency and accountability are key factors in evaluating a SWF investment’s impact on the target firm. In the empirical study realized by J. Kotter and U. Lel (2011) they decide to focus on these two aspects. They were able to identify 827 investments made by SWFs between 1980 and 2009. From this initial sample, after withdrawing IPO and firms without publicly traded equity, they had a final sample consisting of 417 investment events in 326 unique firms. SWFs have invested in 45 different countries in their sample, showing a high level of geographic diversification. Concerning their database the main problem was that almost one third of the investments were made by Temasek Holdings, however they checked the robustness of their results to the exclusion of this fund. Most of the announcements were after 2004, this shows the recent increasing activity of SWFs. Finally, most of the investments (75%) were cross-border, highlighting the fact that most SWFs’ investments are made outside their domestic country.
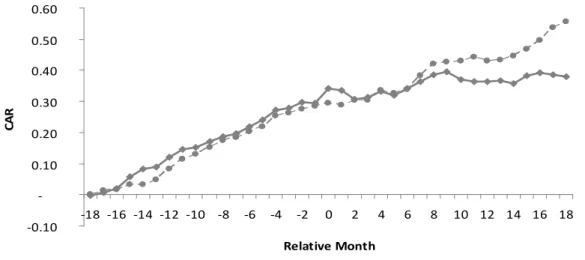
Their study is particularly interesting to see the SWF’s investment impact in the short-term. To evaluate the impact on target firms they calculate abnormal returns13 and then average them across firms to form the average abnormal return. They also used other methods to calculate the abnormal returns reaching similar conclusions. They find a positive and statistically significant market reaction consistent with studies on institutional investors in similar conditions (e.g., Brav, Jiang, Partnoy, and Thomas, 2008).
They use event windows of (0, +1), (-1, +1), and (-2, +2) days around the announcement date, in my opinion this is the most critical point of their study. Usually SWFs do not communicate their investments and it is very hard to find any information about the deals. I used the same methodology to construct my database consisting in identifying the transactions by searching in the news articles using Factiva. For the same deal there are a lot of articles and it is difficult to identify the first one, whose date we can consider as the announcement date. For such a small time window it is hard to know when the different market participants integrate the news in the target firm’s stock price.
In the paper of Somnath Das, Kyonghee Kim and Sukesh Patro about the Anomalous stock price response to management earnings forecasts14, they found that in the post-announcement period, there is a significant upward price drift for both good news forecasts and bad news forecasts. This is due, according to them, to the correction of the stock price because there is an over reaction to bad news and an under reaction to good news before the announcement. We could wonder if analyzing the investment impact of SWFs in such a small window could be affected by this kind of effects. All the rumours surrounding the investments of these funds may affect the stock price in the same way as speculation regarding the future earnings before the announcement. The positive reaction would be explained by this kind of phenomenon. This is just an hypothesis that should be checked by further empirical analysis, however through it I try to highlight the fact that in my opinion it is very difficult to extract conclusions when the time window is very small as there can be a lot of “parasite” effects.
It is true that Kotter and Lel examine in their research paper other possible explanations to the positive effect of SWFs’ investments. They study three other possibilities: liquidity effects by block purchases of SWFs, SWF-related shareholder activism and
13
They estimate a market model for each firm using local currency daily returns, and the US dollar-denominated MSCI ACWI as a proxy for the market return. They calculate the model coefficients using the ordinary least squares method for a 160 days window between day -180 and -21 relative to the announcement date. This coefficients are used to calculate abnormal returns from day -10 to day +20
14 For a more detailed discussion, see Somnath Das, Kyonghee Kim and Sukesh Patro, 2011, “On the Anomalous Stock Price Response to Management Earnings Forecasts”, Social Science Research Network
information effects resulting from the stock selection abilities of SWFs. Concerning the liquidity they use three different methods15 arriving to the same conclusion for all of them, the results on the short-term impact are not driven by a liquidity effect. Overall the methods seem appropriate, my only worry resides in the fact that in one of them they assume that because the positive impact on the stock price continues 20 days after the announcement there is no block purchase effect16. However they do not study the depth or resiliency of the markets involved in order to asses the magnitude of the block purchase impact. Concerning the shareholder activism a number of variables used and discussed later show that SWFs play a limited role in shareholder activism. Finally, the last possibility that they explore is that the positive impact may be explained by the fact that investors see SWFs as information producers. However, Kotter and Lel find only partial evidence for this possibility. It would have been interesting to see the role of speculation. The fact that sometimes SWFs invest in countries where the financial markets are not regulated enough allows for the possibility for insider trading issues, leading to an increase in the stock price surrounding the investment. For example, there were rumours of insider trading issues in the purchase of a 49.6% stake by Temasek Holdings of the Shin Corporation in March 2006.
In Kotter and Lel’s study they make a very interesting analysis by examining the market reaction for investments made by a fund that has increased its “level of transparency” at a certain moment. This is the case with the Government of Singapore Investment Corporation (GIC) that decided to start to disclose its investment results in July 2006. They find that firms previously targeted by GIC experienced a statistically significant increase in their share price on the day of the announcement. Overall, empirical studies suggest that SWFs’ investments induce positive information about the target firms to market participants.
Long-term impact
It is more interesting in my opinion to see SWFs’ investments impact on target firms in the long-term. In this case the empirical study of April M. Knill, Bong Soo Lee and Nathan Mauck is particularly interesting17. The most interesting aspect of their work is that they analyse the target firms’ performance taking into account the level of risk. It is essential to
15
For a more detailed discussion, see Jason Kotter, Ugur Lel, 2011, “Friends or foes? Target selection decisions of sovereign wealth funds and their consequences”, Journal of Financial Economics 101, 376
16 Block purchases of a firm’s shares can increase stock prices due to buying pressure
17 For a more detailed discussion, see April M. Knill, Bong Soo Lee, Nathan Mauck, 2012, “Sovereign wealth fund investment and the return-to-risk performance of target firms”, Journal of Financial Intermediation 21, 315-340
evaluate the level of the returns with respect to the risk, even with abnormal returns. They found that target firms raw returns decline following the SWF investment, also the risk declines. However, SWFs’ investments are associated with a reduction in the compensation of risk over the 5 years following the acquisition.
The results obtained are consistent with the predictions from the government ownership literature which predicts a negative impact on the target returns when SWFs invest abroad. Concerning the investments of SWFs in their domestic countries the results are mixed. The risk is higher for foreign investments and relies essentially on the relationship between the two nations (this point will be discussed later). Overall these effects induce a reduction in the return-to-risk performance.
From the institutional investor literature we could expect an increase in returns. This increase according to empirical research comes in part from the monitoring benefits of blockholders (e.g., Shleifer and Vishny, 1986; McConnell and Servaes, 1990). In the case of SWFs is not clear as a lot of them do not acquire control rights via voting share or board seats, sometimes for policy reasons or in order to avoid any conflicts with the recipient country. In other cases, they cannot acquire any voting rights, like for example in the acquisition of a 5% stake of Areva by the Kuwait Investment Authority in December 2010. In Dewenter et al. (2010) empirical study they also discuss the fact that the size of the investment block can play a role in the impact of monitoring. They found that there are gains of monitoring for blockholders owning less than 40% of the target firm, and decreasing positive returns (due to tunnelling) for blockholders above this limit. Concerning the risk the literature shows that there is a positive relationship between the block size and the idiosyncratic volatility (e.g., Heflin and Shaw, 2000; Brockman and Yan, 2009). The agreed explanation is that this is due to the information produced by blockholders.
In conclusion, the deterioration in the risk-return profile is consistent with both the government firm ownership and institutional investor literature for stakes above 40%. However, the large variety of investment styles that I could observe when constructing the database makes me think that we should be cautious considering these results. Some SWFs were very aggressive, trying to acquire in all their investments majority stakes, while others used to take small stakes.
To measure the return-to-risk performance A.M. Knill et al. (2012) used both the Sharpe ratio and the Appraisal ratio. The first one allows them to focus on the total risk, while the second one focuses on the compensation of idiosyncratic risk. They use a benchmark
procedure18, they check the correctness of their benchmarks by comparing their risk-return profile, standard deviation of returns and idiosyncratic risk with those of the target firms.
The final conclusion of their work is that target firm’s performance is closer to the performance of government-owned firms. Even if in terms of investment strategies, procedures and objectives SWFs try to behave the same way as institutional investors, the target return-to-risk performance after the acquisition is not the same. For A.M. Knill et al. the main issue is that there is a lack of compensated risk borne by the existing shareholders of the target firm. This point may be the most relevant for policy makers. To check that their results were not specific to their sample they examined the impact for smaller time windows. Their results are consistent with the research of J. Kotter and U. Lel. (2011). Finally, they conclude that there is no evidence that SWF investments influence firms’ financial or operational performance in the long run, suggesting too that shareholder activism is not common among SWF.
In conclusion, we can find in the literature evidence that in the short-term SWFs investments have a positive impact on target firms. The level of transparency is a key element in determining the level of this impact. However, in this case the level of risk is not taken into account and in my opinion it is hard to find the source of this improvement in such a short time window. In the long-term the effect seems to be negative or insignificant. In this sense the study of A.M. Knill et al. (2012) is very interesting as they have taken into account the level of risk. They arrive to the conclusion that there is deterioration in the target firm’s return-to-risk performance and a lack of compensated risk borne by existing shareholders.
2.2. Target firms’ profile
An important point in trying to identify if SWFs behave as other institutional investors concerns the target firms’ profile. In their empirical study J. Kotter and U. Lel (2011) consider several firms’ characteristics in order to determine the characteristics of the target firms. For the firm performance they use the annual stock returns, ROA19 and sales growth. They analyse the level of leverage through a ratio defined as total debt divided by the market value of equity. In my opinion this measure is not the best one as there can be a lot of speculation surrounding the market value of equity, especially when there have been rumours of a takeover bid, net debt to EBITA may be more appropriate.
18 They compare the return and risk of target firms to those of similar firms. They match them using three criteria: country, industry and size. For the industry they use the Datastream’s Global Industry classification
To evaluate the level of financial constraint they use the ratio of cash assets to total assets and the KZ Index20. They also control the level of know-how and uniqueness of the firm with the ratio of intangible assets to assets. To control the level of managerial agency conflicts they check the percentage of shares held by inside shareholders. They use the natural logarithm of the market value of equity to check the degree of informational asymmetry, according to them smaller firms tend to be more opaque. This criterion may not be totally accurate, we have some examples of big corporations that are also completely opaque. It is true that in general big firms are covered by a higher number of analysts that allows reducing the level of asymmetry. The number of press releases may be more precise but would be difficult to extract. In their research they also control the level of internationalization through the ratio of foreign sales to total sales, I find this point very interesting as it can be a critical point for SWFs. I think it would be interesting to use the foreign offices’ coverage too, as this variable may be representative of the firm’s willingness to expand.
They also explore the possibility that SWFs try to diversify by investing in companies with sensitivities different from theirs. This is why they calculate the sensitivity of targets’ stock prices to changes in oil prices, foreign exchange rates and global stock market indices21. Three time-varying country-specific variables are used to evaluate if there is a momentum in SWFs’ investments. The ratio of stock market capitalization to gross domestic product is used for the level of financial market development of the target country. This is a question I would like to explore in order to find out if SWFs invest abroad only for diversification purposes or because the local market is not able to absorb the huge amount of capital. In other words, would they invest so much abroad if their local market was developed enough? There are some clues in answering this question in the fact that SWFs in countries were the local market is more developed tend to invest a lower portion abroad. For example, the SWFs of Singapore, Temasek Holdings and the Government of Singapore Investment Corporation, invest around 15% of their funds in the local market in my sample, this is higher than for funds located in countries with less developed financial markets.
They use a dummy variable that equals one if the country experiences a financial crisis22 and they also control the legal environment of the target country23. This last variable
20 Based on Kaplan and Zingales (1997) and Lamont, Polk, and Saa-Requejo (2001) 21
Using regressions on the WTI Oil Index for oil, for exchange rates the percent change in the nominal major currencies dollar index and for the global stock market index the value-weighted DataStream world market return index. A minimum of 60 days is required in estimating the sensitivities
22 Obtained from Laeven and Valencia (2008)
may not be really interesting as I believe that the legal aspect is more determined by the bilateral relationship of the domestic country and the target country than by the legal environment. The strength of investor protection laws in target countries can change rapidly and especially in countries where they are relatively weak. I will explore the political aspect in the investment decision in another section.
The results of J. Kotter and U. Lel (2011) suggest that SWFs invest in firms with poor prior financial performance. This is consistent with the public pension literature (e.g., Del Guercio and Hawkins, 1999) and other empirical studies on institutional investors (e.g., Wahal, 1996; Carleton, Nelson, and Weisbach, 1998). It would be interesting to understand why they do that, it would be logical if the objective of these funds was to monitor these firms in order to improve the performance. However, empirical research suggests the opposite (e.g., J. Kotter, U. Lel, 2011) as the variables related with the degree of managerial agency conflicts are not statistically significant showing that SWFs are not related with a monitoring role.
They also prefer large firms, again in accordance with the public pension funds (e.g., Karpoff, Malatesta, and Walkling, 1996; Gompers and Metrick, 2001) and institutional (e.g., Ferreira and Matos, 2008) literature. Maybe they have liquidity considerations in order to be able to exit from the investment. They also target financially distressed and cash-constrained firms. In this case they probably look for the best entry point for their investments, firms facing these kind of problems generally have an important stock price discount. They prefer multinational firms, in developed countries and during crisis periods. In my opinion, the fact that they invest in multinational firms does not mean anything, now-a-days the proportion of large companies internationally diversified is very high. I think that the results of Chhaochharia and Laeven (2009) are more interesting in this aspect, showing that SWFs tend to invest in countries with similar cultures to their own. For them the reason for such a pattern is an effort to limit the information asymmetry inherent in international investment. When constructing my database I noticed that Asian funds tend to invest in Asia while Middle East funds in UK and the US. For gulf countries the main reason may be the strong Anglo-Saxon influence. The fact that they invest in developed countries is in my opinion biased in the study. Kotter and Lel (2011) used only listed companies for their research, only developed countries have financial markets sufficiently mature in order to receive SWFs’ investments in terms of liquidity and size. The crisis period conclusion can also be biased. The increasing activity of SWFs these last years, most of the announcements are from 2004 onward, and the important financial crisis that the world suffers since 2007 can have an impact on the results. The target firms’ characteristics, financially distressed and cash-constrained are also linked to
this “crisis bias”. Especially because SWFs were among the only ones during the crisis to have an access to cash, they were relatively solicited to inject cash in a wide range of companies and especially financial institutions.
They found that the preference for target firms facing financial difficulties is more pronounced in more transparent SWFs associating them with a potential certification effect. More opaque SWFs prefer firms with a higher market beta located in countries with weak protection of investor rights.
As we can see J. Kotter and U. Lel (2011) arrive to the conclusion that SWFs are similar to institutional investors in their preference for assets characteristics, in line with the conclusions of April M. Knill, Bong Soo Lee and Nathan Mauck (2012).
2.3. The role of SWFs’ transparency
One of the main concerns regarding SWFs is their lack of transparency regarding their operations and investment strategies. A lot of them do not disclose any information and even do not have an official website. In this sense investigating the impact of their level of transparency on the target firms is interesting in order to asses the need for more regulation in this area.
Kotter and Lel (2011) arrive to the conclusion that target firms experience higher abnormal returns when a greater amount of information is available to market participants about SWFs’ activities. One of the criteria used is the media exposure, defined as the number of news articles published about a SWF in a given year. They find that firms targeted by SWFs with a greater media exposure (one standard deviation above the mean for this variable) experience about 5.1% percentage point higher abnormal returns when compared with firms with an average value of the media coverage variable. The market reaction is higher for firms experiencing financial difficulties, for Kotter and Lel (2011) this is due probably to the fact that investors expect SWFs to recapitalize the firm in case of higher future distress. In my opinion this can be explained too by an under valuation of this kind of firms before the investment. They also analyse the impact of higher media coverage for the target firm. They find that there is a negative relation between the media coverage of the target firm and the market reaction. In other words, if the target firm is more opaque, the market reaction is higher. It is hard to believe that this effect can be explained by the monitoring role of SWFs, as other results suggest that they play a limited role in this sense. Sometimes the investment decisions are taken at a political level, involving the government of both the recipient country of the target firm and the domestic country of the SWF. I could
observe that this is particularly true for more opaque firms when constructing my database. I think that the higher market reaction for this kind of firms can be explained by the fact that the market participants believe that the SWF has access to additional information.
Another measure of transparency used by Kotter and Lel (2011) is web registry24, they arrive to a similar conclusion than for media coverage. They also use Truman indices as a measure of transparency. In terms of results the most important Truman index is the SWF transparency and accountability index.
In their robustness check they use alternative measures of transparency, like the number of private industry directors on SWFs’ boards, they believe that these managers would probably be less influenced by political reasons. However, the study of De Palma, Leruth, and Mazarei25 suggests that the use of external fund managers do not reduce the political motivation issue. We could consider private industry directors as a kind of external fund manager, even if they are not located in the target firm’s country, as suggested by the study. In general, the alternative measures do not change the results previously obtained.
It would be interesting to perform an analysis using the publication of results as a transparency criterion. Kotter and Lel (2011) made a similar experiment with the Government of Singapore Investment Corporation (GIC) when they analysed the possible sources of the higher abnormal returns. It would be interesting to extend this experiment to all the SWFs and study a bit more this aspect.
In conclusion, the stock price impact is higher for target firms in a difficult financial situation and when there is more information available on the acquiring SWF.
The Truman index26
The concerns regarding the transparency of SWFs have contributed to the development of a number of indices with the objective to classify these funds depending on their level of transparency. The work that is more often mentioned is the one made by Edwin M. Truman. In his study he tried to design a blueprint for SWFs in order to be able to classify them.
For Truman, “the growth of SWFs reflects a dramatic redistribution of international
wealth from traditional industrial countries like the United States to countries that
24 The presence of a dedicated website. Because this does not guarantee that there is more information available they also create an interaction variable with the transparency index of Truman (2008) arriving to similar results
25 For a more detailed discussion, see “Economics of Sovereign Wealth Funds, Issues for Policymakers” by the IMF, Chapter 8 26 For a more detailed discussion, see, Edwin M. Truman, “A blueprint for Sovereign Wealth Fund Best Practices”, Peterson Institute
historically have not been major players in international finance and have a little or no role in shaping the practices, norms, and conventions governing the international financial system”. This sentence reflects for me much more than the actual issue surrounding SWFs. It
illustrates the complexity of the future international relations in a context of globalized economy. Truman points the fact that one issue of the actual situation is that governments own or control a substantial share of the new international wealth. This transfer from private to public hand has to be addressed as it constitutes a challenge for the actual private-sector, market-oriented framework.
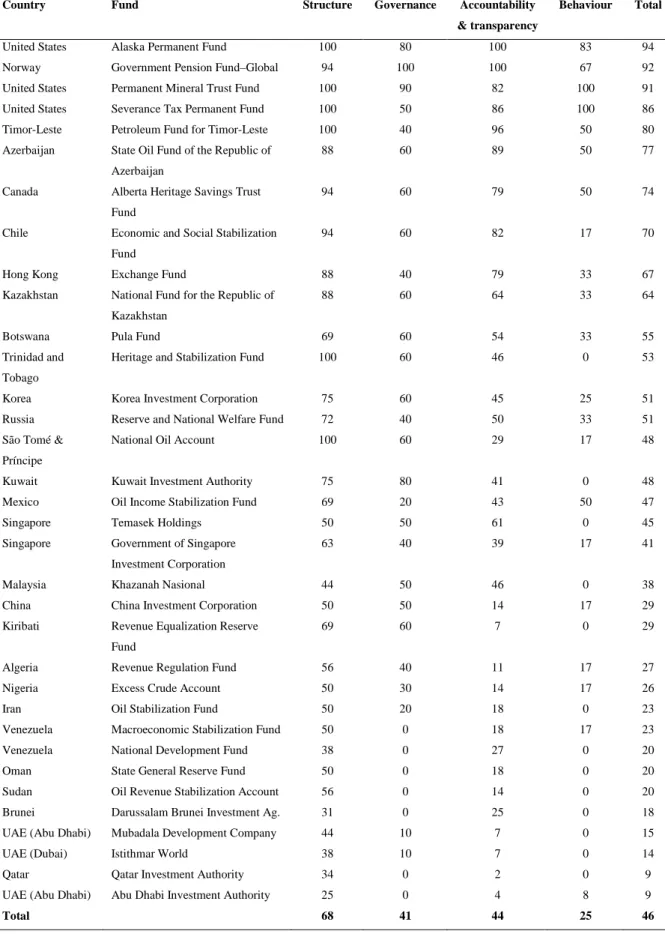
In my opinion the strongest point of the Truman index is that it is designed with the idea of incorporating only practices that at least one SWF already do. He also scores pension funds that are government owned or government controlled as he considers that in the context of best practices those ones are also concerned. His scoreboard contains 33 elements, constructed as questions and organised in four categories. The first one is the structure of the fund, including its objectives, fiscal treatment, and indicating if it is separated from the country’s international reserves. The second one concerns the governance of the fund, the roles of the government and the managers, and if the fund follows guidelines for corporate responsibility and ethical investment behaviour. This last point may be a bit excessive as even a lot of institutional investors do not follow this kind of guidelines. The fourth category focuses on the accountability and transparency of the fund in its investment strategy, investment activities, reporting, and audits. Kotter and Lel (2011) found that this one was the most important in determining a SWF’s transparency, at least for the market participants. The last category concerns the behaviour of the fund in managing its portfolio and the use of leverage and derivatives. In his approach Truman also tries to cover the main principles that at that time (April 2008) have been enunciated by the G-7, US and EU officials.
The scoring system is very simple using yes and no questions. The accountability and transparency component of the scoreboard contains 14 elements divided in four subcategories, investment strategy implementation, investment activities, reports and audit. In the investment activities section it is interesting to note that only 78% disclose their size. For Truman the most plausible reason for nondisclosure is that the citizens of the country, knowing how large the assets of the SWF are, will mobilize politically to obtain immediate access to them. However, for Truman whatever the reason they have not to disclose the size as a strategy to deal with these pressures can only exacerbate these issues in the long-term. Annual reports are published by 53% of non pension funds and quarterly reports only by 38%. Concerning the audit section Truman differentiates “three levels” of audit. First, he checks if they are audited,
it is surprising to see that only 62% of the non pension funds are. Then he checks if the audit is published, only 32% of non pension funds. Finally, he checks if the audit is performed by an independent auditor, this is the case for 57%. This last criterion is very important in order to certificate the quality of the accountability.
According to Truman’s classification, the most transparent funds are the Alaska Permanent Fund and the Norwegian Government Pension Fund-Global27, scoring 94% and 92% respectively, of the total possible points within the four categories. In terms of accountability and transparency both scored 100% in this category. The least transparent are the Qatar Investment Authority and the Abu Dhabi Investment Authority with only 9% of the total possible points. Regarding the accountability and transparency they score 2% and 4% respectively, in this sense the information available regarding these funds is almost inexistent.
It is important to note that his work was published before the creation of the IWG and the adoption of the “Santiago principles”. Even that it is true that most of the ideas reflected in previous discussion between US and EU officials were similar to those adopted by the IWG. The scores of the different funds are a good starting point in evaluating SWFs’ transparency. However, since 2008 SWFs have worked in order to increase their level of transparency and reduce the concerns of the recipient countries of their investments. In this sense it would be interesting to recalculate the scores and analyse if there has been a real improvement. Other indices concerning the SWFs transparency are available like the Linaburg-Maduell Transparency Index which was developed at the Sovereign Wealth Fund Institute by Carl Linaburg and Michael Maduell. This index is similar to the Truman one and works like a scoreboard. However, it is simpler and only includes 10 principles, this is why I will not enter in more details regarding it.
2.4. The role of political relations in SWFs investments
One of the main concerns surrounding SWFs is the possibility that they may invest following other objectives than the risk-return optimisation. As SWFs are government owned, in the centre of this concern we find the bilateral political relation aspect. It seems logic to wonder if politics play a role in the investment decision and if it is the case to try to identify how. We have already seen in the past some political issues surrounding SWFs, even from those considered as examples in terms of transparency. This is what happened, for example, with the Singaporean fund Temasek Holdings’ takeover of the Thai telecom company Shin
Corp in March 2006. The company was owned by the Thai Prime Minister Thaksin Shinawatra and his family. A lot of issues surrounded the deal like suspicions of insider trading and strong protest coming from opposition groups which launched a campaign against Shin products. The deal finally took place but contributed to fuel an important political crisis in Bangkok, some people say that this issue was one of the main reasons that led to a military coup against the Prime Minister Thaksin. Another example is the takeover of the ports and ferries operator P&O group by Dubai Ports World, a subsidiary of the Investment Corporation of Dubai, in 2006. This deal led to a wave of opposition from many countries and especially the US, who did not appreciate the idea of a Dubai based firm controlling 6 ports in the US. Finally, Dubai Ports World was forced to sell its assets in the US.
As we can see, the political dimension is often present in SWFs’ investments. The paper of April Knill, Bong-Soo Lee and Nathan Mauck28 (2012) tries to explain the impact of political bilateral relations on the investment decisions. It is interesting because they also see the impact in the other sense, by examining the consequences of SWFs’ investments on bilateral relations. In their approach they also analyse the investment in two steps, where to invest and how much, and see the impact on each one. Then they compare their results in the context of the Foreign Direct Investment (FDI) literature.
Concerning the methodology, they are able to use data involving privately held firms allowing them to expand their sample and work on a bigger one compared to other studies. Their proxy for political relations is based on United Nations voting records as previously did Gupta and Yu (2009). This approach limits the coverage of nations to those with voting records. The rationale behind this proxy is that countries with more closely related votes are expected to have stronger political relations. With this data they obtain a measure of the degree of political proximity ranging from -1, if all votes are different, to +1 if all votes are the same. In my opinion the problem with this measure is that even if two countries vote in the same direction this does not mean that they have strong bilateral political relations. This could mean that one of the countries is exerting some pressures on the other, or maybe one of them is suffering a group effect. For robustness Knill, Lee and Mauck used other measures of bilateral political relations arriving to results that are qualitatively identical.
The results are mixed concerning the existence of a relation between SWFs’ investment decisions and bilateral political relations. As pointed out by Chhaochharia and
28 For a more detailed discussion, see April Knill, Bong Soo Lee, Nathan Mauck, 2012,“Bilateral political relations and sovereign wealth fund investment”, Journal of Corporate Finance 18, 108-123
Laeven (2009) SWFs tend to invest in countries with similar cultures to their own in order to limit the problems linked to information asymmetry and note that this variable is more pronounced in the case of SWFs than with other institutional investors. For them this is clearly a clue that SWFs may serve other interests than only profit maximisation. For Bernstein et al. (2010) there also seem to be political considerations in SWFs’ decisions. For them this issue is higher when a greater number of politicians are involved in the management of the fund.
In other papers, however, they do not find any evidence of such behaviour. This is the case for example of Karolyi and Liao (2010), who conclude that there is no evidence of
“resource misallocation due to political bargaining”.
As previously mentioned, it is interesting to try to understand the impact of bilateral political relations on SWFs’ investment decisions in the context of the literature concerning FDI. For Li and Vashchilko (2010) political relations are likely related to perceived political risk. Greater political risk is associated with greater investment costs and fewer inflows of funds. For them government policies relating to FDI are linked to political relations, and changes in the political relations are perceived as political risk. In this sense SWFs need to take into account this factor in order to be able to maximise the risk-to-return profile. As stronger political relations seem to have a positive impact on the investments we could expect a significant impact of political relations on SWFs’ investments.
In their study A. Knill et al. decide to divide the investment process in two stages29, first where to invest and second how much. In other words they start with the following hypotheses:
1. SWF investment decisions are positively related to political relations in both stages. They point out the need to analyze this hypothesis in a dynamic framework:
2. An improvement (deterioration) in political relations will lead to an increase (decrease) in SWF investment.
The problem here is that it is not clear from the literature if the direction of this impact will be positive or negative. This is why A. Knill et al. focus on the following hypothesis:
3. SWF investment Granger-causes political relations.
Following this hypothesis they focus on the work of Martin et al. (2008) that find that closed countries reduce their probability of war by increasing trade, thus political relations. However, once they become more open they may face a higher probability of war with an
individual partner as they are not so reliant on an individual partner anymore. This conclusion brings them to the following hypothesis:
4. In bilateral pairs including closed (open) nations, an increase in SWF investment will lead to a net improvement (deterioration) in political relations.
This is, in my opinion, the most interesting point of their work, they do not only focus in determining if political relations have a role in SWFs’ investment decisions, but they also try to find if the investment decisions affect political relations.
Concerning their results, the following things are interesting. They use a number of control variables in their cross-sectional analysis. One of them is the correlation between the SWF and target nation market returns over the sample period 1990-2009. According to the portfolio theory this correlation should be negative if SWFs invest internationally for diversification benefits. However, they find a positive relation, suggesting that they do not invest for diversification purposes, reinforcing their hypothesis of a positive relation between the political relations and their investments. In this case, I am not completely convinced about their explanation. SWFs tend to invest in big financial markets and usually their domestic market is quite small. In general big markets tend to drive other smaller markets, and this is even more the case when there is a financial crisis and the correlations among markets tend to increase. This is one of the main issues with diversification, as when its role becomes the most relevant, in case of a financial crisis, it turns useless as the level of correlation increases.
They are particularly surprised to find that there is a negative relation between SWF investments and bilateral political relations. Suggesting that when deciding where to invest they tend to prefer countries with which they have weaker political relations. This result is against their first hypothesis. They argue that this could be explained by the fact that sometimes the need for international diversification could lead to irrational choices. However, as previously mentioned, the correlation between the domestic markets of SWFs and their targets’ market is positive and invalidate this explanation. They conclude therefore that SWFs consider more than just financial considerations in their investment decision-making process. This result is robust when controlling for SWFs and target country specific characteristics.
When analyzing if political relations Granger-causes SWF investment their results are consistent with the previous findings in the static framework, suggesting a negative relation between SWF investments and political relations. However they recommend a case by case approach as they find evidence that it really depends on the country pair involved.
In the case of SWF investment Granger-causing political relations, they find some evidence, but its relevance is very small when compared to the previous causality relation.
Concerning the impact of SWFs’ investments on political relations depending on the level of openness of both SWFs and target countries they find results consistent with their initial hypothesis. SWFs’ investments lead to deterioration in political relations for open countries. The sign of the relation between SWFs’ investments and political relations for closed nations is positive but not significant.
To summarize, A. Knill et al. (2012) find evidence for a number of characteristics surrounding bilateral political relations and SWFs investments. Contrary to the FDI literature SWFs tend to invest in countries with which they have relatively weaker political relations. Political relations are an important factor in determining where to invest but matter less when determining how much to invest. Moreover, there is a negative relation between the bilateral political relations and the amount they invest. These facts suggest that SWFs do not behave as rational investors meaning that there is something else behind their investment decisions. Concerning the impact of their investment on political relations they find that it is positive for relatively closed countries and negative for more open countries. However, in my opinion, an important conclusion they reach is that the heterogeneity present in SWF investment profiles suggest that each case should be treated independently in terms of policy making.
3. Empirical study
3.1. Data and descriptive statistics
I used a similar methodology than J. Kotter and U. Lel (2011) to construct the database. The sample consists of SWF investment announcements that are hand-collected by searching Factiva using key words such “invest” or “stake” combined with the SWF name and its well-known subsidiaries. I used the list of SWFs available in the SWF Institute website (see Appendix A). The research was performed only on part of the list because I found more interesting to focus on the biggest SWFs in terms of AUM.
In order to increase the size of the sample and to verify the data gathered through Factiva, I also collected events by searching SDC Platinum for transactions involving the different SWFs I found using Factiva. Sometimes the information was also completed using the SWF’s official website.
The search results in a total of 586 events on which I was able to find at least the stake purchased and the announcement date. Concerning the announcement date it was not always the official one. Most of the SWFs do not even communicate officially about an acquisition, because of this it was not easy to identify the official date as sometimes a SWF’s intention to acquire a stake in a company was rumoured months before the acquisition was made. In this sense I decided to use as the announcement date the first appearance in a news article about a particular deal. On these 586 deals 251 are investments in firms without publicly traded equity. Of the remaining 335 the sample is further limited to cases were the information needed for the empirical test is available, as a consequence the size of the sample differs in the following sections. Only the publicly traded firms are used for the empirical study.
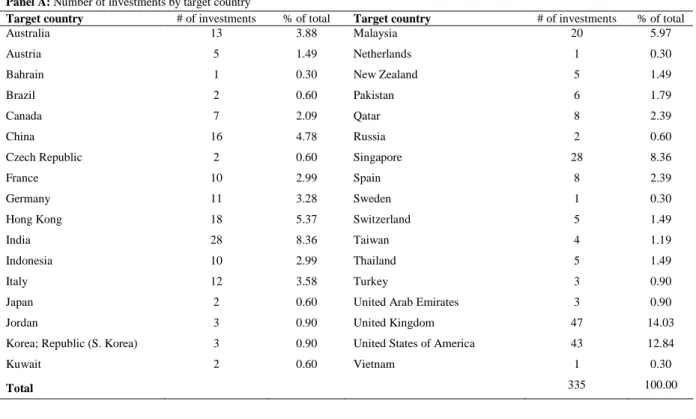
A summary of the events can be found in Panel A and B of Table 3. We can observe in Panel B that Singaporean SWFs are the most represented in the sample in terms of the number of investments, this is the case in most of the empirical studies on SWFs. Panel A displays the distribution of target firms countries for publicly traded firms only. The sample comprises investments in 34 different countries, with the United Kingdom and the United States attracting most of them. Most of the announcements are from 2004 to 2012, around 78% of the total sample.
Table 3. Descriptive statistics for the entire database
The following tables provide a distribution of the announcements of sovereign wealth fund investments by country membership of target firms and by acquirer SWFs. Panel A provides information on the distribution of SWFs’ investments of the country of the target firms for the publicly traded companies. Panel B displays the number of investments for each SWF present in the sample. In both cases a distinction is made between acquisitions involving private companies and publicly traded ones. The percentage each country or SWF represents in the total sample is also given
Panel A: Number of investments by target country
Target country # of investments % of total Target country # of investments % of total
Australia 13 3.88 Malaysia 20 5.97
Austria 5 1.49 Netherlands 1 0.30
Bahrain 1 0.30 New Zealand 5 1.49
Brazil 2 0.60 Pakistan 6 1.79
Canada 7 2.09 Qatar 8 2.39
China 16 4.78 Russia 2 0.60
Czech Republic 2 0.60 Singapore 28 8.36
France 10 2.99 Spain 8 2.39
Germany 11 3.28 Sweden 1 0.30
Hong Kong 18 5.37 Switzerland 5 1.49
India 28 8.36 Taiwan 4 1.19
Indonesia 10 2.99 Thailand 5 1.49
Italy 12 3.58 Turkey 3 0.90
Japan 2 0.60 United Arab Emirates 3 0.90
Jordan 3 0.90 United Kingdom 47 14.03
Korea; Republic (S. Korea) 3 0.90 United States of America 43 12.84
Kuwait 2 0.60 Vietnam 1 0.30
Total 335 100.00
Panel B: Number of investments by SWF
Private companies Publicly traded companies
Fund name Country
# of investments % of total # of investments % of total
Abu Dhabi Investment Authority UAE – Abu Dhabi 12 4.78 17 5.07
Government Pension Fund – Global Norway 1 0.40 2 0.60
SAFE Investment Company China 2 0.80 18 5.37
China Investment Corporation China 7 2.79 11 3.28
Government of Singapore Investment Corporation Singapore 28 11.16 34 10.15
Temasek Holdings Singapore 102 40.64 105 31.34
National Social Security Fund China 3 1.20 7 2.09
Qatar Investment Authority Qatar 8 3.19 41 12.24
New Zealand Superannuation Fund New Zealand 2 0.80 5 1.49
Investment Corporation of Dubai UAE – Dubai 18 7.17 16 4.78
Brunei Investment Agency Brunei 4 1.59 4 1.19
Khazanah Nasional Malaysia 25 9.96 32 9.55
Mubadala Development Company UAE – Abu Dhabi 8 3.19 5 1.49
Libyan Investment Authority Libya 6 2.39 12 3.58
Kuwait Investment Authority Kuwait 14 5.58 8 2.39
International Petroleum Investment Company UAE – Abu Dhabi 10 3.98 16 4.78
Korea Investment Corporation South Korea 1 0.40 2 0.60
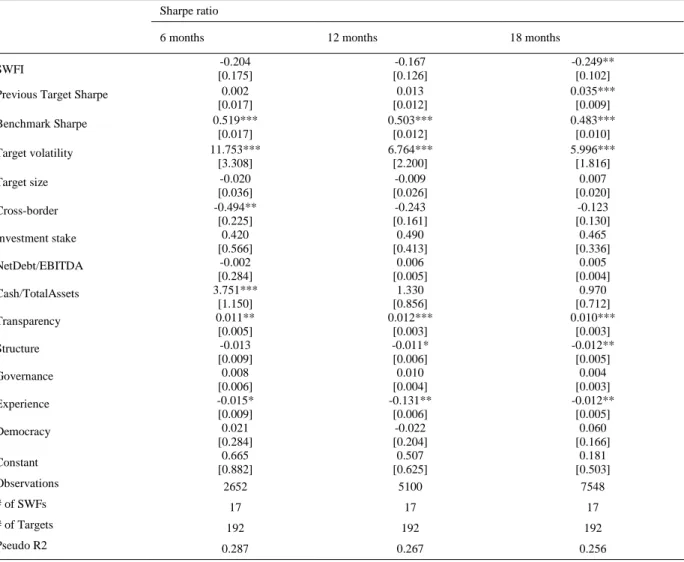
Table 4. Data characteristics for section 3.3. and 3.4.
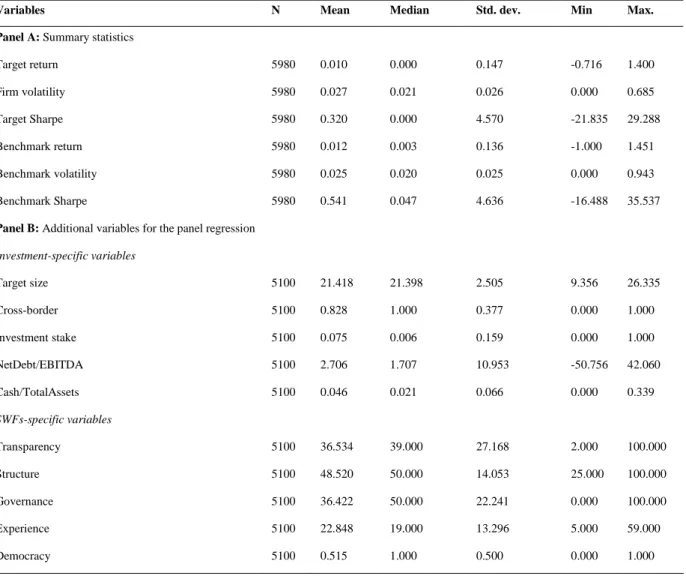
This table provides summary statistics for acquisition target firms 12 months before to 12 months after the announcement date. The sample is composed by 230 events in 197 firms. The target (benchmark) return is the monthly return of the target (Benchmark) of the SWF. The target (benchmark) volatility is the standard deviation of the daily excess returns over month t of the target (benchmark) firm. The Sharpe ratio uses the target excess return as the numerator and the standard deviation of the daily excess return as the denominator. The target size is equal to the natural log of the target market capitalisation one month prior to the event. Cross-border is an indicator variable equal to one if the SWF domestic country and target domestic country are the same and zero otherwise. Investment stake is the percentage stake acquired by the SWF in the target company, its value is zero in the months before the event. The NetDebt/EBITDA ratio is equal to the net debt divided by the EBITDA for a given year. The Cash/TotalAssets ratio is equal to the cash & cash equivalents divided by the total assets for a given year. Transparency, Structure and Governance are the scores obtained by the SWF involved in the event for each of these Truman indices. Experience is the number of years of existence of the SWF. Democracy is an indicator variable equal to one if the domestic country of the SWF is a democracy and zero otherwise. N is the number of observations used in my analysis.
Variables N Mean Median Std. dev. Min Max.
Panel A: Summary statistics
Target return 5980 0.010 0.000 0.147 -0.716 1.400 Firm volatility 5980 0.027 0.021 0.026 0.000 0.685 Target Sharpe 5980 0.320 0.000 4.570 -21.835 29.288 Benchmark return 5980 0.012 0.003 0.136 -1.000 1.451 Benchmark volatility 5980 0.025 0.020 0.025 0.000 0.943 Benchmark Sharpe 5980 0.541 0.047 4.636 -16.488 35.537
Panel B: Additional variables for the panel regression Investment-specific variables Target size 5100 21.418 21.398 2.505 9.356 26.335 Cross-border 5100 0.828 1.000 0.377 0.000 1.000 Investment stake 5100 0.075 0.006 0.159 0.000 1.000 NetDebt/EBITDA 5100 2.706 1.707 10.953 -50.756 42.060 Cash/TotalAssets 5100 0.046 0.021 0.066 0.000 0.339 SWFs-specific variables Transparency 5100 36.534 39.000 27.168 2.000 100.000 Structure 5100 48.520 50.000 14.053 25.000 100.000 Governance 5100 36.422 50.000 22.241 0.000 100.000 Experience 5100 22.848 19.000 13.296 5.000 59.000 Democracy 5100 0.515 1.000 0.500 0.000 1.000
In Table 5 we find summary statistics for all the variables employed in Section 3.3. and 3.4. The data displayed concerns only the 12 month window. In Panel A we have the data employed in section 3.3. In Panel B we have the additional data for the panel regression made in Section 3.4. (see Appendix E for a detailed definition of the variables and sources).