INTRODUCTION
The presence of off-flavors in fish raised in recir-culating aquaculture systems (RAS) represents one of the most significant economic problems related to product quality encountered in aquaculture. The presence of undesirable odors or tastes in fish may cause a major reduction in human consumption of the products, or make them unsuitable for sale. Among those flavors, the ‘earthy’ and ‘muddy’ odors constitute > 80% of the off-flavor problems
found in farm-raised catfish (Grimm et al. 2000). Such off-flavors come from the absorption by fish of substances including geosmin and 2methyliso -borneol (2-MIB), which are produced by a broad group of aquatic microorganisms (Gerber 1969, Tucker 2000, Bai et al. 2013). In our previous RAS studies, negligible MIB concentrations were found in fillets of arctic charr and rainbow trout; these studies also clearly revealed that off-flavor was caused mainly by geosmin (Auffret et al. 2011, Houle et al. 2011).
© The authors 2014. Open Access under Creative Commons by Attribution Licence. Use, distribution and reproduction are un -restricted. Authors and original publication must be credited. Publisher: Inter-Research · www.int-res.com
*Corresponding author: [email protected]
Reducing geosmin off-flavor compounds and waste
outputs through dietary phosphorus management
in rainbow trout aquaculture
Pallab Sarker
1, 3,*, Alexandre Pilote
1, Marc Auffret
2, Émilie Proulx
1,
Richard Villemur
2, Marie-Hélène Deschamps
1, Grant Vandenberg
11Département des sciences animales, Université Laval, Québec City, Québec G1V 0A6, Canada 2INRS-Institut Armand-Frappier, 531 Boulevard des Prairies, Laval, Québec H7V 1B7, Canada 3Present address: Environmental Studies Program, Dartmouth College, Hanover, New Hampshire 03755, USA
ABSTRACT: The aquaculture industry has long recognized the need to reduce phosphorus (P) waste outputs associated with environmental impact, and reduce off-flavor producing com-pounds, which can impact the quality of the fish product. This study was undertaken to investigate the effects of dietary high P (HP) and low P (LP) on growth, nutrient digestibility, P retention, and P loading as well as their correlation to the synthesis of geosmin-associated off-flavor in a recircu-lating aquaculture system of rainbow trout Oncorhynchus mykiss. The above diets were fed to quadruplicate tanks of rainbow trout (average mass ± SD: 127.4 ± 3.1 g) for 84 d. Results showed that the effects of the HP and LP diets on growth and P retention were not significantly different. While the apparent digestibility of P and other nutrients were higher in fish fed the LP diet, P waste outputs and geosmin levels in the fillets of fish were higher in fish fed the HP diet. Magne-sium (Mg2+), potassium (K+) and zinc (Zn2+) concentrations in tank water were significantly lower in fish fed the HP diet than the LP diet in most of the sampling events. Furthermore, the tank water geosmin concentration was not strongly proportionally correlated with tank water-soluble P con-centration for both the LP and HP diets. There was a strong proportional linear relationship between the geosmin concentration in tank water and in trout fillet for both the LP and HP diets. Results suggest that off-flavor contents in fish fillets and water were related to the dietary P level and metabolic P waste outputs into the system, findings that have implications for the formulation of sustainable diets for rainbow trout.
KEY WORDS: Recirculating aquaculture system · Metabolic phosphorus waste · Off-flavor · Geosmin · Oncorhynchus mykiss · Growth · Nutrient digestibility · Nutrient retention
O
PEN
PEN
Elevated phosphorus (P) levels in freshwater aqua-culture effluents may lead to environmental problems (Schindler 1977, Camargo & Alonso 2006), as intensive aquaculture can generate environmental P loading that may contribute to the eutrophication of sensitive receiving water bodies (Lall 1991, Sarker et al. 2013). Furthermore, it is often claimed that eutrophic waters are the most vulnerable to off-odors. The environ-mental factors known to lead to high levels of geosmin by producing nuisance blooms of some micro -organisms, such as streptomycetes, myxobacteria and cyanobacteria, include high nutrient concentrations and ratios (Smith & Bennett 1999, Downing et al. 2001, Robin et al. 2006, Schrader & Summerfelt 2010).
A number of investigators have re por ted that P concentration correlates with geosmin concentration (Saadoun et al. 2001, Robert-son et al. 2006, Robin et al. 2006, Dzialowski et al. 2009). Since the majority of P released by aquaculture operations is ultimately from dietary origin, effective management of waste outputs can be achieved through management of the nutrient composition of feeds. However, the literature lacks data on whether dietary P and the consequential meta bolic wastes can induce geosmin-asso-ciated off-flavor in RAS-raised rainbow trout. Our recent preliminary studies dem -onstrated that geosmin-associated off-flavor in rainbow trout correlates to elevated P levels in feed, resulting in the excretion of excess P into the water (authors’ unpubl.). We hypothesize that a high-P trout feed may induce geosmin-associated off-flavor in rain-bow trout raised in RAS. The purpose of the current study is to investigate the effects of dietary P levels on the synthesis of geosmin in water and trout fillet. In particular, our goal is to evaluate a low-P (LP) diet contain-ing 5.4 g kg−1total P and a high-P (HP) diet containing 13.0 g kg−1P using the response criteria of weight gain, nutrient digestibility, P retention, P waste outputs and geosmin concentrations in trout fillet and water.
MATERIALS AND METHODS Experimental diets, fish rearing, feeding
and design
Two iso-nitrogenous and iso-energetic diets were formulated, all based on the
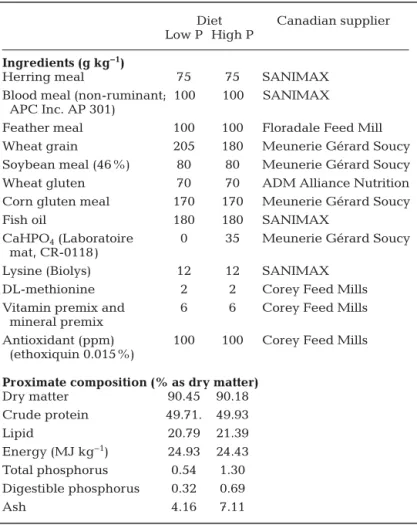
same basic feed containing balanced levels of es -sential amino acids, fatty acids, vitamins and miner-als, except for P and calcium (Ca) levels (Table 1). The 2 practical diets contained 5.4 and 13.0 g kg−1 total P (LP and HP, respectively). The HP is closest to that of standard fish feed for rainbow trout. The HP diet was obtained by supplementing 3.5% inorganic phosphorus salt (i.e. 35 g CaHPO4kg−1) in the basal diet. Rainbow trout Oncorhynchus mykiss (initial average mass: 127.4 ± 3.1 g) was used. The experi-mental set-up was arranged in a completely random-ized design; each diet was fed to 4 replicate rectan-gular tanks (380 l volume), each containing 43 fish. The feeding experiment was conducted in an RAS
Diet Canadian supplier Low P High P
Ingredients (g kg−1)
Herring meal 75 75 SANIMAX Blood meal (non-ruminant; 100 100 SANIMAX
APC Inc. AP 301)
Feather meal 100 100 Floradale Feed Mill Wheat grain 205 180 Meunerie Gérard Soucy Soybean meal (46%) 80 80 Meunerie Gérard Soucy Wheat gluten 70 70 ADM Alliance Nutrition Corn gluten meal 170 170 Meunerie Gérard Soucy Fish oil 180 180 SANIMAX
CaHPO4(Laboratoire 0 35 Meunerie Gérard Soucy
mat, CR-0118)
Lysine (Biolys) 12 12 SANIMAX DL-methionine 2 2 Corey Feed Mills Vitamin premix and 6 6 Corey Feed Mills
mineral premix
Antioxidant (ppm) 100 100 Corey Feed Mills (ethoxiquin 0.015%)
Proximate composition (% as dry matter) Dry matter 90.45 90.18 Crude protein 49.71. 49.93 Lipid 20.79 21.39 Energy (MJ kg−1) 24.93 24.43 Total phosphorus 0.54 1.30 Digestible phosphorus 0.32 0.69 Ash 4.16 7.11
Table 1. Oncorhynchus mykiss. Experimental diet formulation (as fed basis) and chemical composition (dry matter basis). Vitamin premix and mineral premix: supplied the following: as per NRC (1993) (to provide mg kg−1except as noted): retinyl acetate, 2500 IU; cholecalciferol, 2400 IU;
tocopheryl acetate, 50; menadione, 10; thiamin, 1; riboflavin, 4; pyrido -xine, 3; Ca-pantothenate, 20; vitamin B-12, 0.01; niacin, 10; biotin, 0.15; folic acid, 1; choline, 1000; inositol, 300; magnesium carbonate, 1.24 g; calcium carbonate, 2.15 g; potassium chloride, 0.90 g; sodium chloride, 0.40 g; potassium iodide, 0.4; copper sulfate, 30; cobalt sulfate, 0.2; ferric sulfate, 0.20 g; manganese sulfate, 30; zinc sulfate, 40; sodium fluoride, 10. Digestible phosphorus (P) = Total P in the diet × P digestibility/100
system at the Laboratoire Régional des Sciences Aqua tiques (LARSA), Université Laval. The recircu-lation rate was > 90%. The flow of makeup water, which was from a municipal source, dechlorinated and filtered (45 µm), was fixed at 20 l h−1for a reten-tion time of 3.5 d. Oxygen concentrareten-tion (90− 100% saturation) and water temperature (15.0°C) were monitored in real-time throughout the experiment. The pH (7.4) was measured once daily and sodium carbonate was added to maintain pH above neutral. Prior to the beginning of the growth trial, fish were acclimated for 2 wk with the LP diet. Tank by tank ba-sis pair-feeding was employed to supply the same quantity of dietary nutrients (feed) to the groups, but P supply was variable, as the dietary P content of the 2 diets differed. LP replicates were hand-fed until ap-parent satiation 2 times a day, and the same quantity was fed to HP replicates. The experimental de sign and protocols were approved by the Canadian Coun-cil on Animal Care (CCAC 1984) and the Animal Pro-tection Committee of Université Laval (CPAUL 2010). For the digestibility measurement of the diet, 1% Sipernat 50™ (a source of acid-insoluble ash [AIA]) was added to the diet as an indigestible marker. Microingredients were first mixed and then slowly added to the macroingredients to ensure a homoge-neous mixture. The ingredients were thoroughly mixed and steam-pelleted using a California Pellet Mill, and pellets were dried in a forced-air oven (22°C, 24 h), sieved and stored at −20°C.
Growth measurement and fish fillet preparation Fish were bulk-weighed at the beginning of the experiment, and then every 3 wk until the end of the experiment (84 d). At the start of the experiment, 5 fish were sampled from the initial population; after which 3 fish per tank were sampled every 21 d (Days 0, 21, 42, 63 and 84). The effects on growth were de termined by evaluating gain in fish mass, total feed consumption, specific growth rate (SGR), feed conversion ratio (FCR) and thermal-unit growth coefficient (TGC). Indices were calculated as follows:
Gain in fish mass = [(Final body mass −
Initial body mass) / Initial body mass] × 100% (1) FCR = Feed intake / Body mass gain (2) SGR = 100 × (ln Final body mass −
ln Initial body mass) / Days (3) TGC = 100 × (Final mass1/3− Initial mass1/3) /
Sum of daily water temperature (4)
At each sampling event, length and weight were determined, fish were immediately filleted and the skin removed. Two fillets per fish were stored in a Ziploc bag at −20°C for further geosmin (using solid phase micro extraction [SPME] with GC-MS) and lipid analysis.
Water sample collection
At every sampling time point, 3 water samples were taken in each tank from 3 different places. Indi-vidual water samples were stored in 20 ml glass scin-tillation vials, 6 g of NaCl and a magnetic stir bar were then added just prior to analysis. The vials were filled completely, as indicated by the fact that no air bubbles were observed when the vial was capped and inverted, and were then stored at 4°C for further geosmin analysis. Geosmin concentration was ana-lyzed the day after the sampling to avoid any reduc-tion of geosmin content of the samples. At every sam-pling time point, 3 water samples were collected from different places of each sand filter, biofilter and pump using 20 ml glass scintillation vials, and were stored at 4°C for further geosmin analysis. To determine the concentration of soluble reactive phosphorus, anions and cations that had accumulated in the tank, sand filter, biofilter and pump water filter, water samples were collected in triplicate into a disposable 15 ml falcon tube (containing 2 mM HCl) (Falcon®, Becton Dickinson) on Days 0, 21, 42, 63 and 84. Samples were stored at 4°C for further analysis.
Fecal collection
Feces were collected at the end of the feeding trial once a day for 2 wk via a modified Guelph system based on Cho et al. (1982) before the morning meal. Tanks were brushed and purged immediately and any uneaten feed residues and feces were flushed out of the fecal collection column after each feeding. The feces were decanted, excess water was removed and then the feces were stored at −20°C until the end of the 2 wk of feces collection. Feces were freeze-dried for 7 d prior to analysis to determine apparent digestibility coefficients (ADCs) for the nutrients.
Diet and feces chemical composition
A pool of different feed sizes was collected for analysis of the feeds. Dry matter, ash, crude
pro-tein, total lipid, and gross energy in feed and feces were analyzed according to standard procedures (AOAC 1990). Fillet dry matter was obtained by first drying the pools in a lyophilizer for 7 d, and then in a forced-air oven at 105°C overnight. Sam-ple weight was re corded before and after drying, followed by cooling in a desiccator (AOAC 1990). Feed and feces dry matter was obtained by drying only in the forced-air oven. Ash content was ob -tained by dry-ashing in porcelain crucibles in a furnace at 500°C overnight and expressed as dry weight (AOAC 1990). Gross energy was performed by bomb calorimetry (Parr Instrument Company) and calculated as percentage of dry matter. Crude pro-tein was evaluated using a LECO analyzer (model FP-2000), then a nitrogen (N) conversion factor of N × 6.25 was used, with crude protein expressed as dry weight.
Total lipid composition was performed with an Ankom lipid extraction instrument (XT-10, Ankom Technologies), the solvent being diethyl ether. Total lipids were expressed as dry weight. To determine the phosphorus concentration, acid digestion with 5 ml concentrated HNO3and 12.5 ml HCl (50%) solu-tion was used, and then resulting materials were filtered (Whatman paper No. 1) and then measured using an ion chromatography system (Dionex, ICS-3000).
Nutrient (P, N and energy) retention was calcu-lated as:
Nutrient retention (g kg−1fish) = 100 × [(Final biomass × Final nutrient concentration of the fish) − (Initial bio -mass × Initial nutrient concentration of the fish)] / Feed consumed × Nutrient concentration of the diet (5) Total P loading was estimated based on solid and dissolved P loading (solid P load + dissolved P load). Solid and dissolved nutrient (P, N and energy) load was calculated as follows:
Solid nutrient load (g kg−1fish) = [1 − Apparent nutri-ent digestibility coefficinutri-ent × Nutrinutri-ent intake (g kg−1
fish)] (6)
Dissolved nutrient load (g kg−1 fish) = {Apparent nutrient digestibility coefficient × [Nutrient intake (g kg−1fish) − Retained nutrient (g kg−1fish)]} (7) AIA in diets and feces were determined according to the official methods described by Keulen & Young (1977). The ADCs of P were calculated as described by Cho & Slinger (1979) using the following formula: ADC = 100 × [1 − (% Nutrient of feces / % Nutrient of diet) × (% Marker in diet / % Marker in feces)] (8)
Geosmin assay
The method of Lloyd & Grimm (1999) was used to analyze geosmin and MIB from the fillets and was modified as follows. Each fillet was placed into a glass distillation flask. The flask was then heated in a microwave oven (Daewoo, model TMW-1100EC) for 4 min 45 s at power level ‘4’ while purging with 80 ml l−1of N
2gas. The collected distillate was cooled in a polystyrene box filled with ice, and the volume was adjusted to 25 ml using Nanopure water. Each 25 ml sample was placed into a 40 ml glass vial containing 6 g of NaCl. Each vial was sealed with a crimp cap. The vials were stored at 4°C until the SPME-GC-MS analysis. Water geosmin content was determined in the same manner. Standard solutions (Supelco) were used to determine the molecular ion base peaks and the retention time. These values were monitored at specific mass to charge ratios (m/z) 95, 135 and 168 for 2-MIB and at m/z 112, 126 and 182 for geosmin. The retention time was 11.7 min for MIB and 19.7 min for geosmin. The limit of quantification was 0.001 µg kg−1in fish flesh, whereas the limit of detec-tion by human senses is approximately 0.6 µg kg−1 (Cook et al. 2001, Schrader & Rimando 2003). The human sensory threshold for geosmin in rainbow trout has been placed at 0.1 µg kg−1fish (Petersen et al. 2011). The protocol for detecting geosmin and 2-MIB using GC-MS was previously described by Lloyd & Grimm (1999) and Auffret et al. (2011).
Water analysis
Determination of the concentration of inorganic anions and cations was performed on duplicate sam-ples that were derived from the effluent of the fish culture tanks. Water samples (30 ml) were filtered through a 0.45 µm filter, and filtrates were analyzed (50 µl volume injection) using ion chromatography (ICS-3000, Dionex). Cations were analyzed with an IonPac AS17 column (4 × 250 mm) with a KOH eluent gradient (9− 30 mM, for 16 min) with 1 ml min−1flow rate at 30°C. Anions were analyzed with an IonPac CS16 column (5 × 250 mm) with methanesulfonic acid (42 mM) as eluent with 1 ml min−1flow rate for 16 min at 30°C. Ana lyses were performed according to methods described in the Appendix. The nitrite samples were analyzed according to the colorimetric method using a HACH DR-2000 spectrophotometer (HACH method 8155: salicylate, and method 8507: dia zotization, respectively). Transition metal concen-trations were determined using an an ion exchange
chromatography technique (ICS-3000, Dionex). The same analyses were performed according to the method described by Auffret et al. (2013) and fur-nished in the Appendix.
Statistical analysis
All data comparing LP and HP diets were sub-jected to the 2-tailed t-test with equal variance. Statistical analyses were carried out using the IBM SPSS program for Windows (v. 20.0). The sig-nificance of any ap parent differences between mean values was determined at the 95% level of confidence (p < 0.05), unless otherwise stated. Pearson correlation coefficients and the significance of any differences were analyzed for tank water P, water geosmin and fish fillet geosmin data using SPSS.
RESULTS
Trout reared on the LP diet had very slightly but not significantly greater (p > 0.05) final mean biomass gain than those fed the HP diet (Table 2). FCR varied be -tween 1.08 and 1.24. The FCRs for LP repli-cates were comparable to that of the HP diet. Neither TGC (0.12) nor SGR (0.91− 0.94) was significantly influenced by the dietary treatments throughout the experi-mental period.
The digestibility of dry matter, protein, lipid and ash varied significantly between the 2 diets (Table 3), and were significantly higher (p < 0.05) in fish fed the LP diet (73.9 ± 0.4%, 91.6 ± 1.0%, 84.4 ± 0.7%, and 44.6 ± 0.85%, respectively) compared to fish fed the HP diet (70.4 ± 1.2%, 85.1 ± 0.4%, 78.1 ± 0.9% and 37.3 ± 2.9% respec-tively). The digestibility of energy was not significantly influenced by the diets.
The ADC of P was significantly higher (p = 0.034) in fish fed the LP diet compared to fish fed the HP diet. The values for P retention at the end of the experiment were not significantly different, though P intake varied widely in the 2 diets (Fig. 1A). Nei-ther nitrogen (except solid) nor energy fractions were influenced by the dietary treatments (Fig. 1B,C). Regarding the con-centrations of dissolved and solid P waste,
there was a pronounced effect of the dietary P con-centrations. Both the dissolved and solid P waste out-put were significantly higher from fish fed the HP diet (3.0 ± 0.8 and 6.0 ± 0.2 g kg−1fish, respectively) than fish fed the LP diet (0.2 ± 0.6 and 2.3 ± 0.1 g kg−1 fish, respectively) (Fig. 1A). Similarly, trout fed the HP diet showed significantly (p < 0.001) higher con-centrations of phosphate in tank water for every sam-pling event until the end of the experiment (Table 4) than fish fed the LP diet. The concentrations of inor-ganic anions (NO2−, Cl−, SO42−) were not significantly different in the tank water of the fish fed the different diets on some sampling events. The cations, e.g. Fe3+ and Cu2+, were not significantly different in the tank water of the fish fed the different diets in all the sampling events throughout the experimental period (Table 5). The cations, e.g. Na+and Ca2+, showed no significant difference in the tank water of the fish fed the different diets on some sampling events. Magne-sium (Mg2+), potassium (K+) and zinc (Zn2+) concen-trations in tank water were significantly lower for fish
Parameter Day Treatment p LP HP
Individual wt (g) 0−21 159.5 ± 6.7 159.1 ± 4.0 0.496 21−42 190.0 ± 6.3 189.9 ± 2.9 0.618 42−63 228.1 ± 10.0 229.0 ± 5.4 0.604 63−84 275.6 ± 8.9 277.3 ± 2.4 0.311 Final mean wt gain (g) 146.8 ± 0.0 151.4 ± 5.1 0.380
FCR 0−21 1.17 ± 0.03 1.08 ± 0.18 0.464 21−42 1.09 ± 0.29 1.11 ± 0.11 0.897 42−63 1.15 ± 0.28 1.21 ± 0.08 0.748 63−84 1.17 ± 0.00 1.24 ± 0.00 0.682 Final mean FCR 1.14 ± 0.13 1.15 ± 0.06 0.480 SGR 0−21 1.02 ± 0.04 1.10 ± 0.15 0.360 21−42 0.78 ± 0.20 0.74 ± 0.07 0.688 42−63 0.93 ± 0.80 0.84 ± 0.06 0.535 63−84 0.82 ± 0.00 0.89 ± 0.00 0.440 Final mean SGR 0.94 ± 0.00 0.91 ± 0.02 0.180 TGC 0−21 0.11 ± 0.00 0.13 ± 0.01 0.383 21−42 0.09 ± 0.02 0.09 ± 0.01 0.667 42−63 0.12 ± 0.01 0.11 ± 0.00 0.558 63−84 0.11 ± 0.00 0.16 ± 0.00 0.417 Final mean TGC 0.12 ± 0.00 0.12 ± 0.00 0.170 Total feed fed (kg) 5.40 ± 0.00 5.40 ± 0.00 na Survival rate (%) 99.75 ± 0.50 100.00 ± 0.00 0.390 Table 2. Mean individual weight (wt) gain, feed conversion ratio (FCR) (see Eq. 2 in ‘Materials and methods’), specific growth rate (SGR) (see Eq. 3) and thermal-unit growth coefficient (TGC) (see Eq. 4) for rainbow trout Oncorhynchus mykiss fed low-phosphorus (LP) and high-phospho-rus (HP) diet. Survival rate = (Final number of fish/Initial number of fish)
fed the HP diet than the LP diet for most of the sam-pling events (Table 5).
The geosmin concentrations of trout fillets were higher in fish fed the HP diet versus the LP diet. A pairwise comparison showed significantly higher geosmin levels in fish fillet with fish fed the HP diet (3.13 µg kg−1and 2.42 µg kg−1) than fish fed the LP diet (1.29 µg kg−1 and 1.36 µg kg−1) for Weeks 3
Diet p LP HP Dry matter 73.91 ± 0.40 70.40 ± 1.16 < 0.001 Phosphorus 59.30 ± 1.09 53.17 ± 2.79 0.034 Protein 91.57 ± 0.96 85.13 ± 0.43 < 0.001 Lipid 84.36 ± 0.67 78.12 ± 0.90 0.012 Energy 75.97 ± 0.48 73.47 ± 0.30 0.760 Ash 44.60 ± 0.85 37.32 ± 2.92 0.018 Table 3. Apparent digestibility coefficient (ADC) (see Eq. 8 in ‘Materials and methods’) for dry matter, phosphorus, protein, lipid, energy and ash of rainbow trout Oncorhynchus mykiss fed low-phosphorus (LP) and high-phosphorus (HP) diet. Val-ues are mean ± SD (n = 4 tanks per diet). Significant valVal-ues
(p < 0.05) in bold
Parameter Day Treatment p LP HP Phosphate (PO43–) 0 0.58 ± 0.10 0.51 ± 0.01 < 0.010 21 0.00 ± 0.00 3.87 ± 0.02 < 0.010 42 0.00 ± 0.00 6.45 ± 0.10 < 0.010 63 0.02 ± 0.00 6.79 ± 0.18 < 0.010 84 0.04 ± 0.00 7.79 ± 0.06 < 0.010 Nitrite (NO2−) 0 0.05 ± 0.00 0.03 ± 0.01 0.136 21 0.20 ± 0.00 0.12 ± 0.00 < 0.010 42 0.16 ± 0.00 0.17 ± 0.00 0.046 63 0.17 ± 0.00 0.17 ± 0.00 0.201 84 0.16 ± 0.00 0.17 ± 0.00 0.018 Nitrate (NO3−) 0 49.06 ± 0.28 34.69 ± 0.18 < 0.010 21 101.28 ± 3.64 69.94 ± 1.84 < 0.010 42 148.70 ± 4.15 100.04 ± 1.91 < 0.010 63 125.70 ± 10.64 107.17 ± 3.29 0.036 84 177.30 ± 6.55 124.59 ± 0.79 < 0.010 Chloride (Cl−) 0 44.99 ± 0.18 39.48 ± 0.19 < 0.010 21 39.39 ± 1.44 39.86 ± 0.57 0.517 42 42.33 ± 1.13 37.59 ± 0.72 0.014 63 26.19 ± 2.22 28.70 ± 2.78 0.385 84 24.64 ± 0.93 23.22 ± 0.13 0.040 Sulfate (SO42−) 0 19.93 ± 0.41 18.51 ± 0.40 0.011 21 22.69 ± 0.87 21.11 ± 0.84 0.043 42 29.00 ± 1.05 24.60 ± 0.48 0.010 63 23.22 ± 2.01 23.38 ± 0.76 0.880 84 31.46 ± 0.90 26.08 ± 0.23 < 0.010 Table 4. Concentration (ppm) of inorganic anions in tank wa-ter at each sampling event for rainbow trout Oncorhynchus mykiss fed low-phosphorus (LP) and high-phosphorus (HP) diet. Values are mean ± SD (n = 4 tanks per diet). Significant
values (p < 0.05) in bold –2 0 2 4 6 8 10 12 14
Intake Retained Dissolved Solid
Intake Retained Dissolved Solid
Intake Retained Dissolved Solid
g nutrient per kg fish pr
oduced MJ ener gy per kg fish pr oduced LP diet HP diet b a b a b a
A) Phosphorus
B) Nitrogen
C) Energy
0 10 20 30 40 50 60 70 80 90 100 a b 0 5 10 15 20 25 30Fig. 1. Oncorhynchus mykiss. (A) Phosphorus, (B) nitrogen and (C) energy intake, retention and loading estimated at the end of the feeding trial from larger rainbow trout fed low-phosphorus (LP) and high-low-phosphorus (HP) diet. Mean values (n = 4 tanks per diet) in a column with different superscripts are significantly different (p < 0.05). For calculations of nutri-ent retnutri-ention, see Eq. (5) in ‘Materials and methods’; solid nu-trient load, see Eq. (6); and dissolved nunu-trient load, see Eq. (7)
(Day 21) and 6 (Day 42), respectively (Fig. 2). How-ever, there was no significant difference detected between the 2 diets at the Week 8 (Day 56) and Week 12 (Day 84) sampling events, although con-siderable variability in concentrations was observed. Geosmin concentrations of the tank water, biofilter
Parameter Day Treatment p LP HP Magnesium (Mg2+) 0 2.60 ± 0.03 2.48 ± 0.03 0.040 21 3.22 ± 0.02 2.95 ± 0.00 < 0.010 42 2.42 ± 0.09 2.42 ± 0.03 0.972 63 2.18 ± 0.03 2.09 ± 0.02 0.046 84 2.31 ± 0.04 2.14 ± 0.03 0.020 Sodium (Na+) 0 52.00 ± 0.84 45.46 ± 1.17 0.004 21 70.12 ± 4.90 52.58 ± 17.76 0.194 42 104.25 ± 3.60 92.39 ± 1.90 0.017 63 75.54 ± 5.86 80.84 ± 2.55 0.140 84 95.88 ± 5.31 77.29 ± 0.72 < 0.010 Calcium (Ca2+) 0 24.32 ± 0.28 22.27 ± 0.39 0.006 21 17.04 ± 0.08 16.67 ± 0.16 0.038 42 14.24 ± 0.24 14.81 ± 0.17 0.072 63 12.65 ± 0.21 13.60 ± 0.13 < 0.010 84 11.77 ± 0.27 13.61 ± 0.16 < 0.010 Potassium (K+) 0 1.97 ± 0.01 1.76 ± 0.01 0.024 21 2.05 ± 0.00 1.67 ± 0.02 < 0.010 42 2.32 ± 0.00 1.81 ± 0.10 < 0.010 63 2.24 ± 0.00 1.93 ± 0.18 < 0.010 84 3.09 ± 0.00 2.53 ± 0.06 < 0.010 Iron (Fe3+) 0 0.62 ± 0.78 0.02 ± 0.04 0.221 21 2.95 ± 0.77 2.95 ± 0.82 0.180 42 2.35 ± 0.74 2.35 ± 0.00 0.320 63 2.42 ± 0.34 2.42 ± 2.03 0.393 84 2.78 ± 0.70 2.78 ± 1.41 0.090 Copper (Cu2+) 0 1.03 ± 0.44 1.31 ± 1.04 0.639 21 1.46 ± 0.42 1.35 ± 0.19 0.473 42 1.49 ± 0.48 0.94 ± 0.42 0.434 63 1.05 ± 0.21 1.05 ± 0.42 0.594 84 1.35 ± 0.54 0.62 ± 0.33 0.117 Zinc (Zn2+) 0 5.38 ± 0.29 4.37 ± 1.26 0.402 21 6.83 ± 1.35 4.44 ± 0.50 0.051 42 6.35 ± 0.52 3.65 ± 0.58 0.001 63 6.38 ± 0.59 4.73 ± 0.74 0.017 84 10.77 ± 2.30 7.02 ± 0.44 0.048 Table 5. Concentration (ppm) of inorganic cations (magne-sium, sodium, calcium, potassium) and metals (iron, copper, zinc) in tank water at each sampling event for rainbow trout Oncorhynchus mykiss fed low-phosphorus (LP) and high-phosphorus (HP) diet. Values are mean ± SD (n = 4 tanks per
diet). Significant values (p < 0.05) in bold
Fig. 2. Oncorhynchus mykiss. Concentration of geosmin in rainbow trout flesh fed low-phosphorus (LP) and high-phosphorus (HP) diet for 84 d. Data are means (± SD) of 4 tanks (3 fish per tank) per diet. Different letters above bars
indicate significant difference at p < 0.05 0 1 2 3 4 5 6 7
Day 0 Day 21 Day 42 Day 63 Day 84
Fi s h f ill e t g e o s m in l e v e l ( µ g k g –1) b b a a LP diet HP diet 0 2 4 6 8 10 12 14 16
Day 0 Day 21 Day 42 Day 63 Day 84
G e o s m in ( n g l –1) 0 5 10 15 20 25 30 35
Day 0 Day 21 Day 42 Day 63 Day 84
0 5 10 15 20 25
Day 0 Day 21 Day 42 Day 63 Day 84
LP diet HP diet
B) Biofilter
A) Tank water
C) Sand filter
Fig. 3. Oncorhynchus mykiss. Changes in geosmin concen-tration in the (A) tank water, (B) biofilter and (C) sand filter of the tanks where fish received low-phosphorus (LP) and high-phosphorus (HP) diet for 84 d. Data are means (± SD)
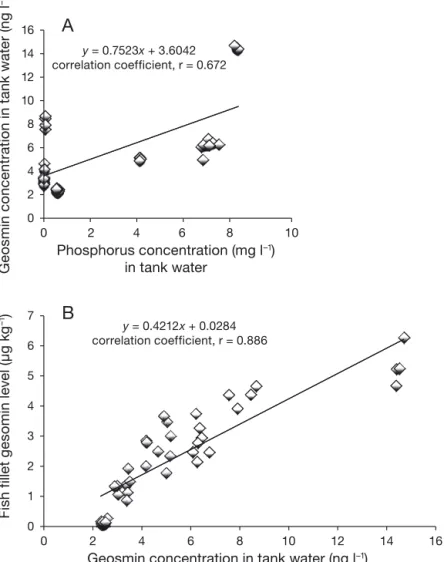
and sand filter were higher for the fish that received the HP diet versus the LP diet in all sampling events; however, the difference was not significant between the 2 diets (Fig. 3A−C). Although there was no strong linear relationship between soluble P concentration and geosmin in tank water when we integrated the data from both the LP and the HP diets (y = 0.7523x + 3.6042; r = 0.672; p < 0.0001) (Fig. 4A), the relationship was stronger in the HP diet (data not shown). Furthermore, there was a strong proportional linear relationship between the geosmin concentration in tank water and geosmin concentration in fish fillet of the fish fed the LP diet and HP diet (y = 0.4212x + 0.0284; r = 0.886; p < 0.0001) (Fig. 4B).
DISCUSSION
The reduction of P waste output from aqua-culture operations is considered a key element for the long-term sustainability of aquaculture. The most direct method of reducing P loading is achieved by manipulation of the P concen-tration in feed and improvement of diet di-gestibility. Current commercial trout feeds usually have a total P content that varies from 10 to 14.3 g kg−1diet (Sarker et al. 2011). As ex pected, the total P content of the HP diet (13 g kg−1diet) in this study re sembles the P content of commercial trout diets. The TGC and FCR values did not vary between the 2 di-ets; that the FCR values were identical throughout the study indicates that the protein and energy content of the diets were balanced (Cho & Kaushik 1990). In the present study, growth was not affected by the LP diet when compared to the HP diet. The growth perform-ance of fish in the current study confirmed that the LP (5.4 g kg−1diet) diet had sufficient total P to satisfy the minimum requirement for large rainbow trout. In large fish, the focus of the present study, the requirement for P is known to de crease with age because the growth rate decreases and dietary P is used mainly for maintaining meta bolic functions (Lellis et al. 2004, Koko et al. 2010). The P con-tent of the LP diet was in the range of the di-etary P requirement that has been reported for normal growth of rainbow trout, 4.0−6.0 g kg−1(Ketola & Richmond 1994, Rodehutscord 1996). Similar findings suggest that available P levels can be reduced in rainbow trout diets to 4.7 g kg−1diet at 314 g live mass without loss in production (Rodehutscord 1996).
Fish fed the LP diet were characterized by very low dissolved and solid waste P output, suggesting that this diet approached maximum retention and the P re-quirement was met. Non-fecal P (urinary or gill) con-centration has been shown to be a rapid and sensitive indicator of dietary P intake (Bureau & Cho 1999, Sug-iura et al. 2000). Research has shown that non-fecal P (urinary or gill excretion) is significantly lower in fish fed an LP diet compared to an HP diet (Sugiura et al. 2000). In the present study, the amount of retained P by fish in the LP and HP dietary groups were not signi ficantly different (Fig. 1A), which reflects that the phy -siological P needs of both dietary groups were met.
It is well known that vertebral deformities may ap -pear long before any growth reduction is exhibited.
y = 0.7523x + 3.6042 correlation coefficient, r = 0.672 0 2 4 6 8 10 12 14 16 0
A
B
2 4 6 8 10 G e o s m in c o n c e n tr a ti o n in t a nk w a te r ( n g l –1 Phosphorus concentration (mg l–1) in tank water y = 0.4212x + 0.0284 correlation coefficient, r = 0.886 0 1 2 3 4 5 6 7 0 2 4 6 8 10 12 14 16 Fi s h f ill e t g e s o min l e v e l ( µ g k g –1)Geosmin concentration in tank water (ng l–1)
Fig. 4. Oncorhynchus mykiss. Linear correlations between (A) the phosphorus and geosmin concentrations in tank water and (B) the geosmin concentration in tank water and that in fish fillets from the feeding trial where fish received low-phosphorus (LP) and high-phosphorus (HP) diet. Data are means (± SD) of 4 tanks per diet.
In juvenile Atlantic salmon Salmo salar and rainbow trout, it has been observed that continual feeding on a P-deficient diet eventually leads to poor bone mineralization and deformities (Vielma & Lall 1998, Fontagnè et al. 2009, Fjelldal et al. 2012). This phe-nomenon has also been observed in large fish. For instance, Koko et al. (2010) found that changes in weight of 164 g trout fed deficient P (4.0 g kg−1diet) and sufficient P (8.0 g kg−1diet) over time remained similar during the initial 56 d. After this period, poor growth performance and a number of visual defi-ciency signs were observed, such as bone deformities in the tail regions of trout fed the P-deficient diet. However, there were no visual signs of P deficiency in the current study. This indicates that fish fed the LP diet re ceived an adequate level of P for bone min-eralization for the 84 d feeding period. However, more work is required on the effect of an LP diet on rainbow trout health and bone mineralization in a longer-term feeding trial, which our research team is currently investigating.
Even though the diets were both isocaloric and iso -nitrogenous, there was a significant depression in the apparent digestibility of dry matter, P, ash, protein and lipid of fish fed the HP diet (containing 6.9 g digestible P kg−1diet). There was also a substantial increase in the P waste output fractions, which could suggest that these fish were somehow negatively affected by the high P intake. Based on the results of P budgets, fish in all dietary treatment groups dis-played similar fractions of retained P; however, fish in the HP dietary treatment groups excreted a com-paratively significant higher amount (6 g P kg−1fish produced) of solid P. Non-fecal dissolved P excre-tion occurs only when the diet contains available/ digestible P that exceeds the requirement level (Bureau & Cho 1999, Rodehutscord et al. 2000, Sug-iura et al. 2000, Sarker et al. 2009). In the present study, the dissolved P waste output was very minimal (0.2 g P kg−1fish produced) from fish fed the LP diet (3.2 g digestible P kg−1), increasing (3 g P kg−1fish produced) significantly in the fish fed the HP diet (6.9 g digestible P kg−1 diet), suggesting that the dietary P requirement had been exceeded in this group. The fact that the fish fed the LP diet displayed significantly lower or borderline (negative value) dissolved P waste output presumably reflects that the fish were P-limited at the start of the trial (0 mg P l−1 in tank water for Days 21 and 42), therefore retaining a larger share of dietary P (Sugiura et al. 2000).
The current study seeks to clarify the impact of dietary P concentration and the magnitude of the waste P production on the appearance of off-flavor
compound deposition in fish flesh and water. The P budgets balanced very well, verifying that the fate of dietary P had been satisfyingly accounted for. Fish fed the HP diet displayed higher geosmin concentra-tions in fillets throughout the experimental period, and the difference with the LP group was significant until Day 42. In the LP group, the fish fillet geosmin level was very low at Day 0 compared to Day 84, whereas the phosphate level in water was quite high at Day 0 (0.58 ppm) compared to Day 84 (0.04 ppm). This could be attributed to the fact that the fish were P-limited at the start of the trial, and fish receiving the LP diet displayed a net disappearance of soluble P concentration (0 mg l−1) from the tank water (Table 4). They may have re tained maximum P until Day 42 for their physiological requirement or could even have taken up soluble P from water via gills (Sugiura et al. 2003, Sarker et al. 2011). This dis -appearance of soluble P in the water indicated that P might not be stimulating the growth or proliferation of microorganisms, and coincided with the lower con -centration of the geosmin level for the first 42 d in fish fed the LP diet (Findlay et al. 2009, Auffret et al. 2011). However, it should be noted that the concen-tration of geosmin levels in fish was high, > 2.4 µg kg−1fish for both diets. The human sensory threshold for geosmin in rainbow trout ranges from 0.1 to 0.9 µg kg−1fish (Robertson et al. 2005, Peterson et al. 2011). This suggests that even though fish fed the LP diet contributed less geosmin concentration in fillet, fur-ther reduction is needed to achieve a level below the sensory threshold. To provide adequate conditions for depuration of off-flavors, either the fish could be moved to clean odor-free water or the geosmin could be removed from the culture water in situ (Robert-son et al. 2005, Burr et al. 2012); e.g. rainbow trout depuration periods of ~1 wk are typically practiced (Petersen et al. 2011, 2014).
This study demonstrated that the concentration of geosmin in the rainbow trout flesh is highly correlated with the accumulated geosmin concentration in the tank water. The accumulation of tainting compounds in flesh is extremely rapid (Robertson et al. 2005) and can be intensified by the lipid content of fish (Johnsen & Lloyd 1992, Jones et al. 2013). The higher geosmin levels in the fish on Days 63 and 84 relative to Day 42 might be linked with the body lipid content of fish. Al-though we did not determine the relationship between lipid content of fish flesh and uptake of geosmin con-centration in this study, our previous study confirmed the fact that the concen tration of lipid in trout has an influence on the uptake of geosmin in water (authors’ unpubl.). This suggests that due to the relationship
between geosmin uptake and lipid content, the lean fish could contribute potentially the lower concentra-tion of taint compounds in farmed fish (Johnsen & Lloyd 1992, Robertson et al. 2005).
The aquafeeds industry has long recognized and driven research to find aquafeeds that use alternative protein ingredients, particularly plant-derived pro-teins (Gatlin et al. 2007). Plant-derived propro-teins con-tain high levels of phytate-bound P (Mainstone & Parr 2002, Sarker et al. 2006, 2013), which is largely (70%) indigestible to monogastric animals like fish, who lack endogenous phytase activity to liberate phytate P (NRC 1993). Thus, P ends up in fish culture effluents, which contribute to eutrophication (Main-stone & Parr 2002, Sarker et al. 2009). P balance cal-culations indicated that both solid and dissolved P production was higher in the HP diet than LP diets, therefore confirming that a difference in digestibility between diets was due to the difference in supple-mented P concentration in the diet, not the level of phytate P, which was the same in both diets. Use of phytase enzymes to increase utilization of phytate P in the feed may be beneficial in reducing the growth of microorganisms and thus reducing the occurrence of off-flavor. However, this experiment was not designed to study the dietary P source (such as phy-tate) in relationship to off-flavor. Moreover, the influ-ence of microbial activity on the phosphate concen-tration in water was not directly evaluated in this study. Thus, more research is certainly needed to explore the effects/consequences of phytate P with respect to P waste outputs and geosmin-associated off-flavor compounds in fish raised in RAS.
Regardless of this mechanism, it is important to note that low concentrations of P in RAS may contribute to lowering geosmin-associated off-flavor in the culture system and in fillet from fish raised in RAS. The large increase of geosmin concentration reflects the P waste output in the system water that facilitated the pro -liferation of microorganisms (Auffret et al. 2011). The effectiveness of P utilization by microorganisms is stimulated by the fraction of the P loading from fish culture operation that is biologically available (Findlay et al. 2009). This is due to the fact that most of the dissolved P waste excreted by the fish is in the form of orthophosphate (Bureau & Cho 1999), a component that is readily available to the microorganisms. Like-wise, Redfield (1958) and Armstrong (1999) reported that available P in water is one of the key factors implicated in cyanobacterial proliferation and con-tributes to producing geosmin-associated off-flavor compounds in the aquaculture system (Ridal et al. 1999, Sugiura & Nakano 2000, Dzialowski et al. 2009).
It has been reported that the P released from sediment induces off-flavor problems in catfish and carp ponds when the P content in the water was in the range of 0.33−0.71 mg l−1(Zimba et al. 2003, Vallod et al. 2007). An amount of 1 mg l−1was previously correlated with the occurrence of geosmin production in aquaculture systems (Robertson et al. 2006). This amount has also been shown to control the biosynthesis of secondary metabolites such as geosmin in Streptomyces sp. (Schrader & Blevins 2001, Martín 2004). A number of microorganisms can produce volatile organic com-pounds that affect the taste and smell of fish and water; e.g. several taxa of cyanobacteria (blue-green algae), filamentous Actinobacteria (actinomycetes) and Myxo bacteria frequently produce 2 key off-flavor com pounds, geosmin and 2-MIB, in aquaculture and other aquatic environments (Tucker & Martin 1991, Jüttner & Watson 2007, Auffret et al. 2011). However, in indoor RAS tank conditions, cyanobacteria might not grow as favorably as in open water ponds due to the presence of sunlight outdoors. In indoor trout tanks, the growth of non-photosynthetic microbes could be a major source of geosmin. In this study, changes in geosmin concentration in tank water, biofilter and sand filter increased over time until the end of the experiment; at every sampling event, fish receiving the HP diet showed numerically (not sta -tistically) higher concentrations of geosmin. In this study, Pearson correlation analysis was performed and showed that the soluble P concentration in tank water was not strongly correlated (correlation coeffi-cient, r = 0.672; p < 0.0001) with the geosmin concen-tration when we integrated all the data from the 2 dietary treatments; however, the relationship is even stronger (correlation coefficient, r = 0.769; p < 0.0001) when considering only fish receiving the HP diet (data not shown).
It is important to note that RAS biofilms can be a major source of the off-flavor compounds. It has been reported that in RAS, the biofilter and the sand filter are the 2 compartments that are known to concen-trate geosmin producers and to accumulate phos-phate (Shnel et al. 2002, Guttman & van Rijn 2008). In our previous study, we reported that the detected
Streptomyces, Myxococcales, Sorangium and Nan-nocystis coincided with the detection of geosmin in
trout raised in RAS (Auffret et al. 2011, 2013), and there was a positive correlation between Nannocystis in the fish tank and the detection of geosmin in fish tissue. Auffret et al. (2013) also speculated that P could be associated with the abundance of Soran
-gium and the geosmin-synthesis gene that could
In all sampling events of the present study, 2-MIB was recorded below detectable levels, suggesting that it had a negligible influence on earthy taint episodes in rainbow trout flesh and the water in which they were raised. To our knowledge, there are no published studies addressing the influence of dietary P on the development of off-flavor (geosmin) in trout fillet and system water. The results from this study suggest that care should be taken in the formu-lation of diets with high P levels that exceed the requirement levels for large fish, without considering metabolic waste outputs into the environment and the obvious risk of producing off-flavor compounds in water and fish flesh.
Several micronutrients, e.g. inorganic cations (Na+, Ca2+, Fe3+, Cu2+) in the tank water of fish fed both diets tested in this study were not significantly differ-ent. These micronutrients have not been identified as having considerable influence on the yield of several bacterial metabolites like geosmin. It has been pre -viously reported that Ca2+, K+ and Cu2+ usually do not affect the secondary metabolism of bacteria and geosmin production (Schrader & Blevins 2001). How-ever, significantly lower concentration of zinc in the tank water of fish fed the HP diet could stimulate the secondary metabolism of bacteria and permit greater geosmin production, as has been reported previously (Weinberg 1989). In the case of inorganic anions, with the exception of PO43– concentration (significantly higher), some other anions such as (NO2−, Cl−, SO42−) were not found significantly different in the tank water of fish fed both the HP and LP diets on some sampling events. The impact of differing levels of these micronutrients in water is not well understood. Therefore, in the current study, it is unclear how metabolic P waste in water could interact with other environmental parameters and regulate the synthe-sis of geosmin in water and fish tissue, so further research is needed to elucidate this.
CONCLUSION AND IMPLICATIONS The results of this study suggest that off-flavor compounds in water and fish fillets raised in RAS were related to the P concentration in the diet and consequent metabolic P waste output into the sys-tem. This study provides evidence that nutritional strategies and utilization of low-P feed in larger rain-bow trout lead to significant reduction of P waste out-puts and an off-flavor compound (geosmin) in RAS systems and consequentially in fillets without com-promising fish growth and productivity.
Acknowledgements. We express our appreciation to the Natural Sciences and Engineering Research Council (NSERC) of Canada, the Réseau Aquaculture Québec (RAQ) (Rimouski, QC) and the Société de recherche et de développement en aquaculture continentale Inc. for finan-cial support. We thank the staff of the Laboratoire Régional des Sciences Aquatiques (LARSA, Université Laval, QC, Canada) for their facilities and for technical assistance.
LITERATURE CITED
AOAC (Association of Official Analytical Chemists) (1990) Method numbers 927.05 and 930.30. In: Official methods of analysis, 15th edn. AOAC, Washington, DC
Armstrong RA (1999) An optimization-based model of iron-lightammonium co-limitation of nitrate uptake and phytoplankton growth. Limnol Oceanogr 44: 1436−1446 Auffret M, Pilote A, Proulx E, Proulx D, Vandenberg G, Villemur R (2011) Establishment of a real-time PCR method for quantification of geosmin-producing Strepto-myces spp. in recirculating aquaculture systems. Water Res 45: 6753−6762
Auffret M, Yergeau É, Pilote A, Proulx É and others (2013) Impact of water quality on the bacterial populations and off-flavours in recirculating aquaculture systems. FEMS Microbiol Ecol 84: 235−247
Bai Z, Pilote A, Sarker PK, Vandenberg G, Pawliszyn J (2013) In-vivo solid phase microextraction with ex-vivo calibration: determination of off flavor components in live fish. Anal Chem 85: 2328−2332
Bureau DP, Cho CY (1999) Phosphorus utilization by rain-bow trout (Oncorhynchus mykiss): estimation of dissolved phosphorus waste output. Aquaculture 179: 127−140 Burr GS, Wolters WR, Schrader KK, Summerfelt ST (2012)
Impact of depuration of earthy-musty off-flavors on fillet quality of Atlantic salmon, Salmo salar, cultured in a re circulating aquaculture system. Aquacult Eng 50: 28−36
Camargo JA, Alonso Á (2006) Ecological and toxicological effects of inorganic nitrogen pollution in aquatic ecosys-tems: a global assessment. Environ Int 32: 831−849 CCAC (Canadian Council on Animal Care) (1984) Guide to
the care and use of experimental animals, Vol 2. CCAC, Ottawa
Cho CY, Kaushik SJ (1990) Nutritional energy in fish: energy and protein utilization in rainbow trout (Salmo gairdneri). World Rev Nutr Diet 61: 132−172
Cho CY, Slinger SJ (1979) Apparent digestibility measure-ment in feedstuffs for rainbow trout (Salmo gairdneri). Proc World Symp Finfish Nutrition and Fish feed Tech-nology, 20–23 June 1978, Hamburg, Vol 2. Heenemann, Berlin, p 239−247
Cho CY, Slinger SJ, Bayley HS (1982) Bioenergetics of salmonid fishes: energy intake, expenditure and produc-tivity. Comp Biochem Physiol B 73: 25−41
Cook D, Newcombe G, Sztajnbok P (2001) The application of powdered activated carbon for MIB and geosmin removal: predicting PAC doses in four raw waters. Water Res 35:1325–1333
CPAUL (Animal Protection Committee of Université Laval) (2010) Politique concernant l’utilisation des animaux en recherche, en enseignement et dans les tests, CA-2010-86. Université Laval, Québec
Downing JA, Watson SB, McCauley E (2001) Predicting
➤
➤
➤
➤
➤
➤
➤
➤
➤
➤
cyanobacteria dominance in lakes. Can J Fish Aquat Sci 58: 1905−1908
Dzialowski AR, Smith VH, Huggins DG, deNoyelles F, Lim N, Baker DS, Beury JH (2009) Development of predictive models for geosmin-related taste and odor in Kansas, USA, drinking water reservoirs. Water Res 43: 2829−2840 Findlay DL, Podemski CL, Kasian SEM (2009) Aquaculture impacts on the microbial communities in a small boreal forest lake. Can J Fish Aquat Sci 66: 1936−1948
Fjelldal PG, Hansen T, Albrektsen S (2012) Inadequate phosphorus nutrition in juvenile Atlantic salmon has a negative effect on long-term bone health. Aquaculture 334−337: 117−123
Fontagnè S, Silva N, Bazin D, Ramos A and others (2009) Effects of dietary phosphorus and calcium level on growth and skeletal development in rainbow trout (Oncorhynchus mykiss) fry. Aquaculture 297: 141−150 Gatlin DM III, Barrows FT, Brown P, Dabrowski K and others
(2007) Expanding the utilization of sustainable plant products in aquafeeds: a review. Aquacult Res 38: 551−579
Gerber NN (1969) A volatile metabolite of actinomycetes, 2-methylisoborneol. J Antibiot 22: 508−509
Grimm CC, Lloyd SW, Batista R, Zimba PV (2000) Using microwave distillation-solid-phase microextraction−gas chromatography−mass spectrometry for analyzing fish tissue. J Chromatogr Sci 38: 289−296
Guttman L, van Rijn J (2008) Identification of conditions underlying production of geosmin and 2-methylisobor-neol in a recirculating system. Aquaculture 279: 85−91 Houle S, Schrader KK, François NRL, Comeau Y and others
(2011) Geosmin causes off-flavour in arctic charr in recir-culating aquaculture systems. Aquacult Res 42: 360−365 Johnsen PB, Lloyd SW (1992) Influence of fat content on uptake and depuration of the off-flavor 2-methylisobor-neol by channel catfish (Ictalurus punctatus). Can J Fish Aquat Sci 49: 2406−2411
Jones B, Fuller S, Carton AG (2013) Earthy-muddy tainting of cultured barramundi linked to geosmin in tropical northern Australia. Aquacult Environ Interact 3: 117−124 Jüttner F, Watson SB (2007) Biochemical and ecological con-trol of geosmin and 2-methylisoborneol in source waters. Appl Environ Microbiol 73: 4395−4406
Ketola HG, Richmond ME (1994) Requirement of rainbow trout for dietary phosphorus and its relationship to the amount discharged in hatchery effluents. Trans Am Fish Soc 123: 587−594
Keulen JV, Young BA (1977) Evaluation of acid-insoluble ash as a natural marker in ruminant digestibility studies. J Anim Sci 44: 282−287
Koko GKD, Sarker PK, Proulx E, Vandenberg GW (2010) Effects of alternating feeding regimes with varying dietary phosphorus levels on growth, mineralization, phosphorus retention and loading of large rainbow trout (Oncorhynchus mykiss). Aquat Living Resour 23: 277−284
Lall SP (1991) Digestibility, metabolism and excretion of dietary phosphorus in fish. In: Chowey CB, Cho CY (eds) Nutritional strategies and aquaculture waste. Proc 1st Int Symp Nutritional Strategies in Management of Aquacul-ture Waste. University of Guelph, Guelph, p 21−36 Lellis WA, Barrows FT, Hardy RW (2004) Effects of
phase-feeding dietary phosphorus on survival, growth, and pro-cessing characteristics of rainbow trout Oncorhynchus mykiss. Aquaculture 242: 607−616
Lloyd SW, Grimm CC (1999) Analysis of 2-methylisoborneol and geosmin in catfish by microwave distillation-solid-phase microextraction. J Agric Food Chem 47: 164−169 Mainstone CP, Parr W (2002) Phosphorus in rivers − ecology
and management. Sci Total Environ 282-283: 25−47 Martín JF (2004) Phosphate control of the biosynthesis of
antibiotics and other secondary metabolites is mediated by the PhoR-PhoP system: an unfinished story. J Bacte-riol 186: 5197−5201
NRC (National Research Council) (1993) Nutrient require-ments of fish. National Academy Press, Washington, DC Petersen MA, Hyldig G, Strobel BW, Henriksen NH, Jør-gensen NOG (2011) Chemical and sensory quantification of geosmin and 2-methylisoborneol in rainbow trout (Oncorhynchus mykiss) from recirculated aquacultures in relation to concentrations in basin water. J Agric Food Chem 59: 12561−12568
Petersen MA, Alam MD, Rahman MM, Ali ML, Mahmud S, Schlüter L, Jørgensen NOG (2014) Geosmin off-flavour in pond-raised fish in southern Bangladesh and occur-rence of potential off-flavour producing organisms. Aquacult Environ Interact 5: 107−116
Redfield AC (1958) The biological control of the chemical factors in the environment. Am Sci 46: 205−221
Ridal JJ, Brownlee B, Lean DRS (1999) Occurrence of the odor compounds, 2-methylisoborneol and geosmin in eastern Lake Ontario and the upper St. Lawrence River. J Gt Lakes Res 25: 198−204
Robertson RF, Jauncey K, Beveridge MCM, Lawton LA (2005) Depuration rates and the sensory threshold con-centration of geosmin responsible for earthy-musty taint in rainbow trout, Onchorhynchus mykiss. Aquaculture 245: 89−99
Robertson RF, Hammond A, Jauncey K, Beveridge MCM, Lawton LA (2006) An investigation into the occurrence of geosmin responsible for earthy-musty taints in UK farmed rainbow trout, Onchorhynchus mykiss. Aquacul-ture 259: 153−163
Robin J, Cravedi JP, Hillenweck A, Deshayes C, Vallod D (2006) Off flavor characterization and origin in French trout farming. Aquaculture 260: 128−138
Rodehutscord M (1996) Response of rainbow trout (Onco-rhynchus mykiss) growing from 50 to 200 g to supple-ments of dibasic sodium phosphate in a semipurified diet. J Nutr 126: 324−331
Rodehutscord M, Gregus Z, Pfeffer E (2000) Effect of phos-phorus intake on faecal and non-faecal phosphos-phorus excretion in rainbow trout (Oncorhynchus mykiss) and the consequences for comparative phosphorus availabil-ity studies. Aquaculture 188: 383−398
Saadoun IMK, Schrader KK, Blevins WT (2001) Environ-mental and nutritional factors affecting geosmin synthe-sis by Anabaena sp. Water Res 35: 1209−1218
Sarker PK, Fukada H, Hosokawa H, Masumoto T (2006) Effects of phytase with inorganic phosphorus supple-ment diet on nutrient availability of Japanese flounder (Paralichthys olivaceus). Aquacult Sci 54: 391−398 Sarker PK, Shuichi S, Fukada H, Masumoto T (2009) Effects
of dietary phosphorus level on non-faecal phosphorus excretion from yellowtail (Seriola quinqueradiata Tem-minck & Schlegel) fed purified and practical diets. Aquacult Res 40: 225−232
Sarker PK, Fournier J, Boucher E, Proulx E, Noüe J, Vanden-berg GW (2011) Effects of low phosphorus ingredient combinations on weight gain, apparent digestibility
coef-➤
➤
➤
➤
➤
➤
➤
➤
➤
➤
➤
➤
➤
➤
➤➤
➤
➤
➤
➤
➤
➤
➤
➤
➤
➤
➤
➤
➤
➤
ficients, non-fecal phosphorus excretion, phosphorus retention and loading of large rainbow trout (Oncorhyn-chus mykiss). Anim Feed Sci Technol 168: 241−249 Sarker PK, Bureau DP, Hua K, Drew MD and others (2013)
Sustainability issues related to feeding salmonids: a Canadian perspective. Rev Aquacult 5: 199−219
Schindler DW (1977) Evolution of phosphorus limitation in lakes. Science 195: 260−262
Schrader KK, Blevins WT (2001) Effects of carbon source, phosphorus concentration, and several micronutrients on biomass and geosmin production by Streptomyces hal-stedii. J Ind Microbiol Biotechnol 26: 241−247
Schrader KK, Rimando AM (2003) Off-flavors in aqua -culture: an overview. In: Rimando AM, Schrader KK (eds) Off-flavors in Aquaculture. The American Chemical Society Symposium, Series 848. Oxford University Press, Washington, DC, p 1–12
Schrader KK, Summerfelt ST (2010) Distribution of off-flavor compounds and isolation of geosmin-producing bacteria in a series of water recirculating systems for rainbow trout culture. N Am J Aquacult 72: 1−9
Shnel N, Barak Y, Ezer T, Dafni Z, van Rijn J (2002) Design and performance of a zero-discharge tilapia recirculat-ing system. Aquacult Eng 26: 191−203
Smith VH, Bennett SJ (1999) Nitrogen: phosphorus supply ratios and phytoplankton community in lakes. Arch Hydrobiol 146: 37−53
Sugiura N, Nakano K (2000) Causative microorganisms for musty odor occurrence in the eutrophic Lake Kasumi-gaura. Hydrobiologia 434: 145−150
Sugiura SH, Dong FM, Hardy RW (2000) A new approach to estimating the minimum dietary requirement of phos-phorus for large rainbow trout based on non-fecal excre-tions of phosphorus and nitrogen. J Nutr 130: 865−872 Sugiura SH, McDaniel NK, Ferraris RP (2003) In vivo
frac-tional Pi absorption and NaPi-II mRNA expression in rainbow trout are unregulated by dietary P restriction. Am J Physiol Regul Integr Comp Physiol 285: R770−R781 Tucker CS (2000) Off-flavor problems in aquaculture. Rev
Fish Sci 8: 45−88
Tucker CS, Martin JF (1991) Environment-related flavors in fish. In: Brune DE, Tomasso JR (eds) Aquacul-ture and water quality. Advances in World AquaculAquacul-ture, Vol. 3. The World Aquaculture Society, Baton Rouge, LA, p 133−179
Vallod D, Cravedi JP, Hillenweck A, Robin J (2007) Analysis of the off-flavor risk in carp production in ponds in Dombes and Forez (France). Aquacult Int 15: 287−298 Vielma J, Lall SP (1998) Phosphorus utilization by Atlantic
salmon (Salmo salar) reared in freshwater is not influ-enced by higher dietary calcium intake. Aquaculture 160: 117−128
Weinberg ED (1989) Roles of micronutrients in secondary metabolism of actinomycetes. In: Shapiro S (ed) Regula-tion of secondary metabolism in Actinomycetes. CRC Press, Boca Raton, FL, p 239−261
Zimba PV, Mischke CC, Dionigi CP, Brashear SS (2003) Pond age-water column trophic relationships in channel catfish Ictalurus punctatus production ponds. Aquacul-ture 219: 291−301
Conditions
Anions
Volume injected 50 µl
Analytical column IonPac AS17 (4 × 250 mm) Guard column AG17 (4 × 50 mm)
Eluent gradient Potassium hydroxide (9 to 30 mM), 16 min Standard flow rate 1 ml min–1
Temperature 30°C
Suppressor Anion self-regenerating suppressor (ASRS ULTRA II, –4 mm) Cations
Volume injected 50 µl
Analytical column IonPac CS16 (5 × 250 mm) Guard column CG16 (5 × 50 mm)
Eluent Methanesulfonic acid (MSA) (42 mM), 16 min Standard flow rate 1 ml min–1
Temperature 30°C
Suppressor Cation self-regenerating suppressor (CSRS ULTRA II, –4 mm) Metals
Volume injected 50 µl
Analytical column IonPac CS5A (4 × 250 mm) Guard column CG5A (4 × 50 mm) Eluent MetPac PDCA eluent (5×) Standard flow rate 1.2 ml min–1
Post-column reagent PAR (0.5 mM) Reagent flow rate 0.7 ml min–1
Detector wavelength 520 nm
Appendix.Ion chromatography methods. Inorganic anions included chloride, nitrate, nitrite, phosphate and sulfate; inorganic cations included calcium, magnesium, potassium and sodium;
metals included iron (III) and the divalent cations of copper and zinc
Editorial responsibility: Megan La Peyre, Baton Rouge, Louisiana, USA
Submitted: March 13, 2014; Accepted: October 27, 2014 Proofs received from author(s): December 1, 2014