(Water, Air & Soil Pollution)
12
Influence of soil parameters on the efficiency of the attrition process to remove metals, 3
PCP, dioxins and furans from contaminated soils 4
5
Karima Guemiza1, Lucie Coudert2, Lan Huong Tran3, Sabrine Metahni4, 6
Jean-François Blais5,*, Simon Besner6 and Guy Mercier7 7
8
1 Ph.D. Student, Institut national de la recherche scientifique (Centre Eau, Terre et Environnement), Université du 9
Québec, 490 rue de la Couronne, Québec, QC, Canada, G1K 9A9, Phone : (418) 654-5648, Fax : (418) 654-2600, 10
email: [email protected] 11
2 Research Associate, Institut national de la recherche scientifique (Centre Eau, Terre et Environnement), Université 12
du Québec, 490 rue de la Couronne, Québec, QC, Canada, G1K 9A9, Phone : (418) 3793, Fax : (418) 654-13
2600, email: [email protected], ORCID : 0000-0001-9570-1472 14
3
Research Associate, Institut national de la recherche scientifique (Centre Eau, Terre et Environnement), Université 15
du Québec, 490 rue de la Couronne, Québec, QC, Canada, G1K 9A9, Phone : (418) 2550, Fax : (418) 654-16
2600, email: [email protected] 17
4
Ph.D. Student, Institut national de la recherche scientifique (Centre Eau, Terre et Environnement), Université du 18
Québec, 490 rue de la Couronne, Québec, QC, Canada, G1K 9A9, Phone : (418) 654-4677, Fax : (418) 654-2600, 19
email : [email protected] 20
5 Professor, Institut national de la recherche scientifique (Centre Eau, Terre et Environnement), Université du 21
Québec, 490 rue de la Couronne, Québec, QC, Canada, G1K 9A9, Phone : (418) 654-2575, Fax : (418) 654-2600, 22
email: [email protected], ORCID : 0000-0003-3087-4318 23
6 Research Scientist, Institut de recherche d’Hydro–Québec (IREQ), IREQ, 1800, boul. Lionel–Boulet, Varennes, 24
Qc, Canada, J3X 1S1, Phone: 1 (450)–652–8318, Fax: 1 (450)–652–8424, email: [email protected] 25
7
Professor, Institut national de la recherche scientifique (Centre Eau, Terre et Environnement), Université du 26
Québec, 490 rue de la Couronne, Québec, QC, Canada, G1K 9A9, Phone : (418) 654-2633, Fax : (418) 654-2600, 27 email: [email protected] 28 29 30 31 *Corresponding author : 32 33 34 35 October 2017 36
Abstract
1The objective of this study was to evaluate the influence of the soil parameters (particle size, initial contamination 2
level, etc.) on the performances of an attrition process to remove As, Cr, Cu, pentachlorophenol (PCP) and dioxins 3
and furans (PCDD/F). Five different contaminated soils were wet-sieved to isolate five soil fractions (< 0.250, 4
0.250-1, 1-4, 4-12 and > 12 mm). Five attrition steps of 20 min each, carried out in the presence of a biodegradable 5
surfactant ([BW] = 2%, w.w-1) at room temperature with a pulp density fixed at 40% (w.w-1), were applied to the 6
coarse soil fractions (> 0.250 mm) of different soils. The results showed good performances of the attrition process 7
to simultaneously remove PCP and PCDD/F from contaminated soil fractions initially containing between 1.1 and 8
13 mg of PCP.kg-1 (dry basis)and between 1,795 and 5,720 ng TEQ of PCDD/F.kg-1. It appeared that the amounts of 9
contaminants removed were significantly correlated (p-value < 0.05, R2 = 0.96) with the initial amounts of PCP and 10
PCDD/F, regardless of the particle size of the soils studied. The nature of the soil (granulometric distribution, pH, 11
total organic carbon (TOC) (organic matter) and diverse industrial origin) slightly and negatively influenced the 12
efficiency of organic contaminants removals using attrition. However, the attrition treatment allowed an efficient 13
removal of both PCP and PCDD/F from the coarse fraction of contaminated soil; despite the nature of the soil. 14
15
Keywords: Soil remediation; Pentachlorophenol; Dioxins and furans; Attrition process; Initial contaminant content; 16
Particle size 17
1
Introduction
1The contamination of soils by inorganic (As, Cd, Cr, Cu, Ni, Pb, Se, Zn, etc.) and organic compounds (polycyclic 2
aromatic hydrocarbons (PAHs), pentachlorophenol (PCP), dioxins and furans (PCDD/F), etc.) is strongly linked to 3
the industrial activities (Coronas et al. 2016; Han et al. 2002). In the United States, among the 1,585 sites 4
enumerated on the priority list, approximately 313 sites have a serious problem of contamination by PCP (ATSDR 5
2001). Thepentachlorophenol is listed among the 126 priority pollutants by the Environmental Protection Agency of 6
the United States (US EPA) and the European Union (UE 2000; US Congress 1995; US EPA 2003). The PCDD/F, 7
which are impurities and by-products related to the degradation of PCP, represent a family of 210 compounds 8
including 75 congeners of polychlorinated dibenzo-p-dioxin (PCDD) and 135 congeners of polychlorinated 9
dibenzofurans (PCDF). Among these 210 compounds, 17 congeners, substituted in position 2, 3, 7, and 8, are known 10
as toxic, non-polar and highly hydrophobic compounds. These compounds are resistant to most of biological, 11
chemical and physical activities. Indeed, due to their stability and their high hydrophobicity, PCDD/F and PCP 12
easily accumulate and persist in the living organisms and in the environment (Augustijin-Becker et al. 1994; 13
Government of Canada 1990; INSERM 2000; Tissier et al. 2005). Both PCP and PCDD/F are known to be toxic for 14
humans and fauna and to be potentially carcinogenic compounds (UK Environment Agency 2009; US EPA 2003; 15
World Health Organization 2003). Their adsorption on soil depends on their hydrophobic interactions with organic 16
matter (Banerji et al. 1993; INSERM 2000).Trivalent chromium is known to be an essential element in protein, lipid 17
and glucidic metabolism of mammals (Pantsar-Kallio et al. 2001). Deficiencies of Cr (III) induce among other 18
effects an increase in circulating insulin concentrations, a decrease of sperm count and fertility, and shortening life 19
expectancy (Pichard et al. 2005). Global and national organizations have identified some As compounds as 20
hazardous substances to human health (ATSDR 2007). For many years, Cu is known to be essential for many 21
metabolic processes due to its presence in proteins and enzymes. However, in excessive amounts, Cu can cause 22
damages to the liver and kidneys (USEPA 2006). 23
There are numerous technologies developed for the treatment of soils contaminated by a combination of metals and 24
organic compounds. Among these methods, physical separation methods are usually chosen because of their low 25
cost and simplicity (Mercier et al. 2001). Attrition was found to be an efficient technique (INRS-Georessources & 26
CRM 1997). This technique can be used as a physical decontamination process alone (Bayley et al. 2005; Bisone et 27
al. 2013; Guemiza et al. 2016; Metahni et al. 2016; Stražišar and Sešelj 1999) as well as a step prior to other 1
decontamination processes such as gravity concentration and froth flotation (Bisone et al. 2012; Jobin et al. 2015, 2
2016; Veetil et al. 2014; Williford et al. 1999). Attrition scrubbing allows friction between contaminated particles; 3
enhancing the removal of the thick films around soil particles and/or the detachment of fine particles usually 4
contaminated from the surface of the coarse particles (uncontaminated). Therefore, this process allows the release of 5
contaminants from the coarse particles and favors the concentration of the contaminants in a smaller fraction of fine 6
particles (Bayley et al. 2005; Dermont et al. 2008; Marino et al. 1997; Petavy et al. 2009).According to several 7
studies, some parameters such as the pulp density, the temperature, the particle size, the nature and level of 8
contamination influence the efficiency of attrition scrubbing. 9
1.1 Pulp density 10
Bayley et al. (2005) showed that the efficiency of an attrition scrubber on the removal of both organic (Bees Wax 11
and mineral oil Catenex S341) and inorganic compounds is directly proportional to the increase of the pulp density 12
from 20% to 50%. This relationship may be due to the higher probability of collision between soil particles when the 13
solid/liquid ratio is higher. Indeed, the collision of particles enhances the removal of contaminants from the particle 14
surfaces. A study carried out by Petavy et al. (2009) showed that 70% dryness rate was the best rate for the best 15
treatment of metal contaminated sediments by an attrition process at laboratory scale. However, Feng et al. (2001) 16
showed that the efficiency of an attrition process to remove diesel oil from soil contaminated increased when the 17
solid concentration was increased from 70 to 80% and decreased when increasing the solid concentration of the 18
slurry to 85%. This decrease of performances may be due to the fact that the slurry becomes too dense, which 19
decreases the inter-particle motion and the scrubbing action. Recently, Guemiza et al. (2016) used an experimental 20
design methodology to evaluate the effect of pulp density in the range of 20 to 40% (w.w-1) on the removal of PCP 21
and PCDD/F from the 1-4 mm fraction of a contaminated soil using attrition. Their results showed that a high pulp 22
density is more efficient for the removal of both contaminants. Indeed, when the pulp density was fixed at 40% 23
(w.w-1), up to 67% of PCP and 62% of PCDD/F were removed from the 1-4 mm soil fraction. 24
1.2 Temperature and stirring rate 25
According to Bayley et al. (2005), the increase of the temperature led to an increase of the removal of organic 26
contaminant (mineral oil) from soils during attrition process (PD = 20%, 1,200 rpm, T = 20-55°C). A study carried 27
out by Guemiza et al. (2016) indicated that increasing the temperature of the solution of attrition between 25 and 1
75°C led to a significant increase of the removal of PCDD/F from the 1- 4 mm soil fraction. In contrast, the 2
temperature had no significant effect on the removal of PCP from contaminated soil during the attrition process. 3
These results are not comparable with those obtained by Tse and Lo (2002) that showed that the increase of the 4
temperature allows an increase of the solubility of PCP. Some researchers presumed that the increase of the 5
temperature leads to a decrease of the potential energy that keeps the contaminant bonded to the surface of the soil 6
particles, increasing the removal of contaminants from the soil (Bayley et al. 2005; Thorvaldsen and Wakefield, 7
1999). 8
Another parameter that could influence the performance of an attrition process is the stirring speed. A study carried 9
out at room temperature showed that three attrition steps of 20 min each performed at 1,700 rpm with a pulp density 10
fixed at 40% (w/w) allowed the removal of 24 - 42% of As, 0 - 13% of Cr, 23 - 46% of Cu, 0 - 85% of PCP and 17 - 11
64% of PCDD/F from the coarse particles (> 0.125 mm) of contaminated soils (Metahni et al. 2016). The attrition 12
tests carried out by Bayley et al. (2005) with an aqueous suspension of contaminated soil showed that the speed of 13
the impeller had a significant effect on the removal of contaminants. Their results suggested that an impeller speed 14
between 1,200 and 1,800 rpm was recommended to product the energy required to the scrubbing (Bayley et al. 15
2005). According to these authors increasing the impeller speed and therefore, the power input to the soil solution 16
enhanced the performance of contaminant removals from contaminated solid matrix. 17
1.3 Surfactant concentration 18
In order to enhance the extraction of organic contaminants such as PAHs, PCP and PCDD/F from contaminated 19
soils, several studies suggested the addition of a surfactant to the attrition process (Olea et al. 2003; Paterson et al. 20
1999; Veetil et al. 2014). Indeed, due to their amphoteric proprieties, these compounds allowed the formation of 21
micelles in solution, enhancing the removal of highly hydrophobic compounds. Bisone et al. (2013) removed more 22
than 90% of PAHs from soils using attrition in the presence of a surfactant ([Cocamidopropyl Hydroxysultaine, 23
CAS] = 0.2 g.L-1). Metahni et al. (2016) found that three attrition steps (PD = 40%, T = 25°C, 1-4 mm soil fraction) 24
allowed the removal of 60% and 97% of PCP with and without the addition of surfactant (cocamidopropylbetaine, 25
BW) at 1% (w.w-1), respectively. Recently, Guemiza et al. (2016) showed that the concentration of the surfactant 26
BW (0 – 3%, w.w-1) was the main parameter influencing the removals of both PCP and PCDD/F from the 1-4 mm 27
soil fraction by attrition (PD = 40%, T = 25°C, t = 20 min, 5 attrition steps), using an experimental design 1 methodology. 2 1.4 Particle size 3
The particle size has an important role in the distribution of both organic and inorganic contaminants in soils. For 4
example, significant amounts of contaminants can be retained by clays due to their large specific surface areas (up to 5
800 m2/g), as well as, their high cation exchange capacity (CEC). A study carried out by Stražišar and Sešelj (1999) 6
showed that it is easier to remove inorganic contaminant (Pb) from coarse fractions than from fine fractions when 7
using attrition scrubbing. Furthermore, the coarse fractions are generally less contaminated (Stražišar and Sešelj, 8
1999). Feng et al. (2001) observed that the effectiveness of attrition (PD = 80%, T = 25°C, t = 30 min, 600 rpm) to 9
remove organic contaminant (Diesel) from soil increased with the increase of the size particles ranging from 0.1 to 10
0.5 mm. Recently, Jobin et al. (2015) showed that attrition did not significantly reduce the concentrations of 11
inorganic contaminants from the 0.250-1 mm soil fraction of a soil contaminated by incineration residues, whereas 12
the concentrations of arsenic, copper and zinc were significantly reduced after treatment by attrition of the 1-2 mm 13
and 2-4 mm soil fractions. According to these authors, the effect of attrition, for metals, was positively correlated 14
with the size of soil particles (Jobin et al. 2015). All of these studies showed that soils having a low porosity such as 15
sands will be better suited to attrition scrubbing than soils with a high porosity. 16
1.5 Type of soil 17
Several parameters influencing the fixation and the behavior of contaminants in soil including its moisture content 18
and the type of contaminants present in the soil, can also impact the performance of an attrition process (Darling et 19
al. 2003; Khodadoust et al. 2005; Ma et al. 2007). Similarly, the pH and the reducing conditions of the soil have a 20
direct influence on the mobility and the availability of contaminants present in soils (Charlatchka et al. 2000; Lee et 21
al. 1998; Subramanian 2007). In addition, the presence of organic matter (humic and fulvic acids), metallic oxides 22
(iron, aluminum or manganese oxides) can immobilize the contaminants into the soil, especially inorganic 23
contaminants (Banerji et al. 1993). According to several authors, As, Cr, Cu, PCP, and PCDD/F are strongly fixed to 24
the organic matter or/and to metal oxides present in the soil, indicating that the efficiency of the decontamination 25
process might be influenced by the nature of the soil (amount of organic matter or metal oxides) (Banerji et al. 1993; 26
Reynier et al. 2013; UK Environment Agency 2009). According to the study carried out Metahni et al. (2016), it 27
appeared that the performance of an attrition process to remove PCDD/F from the coarse soil fractions (> 0.125 mm) 1
was influenced by the nature of the soil (granulometric distribution, pH, total organic carbon (TOC) (organic 2
matter), total inorganic carbon (TIC) and diverse industrial origin), the type and the initial level of contaminants 3
present in soils. 4
The objective of this study was to evaluate the influence of several parameters including the type and the level of 5
contamination as well as the nature of the soil (granulometric distribution, TOC (organic matter), TIC and diverse 6
industrial origin) on the performance of an attrition process to remove As, Cr, Cu, PCP and PCDD/F from 7
contaminated soils. 8
2
Material and Methods
92.1 Soil sampling and characterization 10
Five soil samples (S1, S2, S3, S4 and S5) contaminated by As, Cr, Cu, PCP and PCDD/F were collected from the 11
same area. These soils were chosen for their different levels of contaminants (low, moderate and high), especially 12
for PCDD/F to evaluate the influence of the level of contamination on the performance of the attrition process 13
developed (Guemiza et al. 2016). Other contaminated soils (F1, F2 and F3) emerging from different industrial areas 14
were collected to determine the influence of the nature of the soil (granulometric distribution, pH, TOC, TIC and 15
diverse industrial origin) on the removal of both organic and inorganic contaminants from soils using an attrition 16
process. All these soils were sampled at a depth between 0 and 15 cm on different industrial sites and preserved in 17
High Density Polyethylene (HDPE) containers. Soils were then wet-sieved using a mechanical 76-cm diameter 18
SwecoTM to isolate five soil fractions (< 0.250 mm, 0.250-1 mm, 1-4 mm, 4-12 mm and >12 mm). Each soil fraction 19
was collected separately and dried at 60°C. Then, the particle size distribution was analyzed for each soil (S1, S2, 20
S3, S4, S5, F1, F2 and F3). Initial concentrations of As, Cr, Cu, PCP and PCDD/F were determined in all the 21
fractions (> 12 mm; 4-12 mm; 1-4 mm and 0.250-1 mm) of soils S1, S2, S3, S4 and S5 sampled on the same site (to 22
evaluate the influence of the initial concentration and the particle size on the performance of the attrition process 23
developed) and only in the 1-4 mm fraction of the soils F1, F2, and F3 (to evaluate the influence of the nature of the 24
soil on the performance of the attrition process developed). 25
2.2 Attrition decontamination process 1
All attrition experiments were performed at ambient temperature (T = 25°C) with a pulp density fixed at 40% (w/w), 2
and a concentration of amphoteric surfactant fixed at 2% (Cocamidopropylbetaine: BW, w.w-1) (Guemiza et al. 3
2016). Attrition experiments were performed using a stainless reactor with a capacity of 10 L equipped with internal 4
baffles in triplicate. For each experiments, 2 kg of coarse soil fraction (>12 mm, 4-12 mm, 1-4 mm and 0.250-1 mm) 5
were mixed with tap water during 20 min using a mechanical stirrer (Light EV1 P25, AXFLOW, New York, NY, 6
USA) and a stainless steel axial propeller (6 cm diameter). Agitation was set at 1,700 rotations per minute (rpm). 7
After each attrition step, the solid/liquid separation was carried out by sieving onto different sieves (6 mm for the > 8
12 mm soil fraction, 2 mm for the 4-12 mm soil fraction, 0.5 mm for the 1-4 mm soil fraction and 0.250 mm for the 9
0.250-1 mm soil fraction). The attrited soil (coarser fraction retained by the sieve) was then washed with 4 L of tap 10
water before to be reintroduced to the attrition process until a total of 5 attrition steps were achieved. At the end of 11
the attrition process composed of 5 attrition steps, the attrited soil was placed in a 20-L High-Density Polyethylene 12
(HDPE) container in order to be washed with 4 L of tap water using a Karcher (Karcher, electric sprayer, 140 13
kg/cm2, Quebec, QC, Canada) before to be sieved using the appropriate sieve. Then, 2 L of tap water were sprayed 14
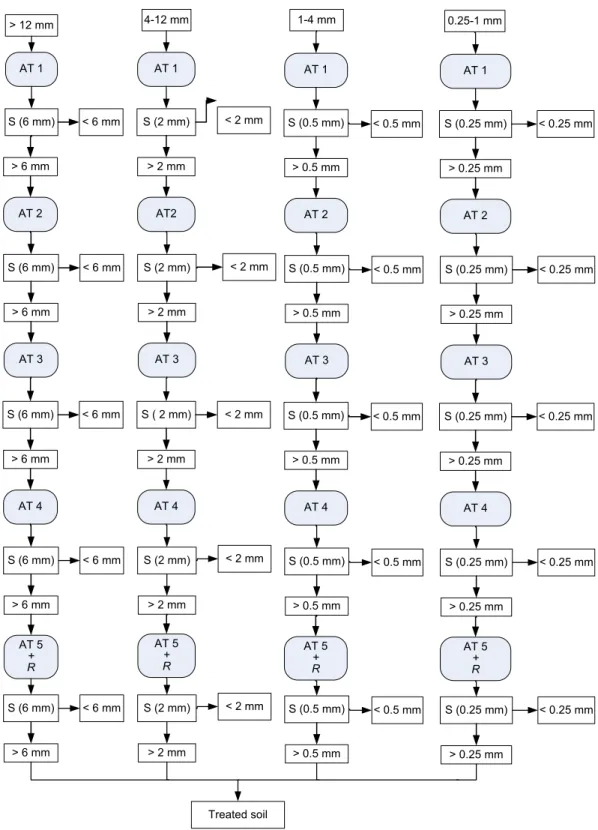
on the attrited soil fraction in order to remove most of the foam. Figure 1 presents the detailed flow sheet of the 15
attrition process applied to the coarse soil fractions (> 0.250 mm). After the solid/liquid separation, the attrited soil 16
fractions were collected and dried at 60°C in an oven and the residual concentrations of PCP, PCDD/F, and metals 17
present in the dry treated soil fractions were then measured. 18
2.3 Influence of soil parameters on the efficiency of the attrition process 19
2.3.1 Influence of initial contaminant contents
20
Five lots of contaminated soils (S1, S2, S3, S4, and S5), having different initial concentrations of contaminants, 21
were sampled in five different locations in the same contaminated site to study the robustness of the attrition process 22
and especially the effect of the initial contaminant contents on the performances of As, Cr, Cu, PCP and PCDD/F 23
removals from contaminated soils. The particle size distribution was performed using four different sieves (12, 4, 1 24
and 0.250 mm). Attrition experiments were performed in triplicate on the 1-4 mm soil fraction of S1, S2, S3, S4 and 25
S5 using operational conditions described in Section 2.2 and defined by Guemiza et al. (2016). 26
2.3.2 Influence of particle size
1
To study the effect of the soil particles size on the efficiency of the optimized attrition process, several attrition 2
assays were performed on all the coarse fractions (0.250-1 mm, 1-4 mm, 4-12 mm et >12 mm) of the soils S1, S2, 3
S3, S4 and S5. All attrition assays were conducted in triplicate using operational conditions described in Section 2.2. 4
2.3.3 Effect of the nature of soils
5
The objective of this part was to evaluate the influence of the nature of the soil on the efficiency of the optimized 6
attrition process. Therefore, soils from various locations (F1, F2 and F3) contaminated by As, Cr, Cu, PCP and 7
PCDD/F, sampled in three different industrial areas, were used for these experiments. The particle size distribution 8
of each soil was performed using four sieves (12, 4, 1 and 0.250 mm). Attrition assays were conducted in triplicate 9
on the 1-4 mm fraction of these soils using operational conditions described in Section 2.2. A characterization of the 10
1-4 mm fraction of each soil sample was performed and the following parameters were followed: total organic 11
carbon, total inorganic carbon, pH and the granulometric distribution. 12
2.4 Analytical methods 13
The pH level was determined according to the method described by the Quebec Expertise Center for Environmental 14
Analysis (CEAEQ) (MA. 100 - S.T 1.0 and MA. 100 - pH 1.1). Total carbon (TC), organic carbon (OC) and 15
inorganic carbon were analyzed using a CHNS Leco analyser (LECO TruSpec® Micro CHNS 932, Michigan, 16
USA). The particle size distribution of the fine fraction of soils was determined by the laser particle sizer (Partica 17
Laser Scattering LA-950V2 – Laser Particle Size Analyzer. Japan (Tokyo), ATS Burlington, Ontario). 18
After mineralization of the soil according to the official method of the Quebec government (MA. 205-Mét/P 1.0), 19
metal and metalloid contents were measured by ICP-AES (Varian, Mississauga, ON, Canada) in our laboratories. 20
The analytical results were controlled with certified standard solutions (Multi-elements Standard 900-Q30-21
100, SCP Science, Lasalle, QC, Canada) and certified soil samples (SQC 001 – Lot 011233). A solution of yttrium 22
was used as an internal standard to ensure that there is no deviation during the analysis. 23
PCP contents present in soils before and after attrition were determined in our laboratories (INRS-ETE). PCP was 24
extracted from soil samples (5-40 g depending on the particle size) with methylene chloride (300 mL) using a 25
Soxhlet extraction. Then, a solution of sodium hydroxide at 20 g.L-1 was used to transfer the PCP in an aqueous 26
phase and a liquid/liquid extraction step was performed. Then, a derivatization step of PCP was performed using 1
anhydrous acetate and a solution of potassium carbonate (75%, v/v). After one night of vigorous mixing, a 2
liquid/liquid extraction step was done after the addition of methylene chloride. Phenanthren-d10 (internal standard) 3
and 13C-pentachlorophenol (recovery standard) were added during the preparation of the samples. PCP analysis was 4
performed by gas chromatography with mass spectroscopy (GC-MS) (Perkin Elmer, model Clarus 500, column type 5
RXi-17, 30 m x 0.25 mm x 0.25 µm) according to the CEAEQ method MA. 400 – Phe. 1.0 (CEAEQ 2013). 6
The analysis of the 17 toxic congeners of PCDD/F was performed in our laboratories according to the CEAEQ 7
method MA. 400 – D.F. 1.1 (CEAEQ 2015). After, a Soxhlet extraction of PCDD/F from soil using toluene, 8
purification and concentration steps were performed using a multilayer silica column followed by an alumina 9
column. After evaporation, an internal standard (13C-labelled analogues purchased at Wellington laboratories) was 10
added and the sample was analyzed using a GC-MS (Thermo Scientific, model Trace 1310 Gas Chromatograph 11
coupled with mass spectrometer detector ISQ, column type ZB Semi-volatile, 60 m × 0.25 mm × 0.25 µm). 12
2.4.1 Statistical analysis
13
The relationship between the amount of organic contaminants removed, expressed in g (dependent variable ) and 14
the initial amount of contaminant, expressed in g (independent variable ) was established as described by the 15
Equation 1 (Cornillon and Matzner-Lober 2006). 16
17
(1)
18 19
Where, y represents the amounts of contaminants removed (g), x represents the initial amounts of contaminant 20
present in the soil (g) and a and b represent the regression coefficients which are estimated using least square 21
approach minimizing the sum of square errors method. 22
The significance of the regression coefficients was tested at a confidence level of 5%. The implementation of the 23
regression model was made using the R software (Team, 2014). This software gives the estimate value of the 24
regression coefficients and the critical probability (p-value) of significance. 25
In order to compare the contaminant removal yields obtained at the end of the attrition process, statistical 1
comparisons were made by Student’s test, attrition experiments were made in triplicates (n = 3). The mean values 2
and standard deviation were calculated for each batch of experiments carried out on the same 1-4 mm fraction of soil 3
sample. A calculated t-value was determined according to the Equations 2 and 3: 4 5 ( ) = ̅ ̅ √ (2) 6 7
Where ( ) represented the calculated t-value, and represented the number of assays for each 8
series ( ); ̅ and ̅ represented the mean value of each series and is calculated according to the 9 following equation: 10 11 ∑ ̅ ∑ ̅ (3) 12 13
Where represented the removal yields obtained for the assays of the serie i. 14
A t-Student table was used to determine the threshold defined for a certain confidence level ( = 0.5%) and degree 15
of freedom (df = 4). To conclude an hypothesis was used that, if the t-values exceed the threshold value, t( = 0.5%. 16
df = 4) = 2.776, the mean values of removal yields are considered as significantly different. 17
3
Results and Discussion
183.1 Influence of initial contaminant contents on the performance of the attrition process 19
One of the goal of this study was to examine the influence of the initial concentration of contaminants (soils S1, S2, 20
S3, S4 and S5) on the performances of the attrition process on the 1-4 mm soil fraction. Some basic characteristics 21
of the 1-4 mm soil fraction obtained for each soil studied and the initial concentration of both inorganic and organic 22
contaminants are given in Table 1. According to these results, it can be noticed that the 1-4 mm soil fraction 23
represented approximately 28-30% for all the soil samples studied. The pH measured for all the soil fractions 1
studied was neutral, with values varying between 7.02 and 7.21. The total and organic carbon concentrations of all 2
the soil fractions studied were relatively low, varying between 0.48 - 0.75% and 0.35 - 0.62%, respectively. The 3
concentrations of As, Cr and Cu varied from 13 to 55 mg.kg-1, from 27 to 64 mg.kg-1 and from 45 to 160 mg kg-1, 4
respectively. These results highlighted that the contamination of the 1-4 mm soil fraction by inorganic compounds 5
was very low. However, the concentrations of PCP and PCDD/F varied from one soil to another one. Indeed, the 6
initial concentrations of PCP measured in the 1-4 mm soil fraction were estimated at 1.1, 2.9, 8.7, 5.1 and 13 mg.kg -7
1 for the soil S1, S2, S3, S4 and S5, respectively. These soil fractions also contained different concentrations of 8
PCDD/F, the lowest concentration was estimated at 1,795 ng TEQ kg-1 whereas the highest concentration was 9
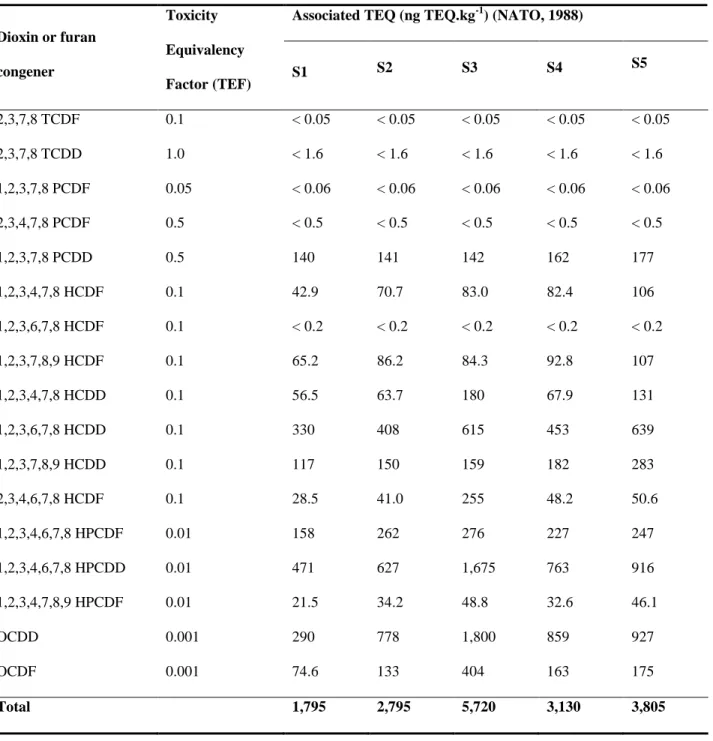
estimated at 5,720 ng TEQ.kg-1. Table 2 presents the toxicity equivalency factors and the associated TEQ obtained 10
for each dioxin and furan initially present in the 1-4 mm soil fraction of S1, S2, S3, S4 and S5. These results showed 11
that only 12 of the 17 congeners considered as toxic were present in the 1-4 mm soil fraction for all the soil samples 12
(S1, S2, S3, S4 and S5). According to the values obtained, it appeared that the congeners 1,2,3,6,7,8 hexa-13
chlorinated (1,2,3,6,7,8 HCDD), 1,2,3,4,6,7,8 hepta-chlorinated (1,2,3,4,6,7,8 HPCDD) and octa-chlorinated 14
(OCDD) dioxins were present in high concentrations in the 1-4 mm soil fractions of S1, S2, S3, S4 and S5. 15
Five attrition steps of 20 min each, carried out in the presence of a biodegradable surfactant ([BW] = 2%, w.w-1) at 16
room temperature with a pulp density fixed at 40% (w.w-1) were applied to 2 kg of the 1-4 mm fraction of the 17
different soils studied. All the experiments were performed in triplicates. According to the results, the removal 18
yields obtained for inorganic contaminants varied between 21 and 51% for As, between 19 and 50% for Cr and 19
between 19 and 54% for Cu (values not showed here). A study carried out by Williford et al. (1999) showed that a 20
pre-treatment by attrition allowed a comparable removal yield for Cr (27%). Recently, Metahni et al. (2016) 21
removed 24% of As, 13% of Cr and 32% of Cu from the coarse soil fractions (>0.125 mm) by an attrition process. 22
These low removal yields can be explained by the low initial contents of these metals in the 1-4 mm soil fraction and 23
by the fact that the attrition process was performed at pH = 7 and that the solubility of metals is not favorable at 24
neutral pH. However, the attrition process developed efficiently removed to remove As, Cr and Cu from the 1-4 mm 25
fraction of soils studied indeed, low residual concentrations of these contaminants have been measured in the treated 26
soils. The removal yields obtained for organic contaminants initially present in the 1-4 mm soil fractions were 27
estimated at 50, 59, 67, 63 and 64% for PCP and 50, 54, 62, 52 and 55% for PCDD/F for the soils S1, S2, S3, S4 28
and S5, respectively. A study carried out by Metahni et al. (2016) showed that an attrition process allowed the 1
removal of 0 – 85% of PCP and 17 – 64% of PCDD/F from the coarse fractions (>0.125 mm) of different soils, 2
depending of the characteristics of the soil studied. These results highlighted that good removal yields were 3
obtained, regardless the initial concentrations of PCP or PCDD/F initially present in the soil fraction, except for S1. 4
The lowest removal yields obtained for the soil S1 (50% for PCP and 50% for PCDD/F) can be explained by the 5
lowest initial concentrations of these contaminants in the 1-4 mm soil fraction compared to the other soils studied. 6
These results prove that the attrition process developed is efficient to remove organic contaminants from the 1-4 mm 7
fraction of soil with the experimental conditions tested. 8
A statistical analysis was performed to determine if the initial concentration of both PCP and PCDD/F can influence 9
the performance of the attrition process to remove these contaminants from the 1-4 mm soil fractions. Figure 2 10
presents the relationship observed between the amounts of contaminant removed and the initial amounts of 11
contaminant in the 1-4 mm soil fractions of S1, S2, S3, S4 and S5 (It is important to note that it represents quantity 12
of contaminants, PCP (mg) and PCDD/F (ng)). According to these results, a linear correlation was observed between 13
the amounts of contaminants removed and the initial amounts of PCP (R2 = 0.999) and PCDD/F (R2 = 0.994). These 14
results also highlighted that the performance of the attrition process did not attain an asymptote when the initial 15
amounts of PCP increased from 2.2 to 26 mg and the initial amounts of PCDD/F increased from 3,590 to 11,440 ng 16
for the treatment of 2 kg of the 1-4 mm soil fraction of soils coming from various sampling point on the same site 17
(S1 to S5). 18
According to the statistical analysis performed on these results, it appeared that this linear correlation was significant 19
for both PCP and PCDD/F removals from the 1-4 mm soil fractions (p-value = 1.21 x10⁻⁸ for PCP and 5.43 x10⁻⁷ for 20
PCDD/F). When correlated the amounts of both PCP and PCDD/F removed (y) with the initial amounts (x) under 21
the relation y = a x + b, results obtained by the used software have neglect the value at the origin (b). The correlation 22
obtained between the amounts of PCP and PCDD/F removed (y) and the initial quantities (x) are shown in the 23
Equation 4 for PCP and the Equation 5 for PCDD/F. 24 25 (4) 26 (5) 27
According to these Equations 4 and 5, it appeared that the linear coefficient (a) was lower than 1 for both PCP (a = 1
0.703) and PCDD/F (a = 0.647) regressions, indicating that a small loss of efficiency of the attrition process to 2
remove these contaminants from the 1-4 mm soil fraction was observed when increasing the initial concentration of 3
these organic compounds. These Equations can be used to estimate the amounts of organic contaminants that can be 4
removed from the 1-4 mm soil fraction by attrition process in the domain of initial concentrations studied. 5
3.2 Influence of the particle size on the performance of the attrition process 6
The second aim of this study was to review the effect of the particle size on the performance of the attrition process 7
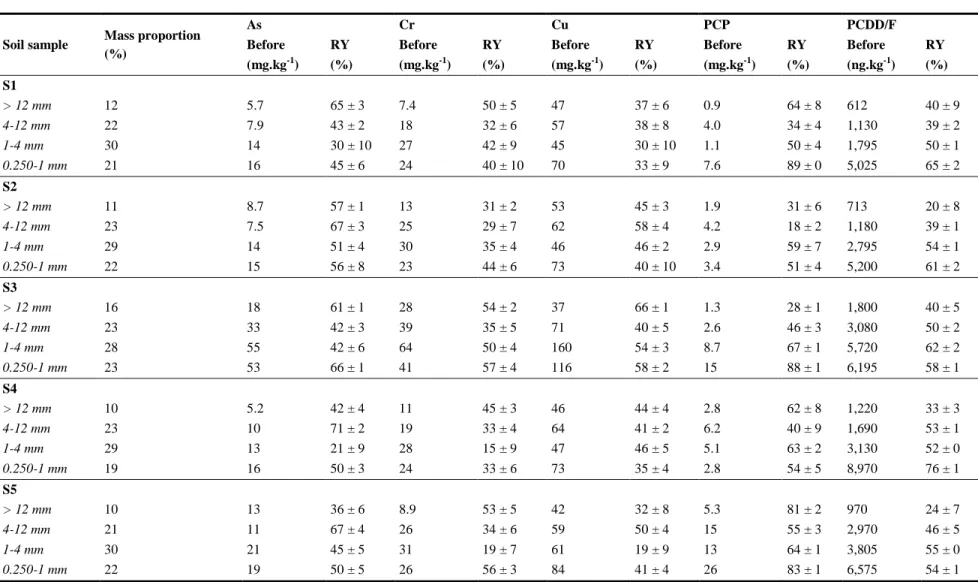
to remove As, Cr, Cu, PCP and PCDD/F from contaminated soils (S1, S2, S3, S4 and S5). Table 3 presents the mass 8
proportions of the different coarse soil fractions (> 12, 4-12, 1-4 and 0.250-1mm), the initial concentration of both 9
inorganic and organic contaminants and the removal yields obtained after the attrition process for each soil studied. 10
According to these results, the coarse fractions represent approximately 21-23% (4-12 mm fraction), 28-30% (1-4 11
mm fraction) and 19-22% (0.125-1 mm) for all the samples studied whereas the coarsest fraction (> 12 mm) 12
represents about 10-16% of the entire soils S1, S2, S3, S4 and S5. The concentrations of As, Cr and Cu varied 13
between 5.2 and 55 mg.kg-1, between 7.4 and 64 mg.kg-1 and between 37 and 160 mg.kg-1, respectively. It can be 14
noticed that the contamination of the coarse fractions by inorganic contaminants was very low for all the samples 15
studied. The removal yields obtained at the end of the attrition process for these inorganic contaminants varied from 16
27 to 71% for As, from 15 and 57% for Cr and from 19 and 66% for Cu; indicating that the attrition process was 17
quite efficient to remove these contaminants, even if they were not problematic. Recently, Metahni et al. (2016) 18
removed 24 - 42% of As, 0 - 13% of Cr and 23 - 46% of Cu by an attrition process applied on the coarse fractions 19
(>0.125 mm) of four different soils. The present study showed that the performances of attrition process studied to 20
remove As, Cr and Cu from the coarse soil fractions was be improved regardless the particle size compared to the 21
previous study (Metahni et al. 2016). 22
The initial concentrations of both organic contaminants varied between 0.9 and 26 mg.kg-1 for the PCP and between 23
612 ng TEQ.kg-1 and 8,970 ng TEQ.kg-1 for the PCDD/F from one fraction to another one of the different soils 24
studied as showed in Table 3. Moreover, our results highlighted an important variation of the removal yields 25
obtained for the different organic contaminants initially present in the coarse fractions of each soil, varying from 18 26
to 89% for PCP and from 20 to 76% for PCDD/F. A study carried out by Metahni et al. (2016) showed that an 27
attrition process applied on the coarse soil fractions (>0.125 mm) allowed quite similar removal yields, 85% for PCP 1
and 64% for PCDD/F. These important differences of metals, PCP and PCDD/F removal yields can be explained by 2
the difference of the particle size and/or by the high heterogeneity of the contaminant contents initially present in the 3
different fractions of soils studied. 4
According to the results obtained in the Section 3.1, a linear correlation was found between the amounts of 5
contaminants removed and the initial amount of PCP and PCDD/F in the 1-4 mm soil fractions of S1, S2, S3, S4 and 6
S5. Another statistical analysis was performed to determine if the particle size can influence the performance of the 7
attrition process to remove PCP and PCDD/F from the coarse soils fractions. Figure 3 presents the relationship 8
observed between the amounts of PCP (Fig. 3a) and PCDD/F (Fig. 3b) removed and the initial amounts of 9
contaminant present in the coarse fractions (It is important to note that it represents > 0.250 mm, 1-0.250 mm, 1-4 10
mm, 4-12 mm and >12 mm pooled on the same figure, that it represents quantity of contaminants, PCP (mg) and 11
PCDD/F (ng)).) of the soil samples S1, S2, S3, S4 and S5. The results showed that, regardless of the particle size of 12
the soil studied, the performance of the attrition process did not attain an asymptote when the initial amounts of PCP 13
and PCDD/F increased from 1.80 to 51.8 mg and from 1,225 to 17,940 ng, respectively, for the treatment of 2 kg of 14
soil using an attrition process. Figure 3 presents the correlation coefficients, the p-values and the Equations obtained 15
for PCP (Fig. 3a) and for PCDD/F (Fig. 3b) obtained when correlating the amounts of both PCP and PCDD/F 16
removed with the amounts initially present in the coarse soil fraction (> 0.250 mm) of S1, S2, S3, S4 and S5. 17
According to the results, the amounts of contaminants removed were significantly correlated with the initial amounts 18
of PCP and PCDD/F (p-value < 0.05 and R2 = 0.96), regardless the particle size of the soil samples studied. In 19
contrast, several studies showed that the effect of attrition was positively correlated with the size of soil particles for 20
remove diesel (Feng et al. 2001) and inorganic contaminants (Jobin et al. 2015; Stražišar and Sešelj, 1999). But, 21
PCP and PCDD/F have different nature than other organic contaminants and inorganic contaminants so there are no 22
comparable. According to Petavy et al. (2009) the percentage of fine particles (attrition sludge) created by the 23
friction force will be higher with the coarse fractions. 24
According to the Equations obtained, it appeared that the linear coefficient (a) was lower than 1 for both PCP (a = 25
0.77) and PCDD/F (a = 0.65) regressions; indicating that a small loss of efficiency of the attrition process to remove 26
these contaminants from the coarse soils fractions (>0.250 mm) of the soil samples studied was observed when the 27
initial concentration of these organic compounds increased from 0.9 to 26 mg PCP.kg-1 and from 612 to 8,970 ng 28
TEQ.kg-1. These Equations can be used to estimate the amounts of organic contaminants that can be remove from 1
the coarse soil samples fractions (>0.250 mm) studied using this attrition process in the domain of initial 2
concentrations studied for the soil samples studied. 3
3.3 Influence of the nature of soils on the performance of the attrition process 4
In this part, the influence of the nature of the soil (granulometric distribution, TOC, TIC, pH and diverse industrial 5
origin) on the efficiency of the optimized attrition process has been evaluated. Three soils (F1, F2 and F3) 6
contaminated by As, Cr, Cu, PCP and PCDD/F, sampled in three different industrial areas were used. Figure 4 7
presents the mass proportion of the coarse soil fractions for each soil studied. The results showed important 8
differences between the mass proportions of the different soil fractions from one soil to another one, which varied 9
from 15.4 to 33.7%, from 13.7 to 31.0%, from 4.60 to 22.5% and from 23.3 to 34.0% for the >12, 4-12, 0.250-1 and 10
<0.250 mm soil fractions, respectively. According to these results, the soil texture of the different soils studied was 11
quite different. Indeed, the soils F1 and F3 were mainly composed of coarse particles (>4 mm) whereas the soil F2 12
contained huge amounts of fine particles (<1 mm). In the case of the 1-4 mm soil fraction, the mass proportion was 13
quite similar for all the soils studied, with values estimated at 14.5, 12.5 and 15.0 for F1, F2 and F3, respectively. 14
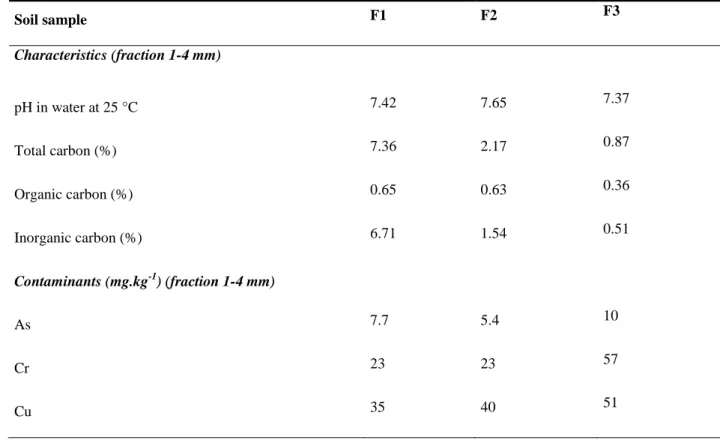
Table 4 presents some basic characteristics of the 1-4 mm soil fraction measured for each soil studied and the initial 15
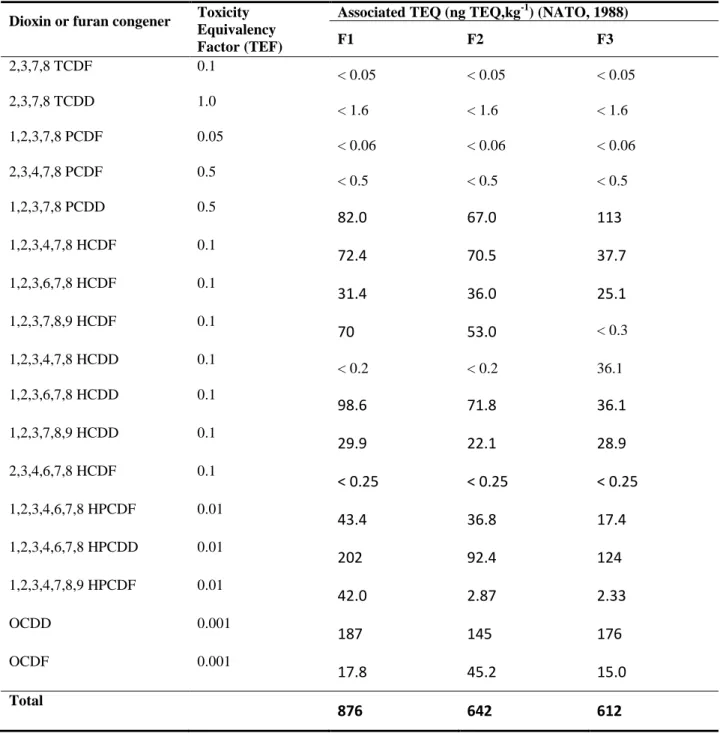
concentration of inorganic contaminants.The initial concentrations of both organic contaminants, PCP and PCDD/F, 16
are presented in Figure 5. The pH measured for the 1-4 mm fraction of the soils F1, F2 and F3 estimated at 7.42, 17
7.65 and 7.37, respectively, indicating that the initial pH of the different soils studied was quite similar. The total 18
carbon measured varied between 0.87 and 7.36% and the inorganic carbon varied between 0.51 and 6.71%. The 19
concentration of organic carbon was relatively low, with values estimated at 0.65%, 0.63% and 0.36% for the soil 20
F1, F2 and F3 (fraction 1-4 mm), respectively, compared with the content of carbon matter (5-7%) of soil which 21
used by Petavy et al. (2009). These results highlighted that the 1-4 mm fraction of the different soils studied present 22
very low concentration of both inorganic and organic contaminants. The concentrations of inorganic contaminants 23
varied between 7.7 and 10 mg As.kg-1, between 23 and 57 mg Cr.kg-1 and between 35 and 51 mg Cu.kg-1 for the 24
different soils studied. However, it was possible to notice that the 1-4 mm fraction of the different soils studied 25
contained similar concentrations of PCP, ranging from 0.32 and 0.49 mg.kg-1 and similar concentrations with an 26
average of 630 ng TEQ.kg-1 for PCDD/F except for F1 which was 876 ng TEQ.kg-1 for PCDD/F. 27
Five attrition steps of 20 min each were applied, in triplicates, to the 1-4 mm fraction of the soils F1, F2 and F3 1
([BW] = 2% (w.w-1), PD = 40% (w.w-1), T = 25°C). This attrition process allowed the removals of a small 2
percentage of inorganic contaminants, with removal yields varying from 18 to 29% for As, from 10 to 33% for Cr 3
and from 14 to 28% for Cu. These low removal yields can be explained by the low initial contents of these metals in 4
the 1-4 mm soil fraction (Table 4). In addition, the attrition process was performed at neutral pH. Indeed, the pH 5
measured in the solution (aqueous phase) after the attrition process varied between 7.3 and 7.5 for all soils studied. 6
These values indicated that the pH of the solution after attrition was similar for the different soils studied, which 7
seemed logical as the pH of the soil samples were similar and near 7.5. Around this pH, the solubility of both metals 8
and organic contaminants is very low, which indicated that the main reasons related to the removals observed for 9
both organic and inorganic contaminants were not due to the pH of the solution. However, the removal of the fine 10
particles, highly contaminated from the coarse particles due to the friction introduced by attrition is the main 11
mechanism implicated into the removal of both organic and inorganic contaminants from the soil fractions studied. 12
Figure 5 presents the initial and final concentrations of PCP (Fig. 5a.) and PCDD/F (Fig. 5b.) measured in the 1-4 13
mm soil fraction of the different soils and the associated removal yields. According to these results, the removal 14
yields obtained for the organic contaminants initially present in the 1-4 mm soil fractions were estimated at 65 ± 1%, 15
75 ± 6% and 72 ± 5% for PCP and 72 ± 3%, 70 ± 8% and 61 ± 7% for PCDD/F for the soils F1, F2 and F3, 16
respectively. 17
Removed quantity of organic contaminants from the 1-4 mm fraction of soils F1, F2 and F3 were calculated (values 18
not showed here) using these removal yields obtained at the end of the attrition process. Also, these removed 19
quantities were estimated using the Equation 4 for PCP and the Equation 5 for PCDD/F deducted in section 3.1. The 20
ratio calculated removed quantity/estimated removed quantity were 109, 117 and 112% for PCP and 125, 122 and 21
108% for PCDD/F for soils F1, F2 and F3, respectively. Results showed that there is still 10 to 25% which is not 22
explained by the equations moderating the attrition removal. But the equations overvalued the results. 23
According to the equality of means test (Student t-test), the t-values were estimated at 2.88 for PCP and 0.42 for 24
PCDD/F (comparison of soils F1 and F2), 2.14 for PCP and 2.58 for PCDD/F (comparison of soils F1 and F3) and 25
4.25 for PCP and 1.55 for PCDD/F (comparison of soils F2 and F3). The comparison of these t-values and the 26
theorical t-value defined for a confidence interval of 95% and a degree of freedom of 4 (theorical t-value = 2.776) 27
revealed that the calculated t-values were higher than the theorical value for the removal of PCP except for the soils 28
F1 and F3 (t = 2.14). However, the calculated t-values were lower than the theorical value for the removal of 1
PCDD/F from all soils studied. These results indicated that the removal yields of PCP obtained were significantly 2
different; except for the removal of PCP from the soils F1 and F3 which were significantly the same. But, for the 3
removal of PCDD/F results indicated that the removal yields obtained were significantly the same. Therefore, it 4
appeared that the attrition process developed was efficient to remove of PCP and PCDD/F from the 1-4 mm fraction 5
of all soil samples. 6
The proportion of attrition sludge recovered following the attrition process of the soils F1, F2 and F3 were around 7
24, 26 and 19%, respectively. Figure 6 presents the particle diameter of the attrition sludge versus percentage of 8
cumulative particles smaller than 500 µm for the 1-4 mm fraction of the soils F1, F2 and F3. Figure 6 shows that the 9
particle size distribution of the attrition sludge recovered at the end of the attrition of 1-4 mm fraction of the soils 10
F1, F2 and F3 was similar. According to this Figure 6, 50% of the attrition sludge particles have sizes lower than 17, 11
25 and 20 µm for the soils F1, F2 and F3. According to Petavy et al. (2009) and the general knowledge on attrition 12
(Wills, 1992), attrition induces the removal of the fine particles which are easily removed from the coarse particles 13
and transferred to the attrition sludge, allowing the removal of the organic matter present on the surface of these fine 14
particles from soil. A plausible hypothesis is that organic contaminants are adsorbed on this organic matter (Bates et 15
al. 2000; Subramanian, 2007). In our study, the organic matter contents (OC) were around 0.64% for soils F1 and F2 16
(1-4 mm fraction) whereas for the soil F3 was only 0.36% which can explain that the removal yields of PCDD/F 17
from the soils F1 and F2 were quite higher than the removal yield from the soil F3 (1-4 mm fraction). Indeed, as 18
hydrophobic compounds such as PCDD/F have a huge affinity to organic matter, the removal of fine particles which 19
contained huge amounts of organic carbon can explained the better PCDD/F removal performances observed for the 20
soils F2 and F3 than for the soil F1. However, for the PCP initially present in high concentrations (few mg/kg) 21
compared to PCDD/F (few µg/kg), the removal yields of this contaminant from soils F1, F2 and F3 seemed to not be 22
proportional to soils organic matter contents. In fact, despite the fact that the organic matter contents of soils F2 and 23
F3 were different (0.64% and 0.36%, respectively), the removal yields of PCP were similar with an overage of 73%. 24
These results can be explained by the low soils organic matter contents. 25
According to several authors, organic contaminants are strongly fixed to the organic matter present in the soil, 26
indicating that the efficiency of the decontamination process might be influenced by this component of the soil 27
(Banerji et al. 1993; UK Environment Agency 2009). However, additional experiments should be performed on 1
contaminated soil having different amounts of organic carbon to confirm or infirm this hypothesis. 2
4
Conclusion
3This research evaluated the performances and the robustness of an attrition process to remove As, Cr, Cu, PCP and 4
PCDD/F from the coarse particles (> 0.250 mm) of contaminated soils. Soils studied were sieved to isolate five soils 5
fractions (< 0.250, 0.250-1, 1-4, 4-12 and >12 mm). Five attrition steps of 20 min each, carried out in the presence 6
of a biodegradable surfactant ([BW] = 2%, w.w-1) at room temperature with a pulp density fixed at 40% (w.w-1) 7
were applied to the coarse fractions (>0.250 mm) of the different soils studied. The first series of assays was 8
performed on the 1-4 mm fraction of five soil samples, located on the same contaminated site, having different 9
initial concentrations of contaminants to examine the influence of the initial concentration of contaminants on the 10
performances of the attrition process. The results showed satisfactory performances of the attrition process to treat 2 11
kg of soil samples when the initial amounts of PCP and PCDD/F increased from 2.2 to 26 mg and from 3,590 to 12
11,440 ng TEQ, respectively. A statistical analysis was used to evaluate the influence of the particle size on the 13
performance of this attrition process. The results showed that the amounts of organic contaminants removed were 14
significantly correlated with the initial amounts of PCP and PCDD/F (p-value < 0.05, R2 = 0.96), regardless the 15
particle size of the soil samples studied. According to these results, the initial level of contaminants and the particle 16
size seemed to not significantly influence the performances of the attrition process to remove inorganic and organic 17
contaminants from the coarse particles of contaminated soils (degree of confidence = 95%).The last series of assays 18
of attrition was performed on the 1-4 mm fraction using soils contaminated by As, Cr, Cu, PCP and PCDD/F, 19
sampled on three different industrial areas. According to our results, the attrition process allowed an important 20
removal of PCP and PCDD/F from the 1-4 mm soil faction, despite the nature (granulometric distribution, TOC, 21
TIC and diverse industrial origin) of the soil. The removal yields obtained varied between 65 and 75% for PCP and 22
between 61 and 72% for PCDD/F. Therefore, the nature of the soil does not seem to influence the performances of 23
the attrition process to remove organic contaminants from the 1-4 mm fraction of contaminated soils. These results 24
are notably encouraging, and this process can be considered for an industrial application. 25
26 27
Acknowledgements
1Sincere thanks are extended to the Natural Sciences and Engineering Research Council of Canada (grant number 2
RDCPJ 463019-14) for their financial contribution to this study. 3
References
1ATSDR. (2007). Toxicological profile for arsenic. Agency for Toxic Substances and Disease Registry, U.S. 2
Department of Health and Human Services, Atlanta, Georgia, USA, 559 p. 3
ATSDR. (2001). Toxicological profile for chlorinated pentachlorophenol. Agency for Toxic Substances and Disease 4
Registry, U.S. Department of Health and Human Services, Atlanta, Georgia, USA, 316 p. 5
Augustijn-Beckers, P.W.M., Hornsby, A.G. & Wauchope, R.D. (1994). SCS/ARS/CES pesticide properties database 6
for environmental decision making II. Additional compounds. Rev. Environ. Contam. Toxicol., 137, 6-16. 7
Banerji, S.K., Wei, S.M. & Bajpai, R.K. (1993). Pentachlorophenol interactions with soil. Water Air Soil Pollut., 69, 8
149-163. 9
Bates, E.R., Grosse, D.W. & Sahle-Demessie, E. (2000). Solidification/stabilization for remediation of wood 10
preserving sites: Treatment for dioxins, PCP, creosote, and metals. Remediation J., 10(3), 51-65. 11
Bayley, R.W. & Biggs, C.A. (2005). Characterisation of an attrition scrubber for the removal of high molecular 12
weight contaminants in sand. Chem. Eng. J., 111, 71-79. 13
Bisone, S., Mercier, G. & Blais, J.F. (2013). Decontamination of metals and polycyclic aromatic hydrocarbons from 14
slag-polluted soil. Environ. Technol., 34, 2633-2648. 15
Bisone, S., Mercier, G. & Blais, J.F. (2012). Toxic metal removal from polluted soil by acid extraction. Water Air 16
Soil Pollut., 223, 3739-3755. 17
CEAEQ (2013) Détermination des composés phénoliques : dosage par chromatographie en phase gazeuse couplée 18
à un spectromètre de masse après dérivation avec l'anhydride acétique. MA. 400-Phé 1.0, Rév. 3, Centre 19
d’expertise en analyse environnementale du Québec, Ministère du Développement durable, de 20
l’Environnement et des Parcs du Quebec, QC, Canada, 20 p. 21
CEAEQ (2015) Détermination des dibenzo-para-dioxines polychlorés et dibenzofuranes polychlorés : dosage par 22
chromatographie en phase gazeuse couplée à un spectromètre de masse. MA. 400-D.F. 1.1, Centre 23
d’expertise en analyse environnementale du Québec, Ministère du Développement durable, de 24
l’Environnement et des Parcs du Québec, Quebec, QC, Canada, 33 p. 25
Charlatchka, R. & Cambier, P. (2000). Influence of reducing conditions on solubility of trace metals in contaminated 1
soils. Water Air Soil Pollut., 118, 143-167. 2
Cornillon, P.A. & Matzner-Lober, E. (2006). Régression: théorie et applications. Statistique et probabilités 3
appliquées. Springer, France, 302 p. 4
Coronas, M.V., Vaz Rocha, J.A., Favero Salvadori, D.M. & Ferrão Vargas, V.M. (2016). Evaluation of area 5
contaminated by wood treatment activities: Genetic markers in the environment and in the child population. 6
Chemosphere, 144, 1207-1215. 7
Darling, C.T.R. & Thomas, V.G. (2003). The distribution of outdoor shooting ranges in Ontario and the potential for 8
lead pollution of soil and water. Sci. Total Environment, 313, 235-243. 9
Dermont, G., Bergeron, M., Mercier, G., & Richer-Laflèche, M. (2008). Metal-contaminated soils: Remediation 10
practices and treatment technologies. Pract. Period. Hazard. Toxic Radioactive Waste Manag., 12(3), 188-11
209. 12
Government of Canada (1990). Polychlorodibenzodioxines et polychlorodibenzofuranes. Loi canadienne sur la 13
protection de l’environnement. Liste des substances d'intérêt prioritaire, rapport d'évaluation no. 1. 14
Government of Canada, Ottawa, ON, Canada, 64 p. 15
Guemiza, K., Coudert, L., Tran, L.H., Metahni, S., Blais, J.F., Besner, S. & Mercier, G. (2016). Optimizing removal 16
of arsenic, chromium, copper, pentachlorophenol and polychlorodibenzo-dioxins/furans from the 1-4 mm 17
fraction of polluted soil using attrition. Environ. Technol., 38(15), 1862-1877. 18
Feng, D., Lorenzen, L., Aldrich, C. & Mare, P.W. (2001). Ex situ diesel contaminated soil washing with mechanical 19
methods. Miner. Eng., 14, 1093–1100. 20
Han, F.X.X., Banin, A., Su, Y., Monts, D.L., Plodinec, M.J., Kingery, W.L. & Triplett, G.E. (2002). Industrial age 21
anthropogenic inputs of heavy metals into the pedosphere. Naturwissenschaften, 89, 497-504. 22
INRS-Georessources & CRM (1997). Protocole d'évaluation de la trabilité des sédiments, des sols et des boues à 23
l'aide des technologies minéralurgiques. Technical report, Environnement Canada, Institut National de la 24
Recherche Scientifique, Centre de Recherches Minérales, Québec, QC, Canada, 148 p. 25
INSERM (2000). Dioxines dans l’environnement: Quels risques pour la santé. Institut National de la Santé et de la 1
Recherche Médicale, Paris, France, 400 p. 2
Jobin, P., Coudert, L., Taillard, V., Blais, J.F. & Mercier, G. (2016). Remediation of inorganic contaminants and 3
polycyclic aromatic hydrocarbons from soils polluted by municipal solid waste incinerator residues. 4
Environ. Technol., 37(15), 1983-1995. 5
Jobin, P., Mercier, G., Blais, J.F. & Taillard, V. (2015). Understanding the effect of attrition scrubbing on the 6
efficiency of gravity separation of six inorganic contaminants. Water Air Soil Pollut., 226, 2422-2428. 7
Khodadoust, A.P., Reddy, K.R. & Maturi, K. (2005). Effect of different extraction agents on metal and organic 8
contaminant removal from a field soils. J. Hazard. Mater., 117(1), 15-24. 9
Lee, M.R., Yeh, Y.C., Hsiang, W.S. & Hwang, B.H. (1998). Solid-phase microextraction and gas chromatography– 10
mass spectrometry for determining chlorophenols from landfill leaches and soil. J. Chromatogr., 806, 317-11
324. 12
Lespagnol, G. (2003). Lixiviation du chrome, du cuivre et de l’arsenic (CCA) à partir de sols contaminés sur des 13
sites de traitement du bois. Ph.D. thesis, École Nationale Supérieure des Mines de Saint-Étienne et de 14
l’Université Jean Monnet, France, 212 p. 15
Ma, L.Q., Hardison, D.W., Harris, W.G., Cao, X.D. & Zhou, Q.X. (2007). Effects of soil property and soil 16
amendment on weathering of abraded metallic Pb in shooting ranges. Water Air Soil Pollut., 178, 297-307. 17
Marino, M.A., Mark Brica, R. & Nelson Neale, C. (1997). Heavy metal soil remediation: The effects of attrition 18
scrubbing on a wet gravity concentration process. Environ. Prog., 16, 208-214. 19
MDDELCC (2016). Répertoire des terrains contaminés. Ministère du Développement Durable, de l’Environnement 20
et de la Lutte contre les Changements Climatiques, Government of Quebec, Quebec, QC, Canada, Site 21
web: http://www.mddep.gouv.qc.ca/sol/terrains/terrains-contamines/recherche.asp, Consulted on January 22
2016. 23
Mercier, G., Duchesne, J. & Blackburn, D. (2001). Prediction of metal removal efficiency from contaminated soils 24
by physical methods. J. Environ. Eng. Div. ASCE, 127, 348-358. 25
Metahni, S., Coudert, L., Chartier, M., Blais, J.F., Mercier, G. & Besner, S. (2016). Pilot-scale decontamination of 1
soil polluted with As, Cr, Cu, PCP and PCDD/F by attrition and alkaline leaching. J. Environ. Eng. Div. 2
ASCE 143(9), 0401055-1-9. 3
Olea, A.F. & Gamboa, C. (2003). Solubilization of phenols in surfactant/polyelectrolyte systems. J. Colloid Interf. 4
Sci., 268, 63-67. 5
Pantsar-Kallio, M., Reinikainen, S.P. & Oksanen, M. (2001). Interactions of soil components and their effects on 6
speciation of chromium in soils. Analytica Chimica Acta, 439, 9-17. 7
Paterson, I.F., Chowdhry, B.Z. & Leharne, S.A. (1999). Polycyclic aromatic hydrocarbon extraction from a coal tar -8
contaminated soil using aqueous solutions of nonionic surfactants. Chemosphere, 38(13), 3095-3107. 9
Petavy, F., Ruban, V., Conil, P. & Viau, J.Y. (2009). Attrition efficiency in the decontamination of stormwater 10
sediments. Appl. Geochem., 24, 153-161. 11
Pichard, A., Bisson, M., Diderich, R., Houeix, N., Hulot, C., Lacroix, G., Lefevre, J.P., Leveque, S., Magaud, H., 12
Morin, A., Rose, M. & Pepin, G. (2005). Chrome et ses dérivés. INERIS - Fiche de données toxicologiques 13
et environnementales des substances chimiques (INERIS –DRC-01-05590-00DF253.doc), 80 p. 14
PNUE (1994). Aspects environnementaux de la préservation industrielle du bois. Technical report No. 20, 15
Programme des Nations Unies pour l’Environnement, Geneva, Swiss, 179 p. 16
Reynier, N., Blais, J.F., Mercier, G. & Besner, S. (2013). Decontamination of metals, pentachlorophenol, and 17
polychlorinated dibenzo-p-dioxins and dibenzofurans polluted soil in alkaline conditions using an 18
amphoteric biosurfactant. Environ. Technol., 35, 177-186. 19
Stražišar, J. & Sešelj, A. (1999). Attrition as a process of comminution and separation. Powder Technol., 105, 205-20
209. 21
Subramanian, B. (2007). Exploring neoteric solvent extractants: Applications in the removal of sorbates from solid 22
surfaces and regeneration of automotive catalytic converters. Division of Research and Advanced Studies, 23
University of Cincinnati, Cincinnati, Ohio, USA, 82 p. 24
Team, R.C. (2014). R: A language and environment for statistical computing. R Foundation for Statistical 25
Computing, ISBN 3-900051-07-0, Vienna, Austria, 2012, (ISBN 3-900051-07-0). 26
Thorvaldsen, G.S. & Wakefield, A.W. (1999). The sand scrubber: an effective environmental application of jet 1
pumps. Hydrotransport, 14, 1-14. 2
Tissier, C., Morvan, C., Bocquené, G., Grossel, H., James, A. & Marchand, M. (2005). Les substances prioritaires 3
de la Directive Cadre sur l’Eau (DCE). Fiches de synthèse. IFREMER, Issy-les-Moulineaux, France, 92 p. 4
Tse, K.K.C. & Lo, S.L. (2002). Desorption kinetics of PCP-contaminated soil: Effect of temperature. Water Res., 5
36, 284-290. 6
UE (2000). Directives 2000/60/EC of the European Parliament and the Council of 23 October 2000 establishing a 7
framework for Community action in the field of water policy. CELEX-EUR Official Journal L 327, 22 8
December 2000, 72 p. 9
UK Environment Agency (2009). Soil guideline values for dioxins, furans and dioxin like PCBs in soil. Science 10
Report SC050021/Dioxins SGV, United Kingdom Environment Agency, Bristol, England, 22 p. 11
US Congress (1995). Cleaning up contaminated wood-treating sites. OTA-BP-ENV-164, Office of technology 12
Assessment, U.S. Government Printing Office, Washington, DC, USA, 45 p. 13
USEPA (2006). Consumer factsheet on copper. United States Environmental Protection Agency, Washington, DC, 14
USA. Website: http://water.epa.gov/safeewater/contaminants/index.html. 15
USEPA (2004). Cleaning up the Nation’s waste sites markets and technology trends, 4th Edition. United States 16
Environmental Protection Agency, Washington, DC, USA, 50 p. 17
USEPA (2003). 40 CFR part 423. Steam electric power generating point source category - Appendix A - 126 18
Priority pollutants. Report EPA 821-R-06-015, United States Environmental Protection Agency, 19
Washington, DC, USA, 128 p. 20
Veetil, D.P., Mercier, G., Blais, J.F., Chartier, M., Tran, L.H. & Taillard, V. (2014). Remediation of contaminated 21
dredged sediments using physical separation techniques. Soil Sediment Contamination, 23, 932-953. 22
Williford, C.W., Li, Z., Wang, Z.M. & Bricka, R.M. (1999). Vertical column hydroclassification of metal-23
contaminated soils. J. Hazard.Mater., 66(1-2), 15-30. 24
Wills, B.A. (1992) Mineral processing technology. 7 th Edition, Pergamon Press, New York, NY, USA. 25
World Health Organization (2003). Pentachlorophenol in drinking-water background fir development of WHO 1
guidelines for drinking water quality. WHO/SDE/WSH/03.04/62, Geneva, Swiss, 18 p. 2
Figure Caption List
1Fig. 1 Flowsheet of the attrition process developed for the decontamination of the coarse particles 2
(> 0.250 mm) of soils contaminated by As, Cr, Cu, PCP and PCDD/F 3
Fig. 2 Correlation between the amounts of contaminant removed and the initial amounts of PCP 4
(a) and PCDD/F (b) present in the 1-4 mm soil fraction for the soils S1, S2, S3, S4 and S5 (1-4 5
mm soil fraction, 5 attrition steps of 20 min each, T = 25°C, PD = 40% (w.w-1), [BW] = 2% 6
(w.w-1)) 7
Fig.3 Correlation between the amounts of contaminant removed from the coarse fractions (> 0.250 8
mm) and the initial amounts of PCP (a) and PCDD/F (b) for the soils S1, S2, S3, S4 and S5 (5 9
attrition steps of 20 min each, T = 25°C, PD = 40% (w.w-1), [BW] = 2% (w.w-1)) 10
Fig.4 The mass proportion of the coarse fractions (>12, 4-12, 1-4, 0.250-1 and <0.250 mm) of the 11
soils F1, F2 and F3 12
Fig.5 The initial and final concentrations of PCP (a) and PCDD/F (b) measured in the 1-4 mm soil 13
fraction of the soils F1, F2 and F3 and the associated removal yields 14
Fig.6 The particle size distribution determined by laser granulomere of the attrition sludge of the 15
1-4 mm fraction of soils F1, F2 and F3 16
Fig. 1. Flowsheet of the attrition process developed for the decontamination of the coarse
particles (> 0.250 mm) of soils contaminated by As, Cr, Cu, PCP and PCDD/F
(Where AT: attrition step, R: Rinsing step and S: sieving step)
> 12 mm S (6 mm) AT 1 > 6 mm < 6 mm 4-12 mm AT 2 S (6 mm) > 6 mm < 6 mm AT 3 S (6 mm) > 6 mm < 6 mm AT 4 S (6 mm) > 6 mm < 6 mm AT 5 + R S (6 mm) > 6 mm < 6 mm S (2 mm) AT 1 > 2 mm < 2 mm 1-4 mm AT2 S (2 mm) > 2 mm < 2 mm AT 3 S ( 2 mm) > 2 mm < 2 mm AT 4 S (2 mm) > 2 mm < 2 mm S (2 mm) > 2 mm < 2 mm S (0.5 mm) AT 1 > 0.5 mm < 0.5 mm 0.25-1 mm AT 2 S (0.5 mm) > 0.5 mm < 0.5 mm AT 3 S (0.5 mm) > 0.5 mm < 0.5 mm AT 4 S (0.5 mm) > 0.5 mm < 0.5 mm S (0.5 mm) > 0.5 mm < 0.5 mm S (0.25 mm) AT 1 > 0.25 mm < 0.25 mm AT 2 S (0.25 mm) > 0.25 mm < 0.25 mm AT 3 S (0.25 mm) > 0.25 mm < 0.25 mm AT 4 S (0.25 mm) > 0.25 mm < 0.25 mm S (0.25 mm) > 0.25 mm < 0.25 mm Treated soil AT 5 + R AT 5 + R AT 5 + R
a.
b.