To link to this article : DOI :
10.3217/jucs-021-13-1726
URL : http://dx.doi.org/10.3217/jucs-021-13-1726
To cite this version :
Bigot, Anthony and Déjean, Sebastien and
Mothe, Josiane Learning to Choose the Best System Configuration in
Information Retrieval: the case of repeated queries. (2015) Journal
of Universal Computer Science, vol. 21 (n° 13). pp. 1726-1745.
ISSN 0948-695X
O
pen
A
rchive
T
OULOUSE
A
rchive
O
uverte (
OATAO
)
OATAO is an open access repository that collects the work of Toulouse researchers and
makes it freely available over the web where possible.
This is an author-deposited version published in :
http://oatao.univ-toulouse.fr/
Eprints ID : 16858
Any correspondence concerning this service should be sent to the repository
administrator: [email protected]
Learning to Choose the Best System Configuration in
Information Retrieval:
the Case of Repeated Queries
Anthony Bigot
(Universit´e de Toulouse, IRIT, UMR5505 CNRS, France [email protected])
S´ebastien D´ejean
(Universit´e de Toulouse, IMT, UMR CNRS, France [email protected])
Josiane Mothe
(Universit´e de Toulouse, ESPE Midi-Pyr´en´ees, IRIT, UMR5505 CNRS, France [email protected])
Abstract: This paper presents a method that automatically decides which system configuration should be used to process a query. This method is developed for the case of repeated queries and implements a new kind of meta-system. It is based on a training process: the meta-system learns the best system configuration to use on a per query basis. After training, the meta-search system knows which configuration should treat a given query.
The Learning to Choose method we developed selects the best configurations among many. This selective process rests on data analytics applied to system parameter values and their link with system effectiveness. Moreover, we optimize the parameters on a per-query basis. The training phase uses a limited amount of document relevance judgment. When the query is repeated or when an equal-query is submitted to the system, the meta-system automatically knows which parameters it should use to treat the query. This method fits the case of changing collections since what is learned is the relationship between a query and the best parameters to use to process it, rather than the relationship between a query and documents to retrieve.
In this paper, we describe how data analysis can help to select among various config-urations the ones that will be useful. The “Learning to choose” method is presented and evaluated using simulated data from TREC campaigns. We show that system per-formance highly increases in terms of precision, specifically for the queries that are difficult or medium difficult to answer. The other parameters of the method are also studied.
Key Words: Information retrieval, Meta search, Evaluation, Learning in IR, System combination, Repeated queries
Category: H.3.3 Information Search and Retrieval
1
Introduction
In information retrieval (IR), a ranking function is used to decide the documents to retrieve according to a query and their order. Document and query similarity is
a key component of the ranking function in which many parameters are involved: the way documents are indexed, the possible query expansion, the similarity function itself, ... Systems vary because they use different parameters.
Over queries, systems do not behave homogeneously and a system that an-swers well a query Q1 can answer query Q2 poorly, while another system does oppositely. As a result, it is impossible to define the best parameter values that fit any query. Rather, most of the approaches optimize the parameters so the results are best in average over queries. Alternatively, it is possible to consider methods which are query-based. We propose such a method. It chooses among a set of system configurations the one that fits the best, on a per query basis.
This principle implies to learn a link between queries and systems. It can be done by learning the association between query features and system fea-tures or parameters. This is done in selective query expansion for example [Amati et al., 2004], [Zhao and Callan, 2012], [Chifu and Mothe, 2014]. In that case, queries are represented by features and the meta-system learns in which cases query expansion should be applied. A new query can then be compared to learned queries on the basis of its features and the expansion decision can be applied.
We consider an alternative process in which learning is applied to individual query: in that case the training consists in associating the best system to each query. In practice, this latest principle is possible if the queries are known in advance only; which is indeed the case for repeated queries.
Several studies have shown repeated queries occur frequently in real ap-plications. Teevan et al. [Teevan et al., 2007] have shown that 33% of queries are exact repeats of a query issued by the same user (equal-query queries) and 25% leads to the same single user click. Sanderson and Dumais studied 3.3 million queries and showed more than 50% of them were repeated queries [Sanderson and Dumais, 2007]. These studies show that it is worth improving system results for repeated queries.
Our method is a selective approach we call “learning to choose” and which has this aim. The learning to choose method implements a meta system that makes use of systems variability. It aims at deciding which system configuration should be used to treat a given query. To do so, the learning to choose method learns the best query-system association: it learns the system configuration to be used for a given query in order to optimize the results. This training phase uses a subset of documents for which the document relevance is known. After training, whenever equal-query queries occur, the learned system configuration will treat the query over the entire document collection.
The main results of this work are:
– The best configuration to use for a query can be learned over a subset of documents for which relevance is known.
– The number of system configurations that are useful can be relatively small: less than 10 configurations are needed to improve Mean Average Precision (MAP) of about 20%.
– Learning to choose improves the results the most on medium hard queries. The paper is organized as follows. In Section 2, we report related works. Section 3 presents the learning to choose method. Section 4 describes the evalu-ation framework. In Section 5 we report and discuss the results. Finally, the last section concludes the paper and draw some future works.
2
Related Works
Our method aims at taking advantage of system variability. Other methods rely on system variability to improve retrieval. Without being exhaustive, this section presents the different types of methods. This section also includes related work on how repeated queries are handled and on selective information retrieval. 2.1 Data Fusion
Data fusion takes advantage of system variability by combining the ranked lists retrieved by different systems for a given information need [Fox and Shaw, 1994]. The issues of data fusion are to decide both the ranked lists to fuse and the fusing function. Fox and Shaw [Fox and Shaw, 1994] suggested several methods to fuse retrieved document lists and show that the resulting meta-system outperforms any of the combined system when considered separately. CombMNZ is the most popular among these measures [Lee, 1997]; it combines the scores the documents obtained using the various systems and favors the documents which are retrieved by a larger number of individual systems.
Some works have shown that the systems to fuse should be independent [Croft, 2000], [Wu et al., 2009]. Some studies have also been carried on the vari-ous parameters that may have an influence on the fusion such as the number of systems to fuse, their performance, and their diversity [Liu et al., 2012]. Liu et al.take into account the ranks the systems obtained and show that effectiveness does not necessarily increases with the number of systems but rather that the systems to be fused have to be effective and enough different one from the other considering the RSC (Rank-score characteristics) feature. One of the issues in data fusion is to assign weights to each component. Wu [Wu, 2012] uses the multiple linear regression technique to learn the best weights, considering both estimated relevance scores and judged scores.
The same fusing function is generally applied whatever the queries are. How-ever, the fusing model can also be learned on a per query basis; in that case, the fusing function is query dependent [Wilkins et al., 2006].
Unlike data fusion which fuse various system results, learning to choose se-lects the best system configuration that should treat a query among several.
2.2 Learning to Rank
Variability and learning are also core elements of learning to rank methods [Liu et al., 2010]. The main goal of learning to rank is to learn a ranking function that optimizes the ranking of web pages or documents.
Various algorithms have been developed that make use of a range of features to be used during learning. Learning to rank relies on machine learning. In the training phase of learning to rank, the examples to learn consist of ranked lists of relevant documents associated with the corresponding information needs. The ranking function is trained on these examples. The testing phase uses the single learned ranking function on new queries [Cao et al., 2007]. Recent work in this domain focus on feature selection [Laporte et al., 2014], [Lai et al., 2013].
Unlike learning to rank, learning to choose does not learn a general function that would work whatever the query is. Rather, the principle of the method is to select the best system configuration on a per query basis by analyzing the performance on a subset of documents; the learned system configuration is then used on the entire set of documents.
2.3 Repeated Queries
Several studies shown that repeated queries occurs frequently in real applica-tions [Smyth et al., 2005], [Sanderson and Dumais, 2007], [Teevan et al., 2007] , and [Tyler and Teevan, 2010]. In addition, Zhang suggested a method to pre-dict repeated queries [Zhang and Lu, 2009]. Thus, improving performance for repeated queries is an important track.
Some approaches process repeated queries by storing documents that should be retrieved. This is done for frequently asked queries for which the results are cached [Baeza-Yates et al., 2007], mainly to answer time response issue. In that case, one assumes that the relevant documents remain the same. In addition, because new documents are continuously added or deleted, index updates lead to cache invalidation: cached results correspond to entries whose results have changed [Blanco et al., 2010]. The cache method can also be used to answer queries that are close to previous queries [Baeza-Yates et al., 2007]. Alternatively [Mothe and Tanguy, 2007], some specific treatments can be done on a per query basis.
In our approach we associate the best system parameters to each query; it thus fits the case of repeated queries. Moreover, since learning to choose does not store the results but rather the best way to obtain them, it can be applied in the context of highly dynamic collections.
2.4 Selective Approach
The literature also investigates selective information retrieval, mainly considering selective query expansion (QE). The basic idea is that, even though query expan-sion (e.g. pseudo relevance feedback query expanexpan-sion) improves system effective-ness in average, some queries are degraded by query expansion. Thus, query ex-pansion should not be applied when it may degrade the results [Amati et al., 2004, Cronen-Townsend et al., 2004, Chen et al., 2012]. Rather than deciding whether the query should be expand or not, more adaptive methods are used to learn the functions according to query features. For example, [He and Ounis, 2004] sug-gest a method to select among several term-weighting models depending on the query. Queries are described by features that are used to cluster them. Training associates the best term-weighting to each query cluster. When a new query is submitted to the system, it decides which cluster the query belongs to and process it by the corresponding system. Chifu et al. [Chifu and Mothe, 2014] presents a selective QE method that relies on a combination of query difficulty predictors. The method combines statistically and linguistically-based predic-tors. The QE method is learned by a SVM (Support Vector Machine). Other per-query techniques [Cao et al., 2008] and [Lv and Zhai, 2009] have been de-veloped.
In previous work, we also suggest three methods that aim at deciding which system(s) would be the best to process a given query considering TREC par-ticipant systems as system candidates [Bigot et al., 2011]. Compared to He and Ounis’ technique that learns some queries over the entire collection, Bigot et al. learns all the queries on a sample of documents. In Bigot et al., the three methods are based on a training stage in which the decision is learned for each query using a sub-set of the document collection and the maximization of a per-formance measure (e.g. precision). Once trained the meta-system knows which system should process the query ; this system will then process the query over the entire document collection. The first method we called OneT2OneS (for One Topic to One System) selects the best retrieval system for each query. The two other variants are based on a first stage that clusters the systems prior to the training phase, then choose an ambassador for each cluster. Finally the best cluster is selected by choosing the ambassador that maximizes the performance measure. The two approaches that use system clustering are OneT2ClusterS (for One Topic to System Cluster) and ClusterT2ClusterS (for Cluster Topic to Cluster Systems). They differ in that ClusterT2ClusterS clusters topics (queries) according to their difficulty.
In this paper we reconsider the OneT2OneS method and analyse in deep the various parameters of the method to draw more useful conclusions. In addition, in this paper, we target repeated queries. In that context, queries are known and the problem is to choose the best system configuration to apply. Compared to
[He and Ounis, 2004] and [Bigot et al., 2011] we do not use various systems but rather various retrieval configurations that do not imply various indexing. We think that our method is easier to use in real systems because of this. Moreover, we evaluate the method and show that a limited number of configurations are needed to improve results, specifically on difficult or medium difficult queries.
3
Learning to Choose System Configurations
3.1 Principle of the Method
In our method, we make the hypothesis that system parameters lead to different system performances depending on the queries. Moreover, the method is based on the fact that for a given query, it is possible to optimize the results in terms of effectiveness by optimizing the system parameters or by using the relevant system parameter values. Following this idea, our method aims at deciding which system parameter values should be used for a given query. In the rest of the paper, a given set of parameter values is called a system configuration.
Our method implements a meta-system that chooses among pre-defined sys-tem configurations on a per-query basis. It is based on a simple learning process or association process.
The training query set consists on all the queries that have been identified as repeated and for which the meta-system should learn the best configuration. The training phase of the learning to choose method is applied to a subset of documents (training set). On this document subset, the various system configu-rations are used to process the queries using a sample of annotated documents. For these documents, we know whether they are relevant to the query or not. Each system configuration treats the training document set over the query set. From the retrieved document lists we compute the evaluation measure for each query and each system configuration. The best configuration is then chosen for each query. After training, the meta-system knows which system configuration should process each query (over the entire and possibly dynamic collection). Whenever an equal-query is submitted to the meta-system, it processes it using the learned system configuration.
The set of system configurations is an important parameter of our method. 3.2 Defining and Selecting the Set of System Configurations
Defining the set of system configurations is not obvious.
First, some IR parameters are more resource demanding than other when making them varying. For example, making indexing parameters varying im-plies to index several times the collection which can be costly in terms of time and storage. For this reason, in the evaluation process, to be more realistic on
the usability of the method for real applications, we only consider retrieval pa-rameters to be variable, while indexing papa-rameters are set once for all.
Second, some parameters have more influence on the result than others [Chifu et al., 2016]. It does not make sense to consider two configurations that does not change the results; rather, it is useful to take advantage of system variability. Moreover, the set of system configurations should be composed of configurations that perform well on average over queries.
In our approach, to be kept, a system configuration should (a) obtain good results on average over the queries (b) obtain better results than the average on a subset of queries. Moreover, it is not mandatory that a given query is treated effectively by several system configurations; one being enough to ensure users satisfaction. As a matter of fact, we do not need to consider all possible system configurations; what is needed is to ensure that at least one available system configuration is effective on each query.
Considering the example given in Table 1, we would like to select either system configuration S1 or S2 to ensure query Q1 is well processed by at least one system configuration. This is also true for system configuration S3 or S4for query Q2.
Table 1: Exemplification- Performances of 4 system configurations on two queries.
S1 S2 S3 S4 Q1 ✞ ✝ ☎ ✆ 0.8 ✞ ✝ ☎ ✆ 0.9 0.2 0.1 Q2 0.2 0.1 ✞ ✝ ☎ ✆ 0.9 ✞ ✝ ☎ ✆ 0.8
More concretely, to select among system configuration candidates we dispose the corresponding performance over the query set on the training document set. For defining the configurations to keep, we iteratively select the most useful configuration as follows:
1. For each query, we compute the value of the performance measure that cor-responds to the highest percentile; the system configuration that gets this value becomes a candidate. For example, if we consider the average preci-sion (AP) as the performance measure, we calculate the AP value AP001for which 1% of the AP values are higher and 99% of the AP values is lower for this query, whatever the system configuration is. Let us consider that the processed query is an easy one and that over system configurations, the best system Sb got a MAP of 0.85, M AP001 for this query is set to 0.85; Sb becomes a candidate.
2. System configurations that have been selected in step 1 constitute the set of candidates for this first iteration.
3. For each candidate, we compute the number of times it has been selected; that is to say the number of queries that selected each configuration. We keep the system configuration which is the most frequent. An additional condition to keep the system configuration is that its frequency is higher than a threshold. For example, Sb has been selected in step 1 by 10 queries and is the most selected configuration and given a threshold of Qmin queries 6 for instance, Sb is definitively kept.
4. The queries that selected this configuration are removed from the query set. Considering our example, the 10 queries that choose configuration Sb are removed.
5. We go back to step 1 considering all system configurations and the remaining queries (in our example using N umber of queries − 10).
If there is no system configuration selected the process is iterated considering the second percentile (the performance value for which 98% of the values are higher than it), third percentile, ... If less than T queries remain unmatched, they have to all be selected at once (the percentile criteria is relaxed); this results in selecting the best system in average on the remaining topics. This rule is used to avoid selecting hardest topics one by one while percentile is decreasing.
4
Evaluation Framework
4.1 TREC Collection to Simulate Data
Evaluating our method in a real context implies to have access to real data (repeated queries, documents, document relevance); such a collection is not freely available. For this reason, we simulated the environment by evaluating our method on data from TREC (Text Retrieval Conference1
). The collection we used (TREC7 and TREC8 adhoc sets) is composed of approximately 528, 155 documents (2 gigabytes), a set of 100 natural language topic statements and the associated relevance judgments. In our experiment, any TREC topics are consid-ered as repeated information needs. Topics are composed of a title, a description and a narrative part and correspond to information needs. Notice that, since the methods are evaluated on TREC, we distinguish topics and queries in the rest of the paper: topic is used to refer to a TREC topic; a query is the internal representation used by the search system and is built from a topic. QRel consists of document relevance judgements for each topic. By confronting them to the
1
list of retrieved documents, it is possible to compute performance measures to evaluate system configuration performance.
4.2 Evaluation Measures and Methods We use the TREC evaluation software trec eval2
, version 9.0 that computes many measures. Evaluation measures have been shown to be highly correlated [Baccini et al., 2011]. In this work, we only consider average precision (AP) for each topic and mean average precision (MAP) over topics. AP is the result of averaging precision (number of relevant retrieved documents over retrieved documents) each time a relevant document is retrieved. MAP characterises a system configuration by averaging AP over topics.
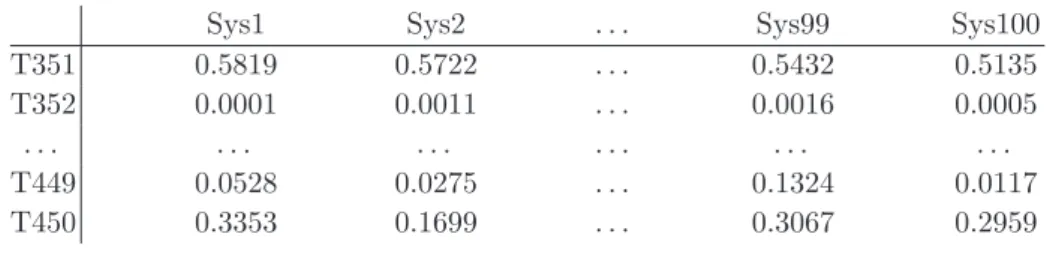
Using AP to evaluate the system configurations, we store AP in a table in which lines correspond to topics and columns to system configurations as illustrated in Table 2.
Table 2: Extract of the AP data - TREC Ad-hoc.
Sys1 Sys2 . . . Sys99 Sys100
T351 0.5819 0.5722 . . . 0.5432 0.5135
T352 0.0001 0.0011 . . . 0.0016 0.0005
. . . .
T449 0.0528 0.0275 . . . 0.1324 0.0117
T450 0.3353 0.1699 . . . 0.3067 0.2959
In our experiments, we partition the document collection according to a training part of 2⁄
3 and a test part of 1⁄3; 10 random selections are performed
then we average the results over the 10 collections [Freund et al., 1996]. The repetition of queries is simulated by treating the same topic on test documents. Evaluation uses the QRel after removing the training documents from it.
The performance of our approach is compared to a baseline. The baseline is defined as the result of the best system configuration over the queries. The mean of all ten baselines (from cross-validation) is the general baseline. It was mandatory since the set of documents varies and thus the MAP varies as well depending on the draw.
4.3 Building System Configurations
We use the Terrier platform [Ounis et al., 2006] in our experiments. Terrier al-lows to choose modules from the three steps of the IR process:
2
– Indexing: stemmer, size of blocks, empty documents ignored or not; – Matching: retrieving model, topic fields to use, low idf terms ignored or not; – Query expansion (QE): QE model, number of terms to add to the query, number of top documents to consider for QE, number of top documents a term should appear in to be used during QE.
Concretely, we built different runs using Terrier. We used a specific tool we developed on top of Terrier [Louedec and Mothe, 2013] in order to generate massive numbers of runs using the various models and parameters available in Terrier. Rather than having to re-write a program that requests Terrier many times in its command mode (e.g. trec terrier.sh − r − Dtrec.model = BB2), this interface allows deciding which parameters one wishes to vary, in which range, etc. The interface is based on Terrier 3.5 and written in Java.
Not all the parameters are equal in terms of resource needed. For example, using different indexing implies to re-index the entire collection and to store twice the inverted files. Once the index is built, it is also less resource demanding to process a simple search than a pseudo-relevance feedback (the latter implies two searches, one with the initial query and a second with the expanded query).
To be more realistic with regard to applicability, we considered a single in-dexing. Indeed, indexing is costly in terms of time processing, disk space and updates when creating an IR stream. For that reason, we consider a single in-dex and thus inin-dexing parameters are set once. The only parameters that we make varying are matching and query expansion parameters. The indexing phase uses the default Terrier stopword list, Porter stemmer algorithm, a block size of 1 and ignores empty documents. Indeed using different stopword lists does not have significant impact on the results but using one (rather than none) does significantly improve the results [Dolamic and Savoy, 2010]. Fuller et al. [Fuller and Zobel, 1998] showed Porter stemmer is the most accurate. Also Com-paore et al. [Compaor´e et al., 2011] showed that block size different from 1 and empty documents do not change the results significantly.
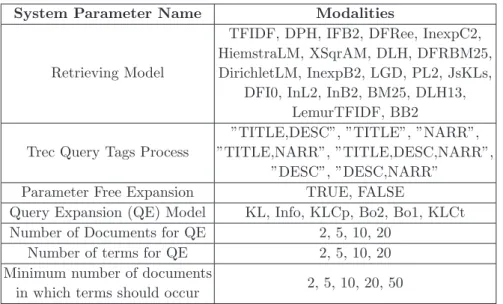
From this single indexing, we then run various system configurations making the other parameters varying. Table 3 presents the modalities of the different parameters we used to generate the runs. The detailed description of these pa-rameters can be found on Terrier web site3
. These runs correspond to candidate system configurations.
We then select the 100 best configurations. More precisely, we kept only the 100 ones that get an AP over 0.2 for at least 50% of the topics. This threshold of 0.2 is set to ensure that the performance of the selected system configurations is good enough.
3
Table 3: System parameters with the corresponding values
System Parameter Name Modalities
Retrieving Model
TFIDF, DPH, IFB2, DFRee, InexpC2, HiemstraLM, XSqrAM, DLH, DFRBM25, DirichletLM, InexpB2, LGD, PL2, JsKLs,
DFI0, InL2, InB2, BM25, DLH13, LemurTFIDF, BB2 Trec Query Tags Process
”TITLE,DESC”, ”TITLE”, ”NARR”, ”TITLE,NARR”, ”TITLE,DESC,NARR”,
”DESC”, ”DESC,NARR”
Parameter Free Expansion TRUE, FALSE
Query Expansion (QE) Model KL, Info, KLCp, Bo2, Bo1, KLCt
Number of Documents for QE 2, 5, 10, 20
Number of terms for QE 2, 5, 10, 20
Minimum number of documents
in which terms should occur 2, 5, 10, 20, 50
These 100 configurations can then be used directly in the learning to choose process or be filtered out to decrease their number. We considered two ways of filtering them out: using a clustering method (see Section 5.1) and using a more sophisticated method (see Section 5.2).
5
Results and Discussions
5.1 Impact of the Number of System Configurations
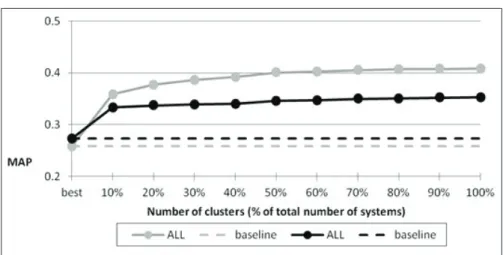
In real applications, using 100 system configurations can be costly. For that reason, we study the impact of the number of system configurations to use. We consider various selection thresholds (10, 20, 30...100 configurations). One solution could be to randomly select the systems. However this solution would not take advantage of system variability. For this reason, we prefer to select system configurations that behave differently on the topics. To do so, an hybrid clustering (hierarchical clustering combined to K-means) is applied so system configurations of each cluster lead to close performance in terms of AP for each topic of the cluster on the training document set. For each cluster the best configuration is selected to be used in the learning to choose process. This method insures that the selected configurations are different enough. We then consider several thresholds: we analyse the results when 100% of the configurations are used (no clustering), when 90% of the initial configurations are used, 80% ... until 10% (meaning that only 10 configurations are used, corresponding to 10 different clusters or configuration profiles).
Figure 1 shows the results of this experiment.
Figure 1: Analysis of the number of different system configurations. Grey lines corre-sponds to the training phase, and black lines to the testing phase. Dashed line is the baseline and plain line with dots correspond to the average over all ten sub-collections. Dotted lines represent the result of a random selection.
Results presented in Figure 1 show that using only 10 different system configu-rations, improves the results from 0.28 to 0.34 which corresponds to an increase of 22%. Using more than 10 system configuration (10%) candidates does not improve the results very much specifically on the testing phase.
From this preliminary study, we conclude that 10 configurations are enough to significantly improve the performance but less could also be enough.
In the following, we select a minimal set of system configurations (less than 10) to make further analysis on the behaviour of the selection technique on a small sample of configurations.
5.2 Defining a Minimal Set of System Configurations
To select a minimal and optimal set of systems, we apply the method presented in Section 3.2 to the previous set of 100 system configurations.
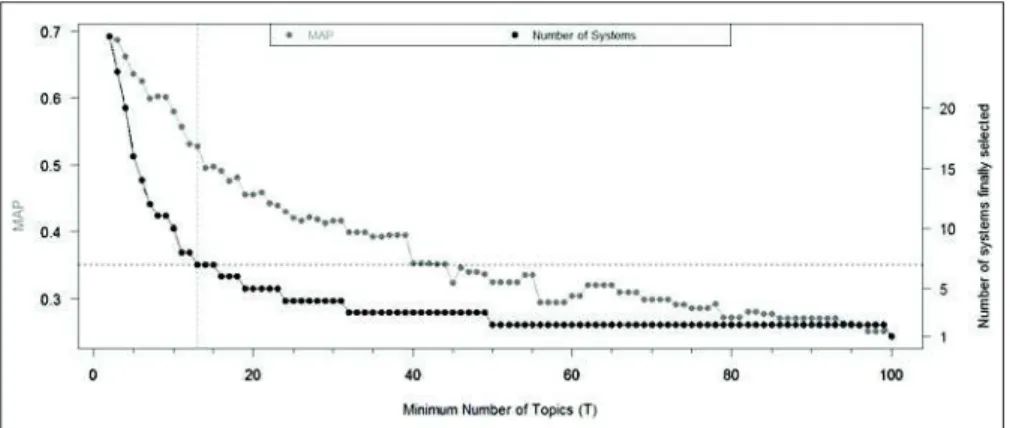
One parameter of the method is the minimum number of topics a system is effective for to be selected. Figure 2 shows the lower the number of topics T is, the more specific the selection is, and the better the results are. However, we do not want to be too specific because that leads to selecting too many system configurations; for that reason we consider 10 configurations or less.
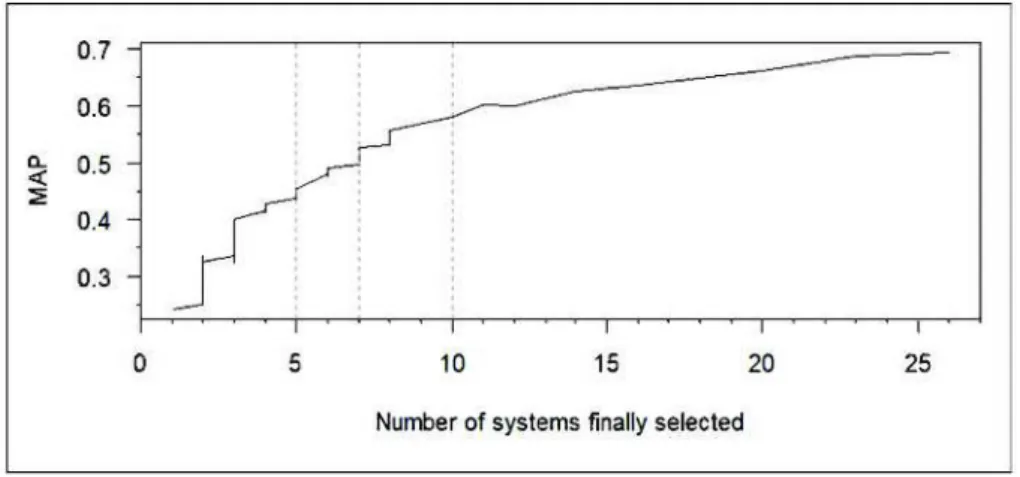
Figure 3 displays the average MAP in function of the number of system configurations; 10 being the maximum number of system configurations we allow to be selected by the algorithm. As a compromise between effectiveness and the number of selected system configurations, we choose 7 possible configurations.
Figure 2: Number of selected system configurations (right axis) & performance (left axis) according to T.
This corresponds to 3 different possibilities of the number of topics T (see the dots hovered by horizontal dashed line in Figure 2) and the best MAP (0.528) is obtained for T=13 (vertical dashed line).
The 7 configurations are detailed in Table 4.
Table 4: Most useful system configurations. In the third column, the parameters are given in the following order: Retrieving Model, Topic field, Query expansion model,
Number of documents, Number of terms.
Configuration name MAP System parameters value
Run1 0.2429 DFRee; T; Bo2; 20; 5
Run2 0.2487 BB2; T; Bo1; 20; 15
Run3 0.2196 BM25; T; Bo2; 5; 2
Run4 0.2366 InL2; TD; Bo2; 5; 20
Run5 0.2172 InB2; T; Bo2; 10; 2
Run6 0.2245 InL2; TD; Bo2; 2; 5
Run7 0.1907 InB2; TDN; Bo1; 10; 20
Within these 7 configurations, different search models have been selected (DFRee, BB2, BM25, InL2 and InB2). Moreover, in the majority of cases, the topic field used is the title (T); Title + Descriptive (TD) is chosen twice and the full topic (TDN) once; we could have restricted ourselves to runs where title only was used, but we decided differently considering that descriptive and narrative fields could be captured in real applications using past queries or users profiles. The query expansion models are either Bo1 or Bo2 for any of the 7 configurations. Finally, the number of documents used in the pseudo relevance feedback and the number of terms used to expand the queries vary from 2 to 20.
0.7 0.6 a_ 4: 0.5 ::!:
î
:
0.4 0.3_r
:
0 5 10 15 20 25Number of systems finally selected
Figu.re 3: Average perfonnance according Lo t:he number of selected system configura -tions. The black tine js the number of selected system configurations and the grey line is the l\IIAP; MAP avera,ges the AP of Lhe systems selected for eacb topic during the selection.
Table 5 provides addit.ionaJ features about. the 7 selected corrfigura!.ions. The best AP varies from one run at the other as weil as the topic for which the besL AP is obt.ained. Although the method aims aL selecting configuraLions thaL
best fit for sorne of the topics, t.he resulLs show that Lhe selected configmaLions perfonn weJl on common topics: wh en considering the best 10 topics over the 7
configurations, we get a Lotal of 18 different topics.
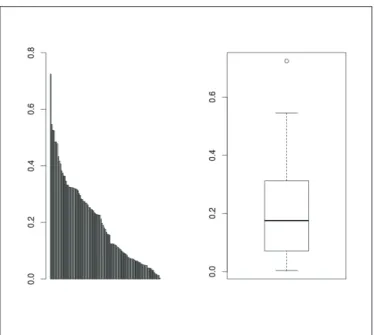
Interestingly, Figure 4 (left part) sbovvs for each topic (x-axis) the difference between the maximum and the minimum AP over the 7 conflgmations; these
differences are sorted in decreasing order. For half the queries (see right sicle of Figure 4), Lhis difference is higher tha.n 0.18; given Lhe fad thaL [or the besL run (R.un2) l\IIAP is of 0.2487 and tha.t half of the queries get an AP lower
than 0.17; this difference is important. This means that by choosing the relevant configuration of systems for ead1 query. one can largely improve t.he overall performance.
Figure 4: Difference between the Max and Min AP over the 7 configurations for the 100 topics, sorted in decreasing order on the left; boxplot of the same values on the right.
Table 5: Features about the 7 selected configurations
Config. Best AP Worst AP Best 10 topics
Run1 T365 0.8847 T432 0.012 T351 T365 T368 T403 T410 T423 T425 T430 T441 T444 Run2 T410 0.8859 T433 0.0000 T351 T365 T368 T390 T403 T410 T415 T431 T441 T444 Run3 T410 0.8668 T433 T432 0.0000 T351 T365 T382 T403 T410 T423 T429 T430 T431 T444 Run4 T365 0.8553 T389 T397 T397 0.0000 T351 T365 T382 T403 T410 T423 T430 T441 T447 T450 Run5 T410 0.8731 T433 0.0000 T351 T365 T368 T382 T403 T410 T430 T431 T441 T444 Run6 T365 0.8172 T397 T442 0.0000 T351 T365 T382 T403 T410 T423 T430 T441 T444 T450 Run7 T447 0.7100 8 topics 0.0000 T351 T361 T365 T368 T382 T410 T423 T444 T447 T450
\
~
~
...._
_
_
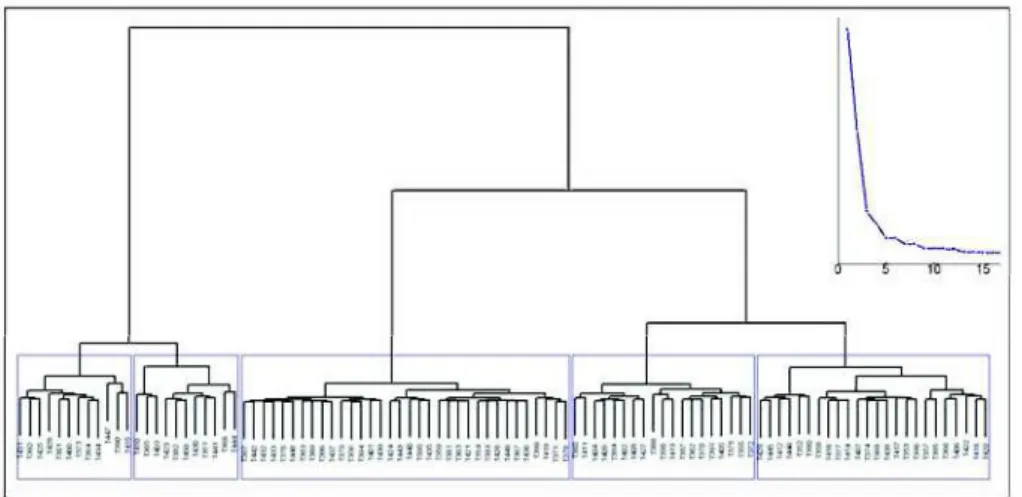
Figure 5: Hierarchical clustering on data computed with the full collection of docu
-ments.
5.3 Impact of the Topic Difficulty
ln Lhis section we evaluate the performance of learning to choose using Lhe se-lecLion of systems ( Lhe 7 previous configuraLions) tlSing levels of Lopic clilll.cuhy.
Again, t,o avoid ranclomness effect t,ba.t could lead to one lucky or unlucky
ex-periment, we proceed a c.ross validation on ten different spüts of the clocumenL
collection.
As we ran 10 experiments, the number of topic cl.usters may change from
one experiment to another. To be able to merge the results, we need to keep the same munber of clusters for all 10 experiments. Bach clusLer is cha.racterised by a difficulty label a.ccorcling to AP systems obtained. Among the 10 experiments,
we observed thaL 4 to 6 levels of topic di.fficulty would be optimal for Lhe leaming
to d1oose method. To set. the number of difficulty levels to consider, we run the hientrchical clustering on data computed with the full collection of documents. The resulting dendrogram is shown in Figure 5. The Lop right corner of Lhe
figure displays the inerLia loss of the last 15 steps of the clustering. The firsL
optimal eut is 5 dusters so we run the lO cross validation experiments with 5 Lopic c.lusters. Indeed. from lhe clustering, il ca.n be concluded that 5 difficulty
levels is a reasonable choie~~.
As the number of topics in a difficulty level varies along the 10 experiments,
the overall average MAP by cluster is weight.ed witlt the number of topics
in-cluded in the consirlered leve!. This is clone for both the meta-system and the baseline. Figure 6 clisplays the <.tverage mean of MAP by topic difficulty leve]
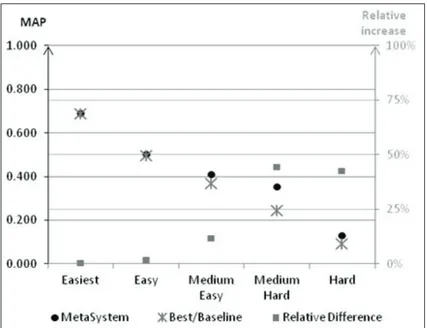
Figure 6: Fusion Results according to topic difficulty. Black dots correspond to the MAP of the meta-system and grey dash show the baseline MAP and are read on the left axis (with black guidelines). Grey squares show the relative difference between the meta-system and the baseline and are read on the right axis (with grey guidelines).
“hard”, those on which they performed less poorly are qualified “medium hard” and so on for “medium easy” level, “easy” level and finally the “easiest” level on which systems performed greatly.
We show that performances are poorly increased on easy topics; that can be explained by the fact it is hard to improve system performances when they already are really high. At least, performances are not degraded. Performances on medium easy topics are improved by 12%; according to the t-test, the increase is significant for 6 experiments out of 10.
The best improvement is observed for the medium hard topics with an in-crease of 44% (inin-crease is significant for 9 experiments). Finally, the hardest topics are improved by 43%. However the absolute increase is little (0.04), it is still significant for 8 experiments.
6
Conclusion and Future Works
This work has been possible thanks to the French ANR agency through their support of the CAAS-Contextual Analysis and Adaptive Search project (ANR-10-CORD-001 01).
In our work, we proposed a method easy to reproduce to select a subset of systems that are then used in a query-based selective process. Systems are selected on the base that whether or not their performances belong to the high-est percentile for a defined number of topics. Matched topics are successively deleted from the selection until no topics remain. The analysis of this selection method leads to select seven systems in order to balance performances and real conditions. Even if the last matched topics are poorly performed by the selected systems, due to the selection method itself, the evaluation is not degraded.
Learning to choose has been then evaluated on the seven systems and clus-ters of topics are defined according to system performances: the better system performances are, the easier the topic are. The evaluation shows that, based on a given set of systems, a fusion method is able to improve retrieval performances from 12% on medium difficulty topic to 44% on hard topics. Since results of the information retrieval process are not stored, the method is able to deal with dynamic collections. Learning to choose focuses on the case of repeated queries; for unseen queries, the meta-search system would use the best system in average. In this study, query clusters are defined after queries have been processed at least once. This is possible in the context of repeated queries. However, such a method is not able to deal with queries submitted for the first time. Ac-tually, future works should focus on applying difficulty prediction techniques. Such techniques can be based on linguistic predictors [Mothe and Tanguy, 2007] or on different predictors such as query ambiguity [Chifu, 2013].
References
[Amati et al., 2004] Amati, G., Carpineto, C., and Romano, G. (2004). Query diffi-culty, robustness, and selective application of query expansion. Advances in Infor-mation Retrieval, pages 127–137.
[Baccini et al., 2011] Baccini, A., D´ejean, S., Mothe, J., and Lafage, L. (2011). How many performance measures to evaluate information retrieval systems ? Knowledge and Information Systems, 30(3):693–713.
[Baeza-Yates et al., 2007] Baeza-Yates, R., Gionis, A., Junqueira, F., Murdock, V., Plachouras, V., and Silvestri, F. (2007). The impact of caching on search engines. Proc. of the 30th annual international ACM SIGIR conference on Research and de-velopment in IR, pages 183–190.
[Bigot et al., 2011] Bigot, A., Chrisment, C., Dkaki, T., Hubert, G., and Mothe, J. (2011). Fusing different information retrieval systems according to query-topics: a study based on correlation in IR systems and TREC topics. Information Retrieval Journal, 14(6):617–648.
[Blanco et al., 2010] Blanco, R., Bortnikov, E., Junqueira, F., Lempel, R., Telloli, L., and Zaragoza, H. (2010). Caching search engine results over incremental indices. In Proc. of the 19th International Conference on World Wide Web, WWW, pages 1065–1066. ACM.
[Cao et al., 2008] Cao, G., Nie, J.-Y., Gao, J., and Robertson, S. (2008). Selecting good expansion terms for pseudo-relevance feedback. In Proceedings of the 31st annual
international ACM SIGIR conference on Research and development in information retrieval, SIGIR ’08, pages 243–250, New York, NY, USA. ACM.
[Cao et al., 2007] Cao, Z., Qin, T., Liu, T.-Y., Tsai, M.-F., and Li, H. (2007). Learn-ing to rank: from pairwise approach to listwise approach. In Machine LearnLearn-ing, Proceedings of the Twenty-Fourth International Conference (ICML, pages 129–136. [Chen et al., 2012] Chen, C., Chunyan, H., and Xiaojie, Y. (2012). Relevance feedback
fusion via query expansion. In Proceedings of the The 2012 IEEE/WIC/ACM In-ternational Joint Conferences on Web Intelligence and Intelligent Agent Technology - Volume 03, WI-IAT ’12, pages 122–126, Washington, DC, USA. IEEE Computer Society.
[Chifu, 2013] Chifu, A. (2013). Pr´edire la difficult´e des requˆetes : la combinaison de mesures statistiques et s´emantiques . In Conf´erence francophone en Recherche d’Information et Applications (CORIA), pages 191–200.
[Chifu et al., 2016] Chifu, A., Ayter, J., Desclaux, C., Djean, S., and Mothe, J. (2016). Statistical analysis to establish the importance of Information Retrieval parameters. Journal of Universal Computer Science.
[Chifu and Mothe, 2014] Chifu, A. and Mothe, J. (2014). Expansion s´elective de requˆetes par apprentissage . In Conf´erence francophone en Recherche d’Information et Applications (CORIA), pages 231–246. LORIA.
[Compaor´e et al., 2011] Compaor´e, J., D´ejean, S., Gueye, A. M., Mothe, J., and Ran-driamparany, J. (2011). Mining information retrieval results: Significant IR parame-ters. In Advances in Information Mining and Management. IARIA.
[Croft, 2000] Croft, W. B. (2000). Combining approaches to information retrieval, chapter 1, pages 1–36. Kluwer Academic Publishers.
[Cronen-Townsend et al., 2004] Cronen-Townsend, S., Zhou, Y., and Croft, W. B. (2004). A framework for selective query expansion. In Proceedings of the thirteenth ACM international conference on Information and knowledge management, CIKM ’04, pages 236–237, New York, NY, USA. ACM.
[Dolamic and Savoy, 2010] Dolamic, L. and Savoy, J. (2010). When stopword lists make the difference. JASIST, 61(1):200–203.
[Fox and Shaw, 1994] Fox, E. A. and Shaw, J. A. (1994). Combination of multiple searches. In Proc. TREC-2, pages 243–249.
[Freund et al., 1996] Freund, Y., Schapire, R. E., et al. (1996). Experiments with a new boosting algorithm. In ICML, volume 96, pages 148–156.
[Fuller and Zobel, 1998] Fuller, M. and Zobel, J. (1998). Conflation-based compari-son of stemming algorithms. In In Proceedings of the Third Australian Document Computing Symposium, pages 8–13.
[He and Ounis, 2004] He, B. and Ounis, I. (2004). Inferring query performance using pre-retrieval predictors. In proc. of the 11th International Conference, SPIRE, pages 43 – 54.
[Lai et al., 2013] Lai, H.-J., Pan, Y., Tang, Y., and Yu, R. (2013). Fsmrank: Feature selection algorithm for learning to rank. Neural Networks and Learning Systems, IEEE Transactions on, 24(6):940–952.
[Laporte et al., 2014] Laporte, L., Flamary, R., Canu, S., D´ejean, S., and Mothe, J. (2014). Nonconvex regularizations for feature selection in ranking with sparse svm. Neural Networks and Learning Systems, IEEE Transactions on, 25(6):1118–1130. [Lee, 1997] Lee, J. H. (1997). Analyses of multiple evidence combination. In ACM
SIGIR Forum, volume 31, pages 267–276. ACM.
[Liu et al., 2012] Liu, H., Wu, Z., and Hsu, D. F. (2012). Combination of multiple retrieval systems using rank-score function and cognitive diversity. In Advanced Information Networking and Applications (AINA), 2012 IEEE 26th International Conference on, pages 167–174. IEEE.
[Liu et al., 2010] Liu, T.-Y., Joachims, T., Li, H., and Zhai, C. (2010). Introduction to special issue on learning to rank for information retrieval. Inf. Retr, 13(3):197–200.
[Louedec and Mothe, 2013] Louedec, J. and Mothe, J. (2013). A massive generation of ir runs: Demonstration paper. In Research Challenges in Information Science (RCIS), 2013 IEEE Seventh International Conference on, pages 1–2. IEEE. [Lv and Zhai, 2009] Lv, Y. and Zhai, C. (2009). Adaptive relevance feedback in
in-formation retrieval. In Proceedings of the 18th ACM conference on Inin-formation and knowledge management, CIKM ’09, pages 255–264, New York, NY, USA. ACM. [Mothe and Tanguy, 2007] Mothe, J. and Tanguy, L. (2007). Linguistic analysis of
users’ queries: towards an adaptive information retrieval system. In SITIS 07 Third International IEEE Conference on Signal-Image Technologies and Internet-Based System.
[Ounis et al., 2006] Ounis, I., Amati, G., Plachouras, V., He, B., Macdonald, C., and Lioma, C. (2006). Terrier: A high performance and scalable information retrieval platform. In Proc. of ACM SIGIR Workshop on Open Source Information Retrieval. [Sanderson and Dumais, 2007] Sanderson, M. and Dumais, S. T. (2007). Examining repetition in user search behavior. In Proc. of the 29th European Conference on IR Research, ECIR, pages 597–604.
[Smyth et al., 2005] Smyth, B., Balfe, E., Freyne, J., Briggs, P., Coyle, M., and Boydell, O. (2005). Exploiting query repetition and regularity in an adaptive community-based web search engine. User Modeling and User-Adapted Interaction, 14:383–423. [Teevan et al., 2007] Teevan, J., Adar, E., Jones, R., and Potts, M. A. S. (2007). Infor-mation re-retrieval: repeat queries in yahoo’s logs. In Proc. of the 30th ACM SIGIR Conference on Research and Development in Information Retrieval, pages 151–158. [Tyler and Teevan, 2010] Tyler, S. K. and Teevan, J. (2010). Large scale query log
analysis of re-finding. In 3rd Web Search & Data Mining, pages 191–200.
[Wilkins et al., 2006] Wilkins, P., Ferguson, P., and Smeaton, A. F. (2006). Using score distributions for query-time fusion in multimediaretrieval. In Proc. of the 8th ACM SIGMM International Workshop on Multimedia Information Retrieval, MIR, pages 51–60.
[Wu, 2012] Wu, S. (2012). Linear combination of component results in information retrieval. Data & Knowledge Engineering, 71(1):114–126.
[Wu et al., 2009] Wu, S., Bi, Y., Zeng, X., and Han, L. (2009). Assigning appropriate weights for the linear combination data fusion method in information retrieval. Inf. Process. Manage, 45(4):413–426.
[Zhang and Lu, 2009] Zhang, D. and Lu, J. (2009). What queries are likely to recur in web search? In Proceedings of the 32nd international ACM SIGIR conference on Research and development in information retrieval - SIGIR ’09, pages 827–828. ACM Press.
[Zhao and Callan, 2012] Zhao, L. and Callan, J. (2012). Automatic term mismatch diagnosis for selective query expansion. In Proceedings of the 35th international ACM SIGIR conference on Research and development in information retrieval - SIGIR ’12, page 515, New York, New York, USA. ACM Press.