Any correspondence concerning this service should be sent to the repository administrator:
[email protected]
To link to this article : DOI:10.1016/j.desal.2015.06.023
URL :
http://dx.doi.org/10.1016/j.desal.2015.06.023
This is an author-deposited version published in:
http://oatao.univ-toulouse.fr/
Eprints ID: 17747
O
pen
A
rchive
T
oulouse
A
rchive
O
uverte (
OATAO
)
OATAO is an open access repository that collects the work of Toulouse
researchers and makes it freely available over the web where possible.
To cite this version: Han, Le and Galier, Sylvain and Roux-de Balmann, Hélène
Ion hydration number and electroosmosis during electrodialysis of mixed salt
solution. (2015) Desalination, vol. 373. pp. 38-46. ISSN 0011-9164
Ion hydration number and electro-osmosis during electrodialysis of
mixed salt solution
Le Han, Sylvain Galier, Hélène Roux-de Balmann
⁎
Université de Toulouse, INPT, UPS, Laboratoire de Génie Chimique, F-31062 Toulouse cedex 09, France CNRS, Laboratoire de Génie Chimique, F-31062 Toulouse cedex 09, France
a b s t r a c t
2
Water transfer is an important aspect to be considered in electrodialysis since it fixes the performances of the process. It is due to electro-osmosis, i.e. the water carried by the migrating species and is thus related to their hy-dration. Few results were reported about the hydration number of solutes transferring through ion-exchange membranes. In this work, a methodology is proposed to calculate the hydration numbers of ions transferring through ion exchange membranes during electrodialysis. It is based on the experimental measurements of ion and water transfer under different conditions, like salt compositions and current. Salt hydration is first obtained, and then the hydration numbers of 4 transferring ions (Na+, Mg2+, Cl−, SO
4−) are calculated simultaneously. It is shown that
these hydration numbers are constant, independent from the salt composition and current. The hydration number for monovalent ions is found to be lower than that of divalent ones, which is in agreement with the values of the hydration free energy. Further comparison with the reported values concerning the hydration of the same ions in solution shows that for monovalent ions the hydration numbers are close to those reported for the 1st hydration shell while much higher values are obtained for divalent ions.
1. Introduction
Electrodialysis (ED) is an electrochemical separation process based on the selective transport of ions from one solution to another through ion-exchange membranes (IEM) under the driving force of an electro-chemical potential gradient[1]. It has been extensively used to produce concentrated brines or salt depleted waters for industrial or domestic purposes, such as to produce potable water from sea water since several decades. But water desalination is not the only application. Stimulated by the development of IEM with better selectivity, lower electrical resis-tance, and improved thermal, chemical, and mechanical properties, other uses of ED, especially in food, beverage, drug and chemical process industry as well as in biotechnology and wastewater treatment, have gained a broader interest[2–6].
It is noteworthy that the mass transport through the membrane is the key part of ED process determining to a very large extent its effi-ciency. For the sake of current/energy efficiency, the current is supposed to transfer only the target charged species. However, the ion transfer is always associated with a water transfer that results from a kinetic coupling with the ion fluxes under current, referred as electro-osmosis
[1]. Thus, this electro-osmotic flux can restrict the process efficiency
and its control is thus a key point.
As an example, to scale-up desalination units, the water recovery and energy consumption are the main concerns to be taken into account
[7,8]. Moreover, the water transfer may limit the application of ED as a
concentration process in different application fields[9,10]. For example, in case of coarse salt production from brine, it is crucial to limit the water transfer through the membrane to avoid the dilution of the final
brine solution[11]. Likewise, when ED is to be used as a concentration
step in the production of organic acid from fermentation, it was report-ed that the maximum achievable concentration of organic acid salt is
is an important aspect to be considered in ED process with respect to various uses.
As aforementioned, the water transfer due to electro-osmosis and salt transfer are directly linked in ED. The amount of water accompanying the ions migration is linked to the hydration number of the ions transferring
through the membranes during the ED process[7,12,13]. Then, knowing
the hydration numbers enables predicting the water transfer and so the performance of ED.
Many values can be found in the literature concerning the hydration numbers of different ions in aqueous solution but these values can differ
from each other[14,15]. On the other hand, very few concern the
hydration number of solutes during their transfer through membranes, like those used in ED. The determination of the hydration numbers of ions transferring through a membrane is difficult and requires a specific
procedure. For example ion–H2O–(2H)2O system[16] or complex
computational approach[17]were reported. In fact, knowing both the
salt and the water flux in the system, it is possible to determine the salt hydration number. But a proper dissociation of the salt hydration is further necessary to get the individual contributions of the ions and
this is still problematic[10,13,18,19]. Some simplifications can be
made to split the total water transfer like for instance to assume that
the ions have the same hydration numbers[10]. Finally, the few studies
reported mainly focus on single electrolyte (NaCl) while in practice the solutions treated in ED can be much more complex, probably with multi-components and sometimes not only mixed inorganic salts but also organic matter.
Then, the objective of this paper is to investigate the hydration num-ber of ions transferring through IEM in ED process, since it is a key pa-rameter with respect to the process performance. Experiments will be carried out with different mixtures of salts including Na+, Mg2+, Cl−,
and SO42 −. Based on the determination of the ions and water flux
through the membranes, the hydration numbers of the salts and of the 4 individual ions will be calculated simultaneously. The values will be compared with those obtained from the literature in order to check the methodology and to determine the influence of the membrane on the ion hydration.
2. Theory
2.1. Mass transfer phenomena 2.1.1. Salt transfer
In ED process, the salt flux, js(mol·m−2·s−1), is the sum of two
con-tributions. The first one is a flux coupled with the chemical potential gradient, i.e. a diffusion flux, jdiff, due to the difference of solute's
concen-tration across the membrane and with the direction towards the compartment of decreasing concentration. The other one is the flux coupled with the electrical current, i.e. the migration flux, jmigdue to
the electrical potential gradient[1]. Then the salt transfer is expressed by the following Eq.(1):
js¼ jdiffþ jmig ð1Þ
Previous experimental results have shown that in most of the ED conditions, the diffusion contribution can be neglected compared to
that of migration[5,12]. Furthermore, it was demonstrated that the
mi-gration flux is proportional to the current, so that the following equation
was obtained for the flux by phenomenological approach as Eq.(2),
js≈ jmig¼ αI ð2Þ
using α (mol·m−2·s−1·A−1) as the current coefficient.
2.1.2. Water transfer
The volumetric flux, jV(m3·m−2·s−1), can be obtained from the
volume variation in the compartments during ED. It should be noted that this flux includes the volume contribution of both water and ion transferred, as shown in Eq.(3):
jV¼ jwþ
X
ij i
V ð3Þ
The total ionic volume contribution ∑ijVican be calculated according
to Eq.(4): X ij i V¼ X i ji zi% V i m ð4Þ
with ji(eq·m−2·s−1) the ionic flux, Vmi the molar volume of the ion
(m3·mol−1) and z
ithe valence of the ion (eq·mol−1).
In most ED conditions, like those in this study, the ionic volume contribution is negligible compared to that of water (lesser than 7% of the total volume flux). Therefore, the volume flux can be considered as a water flux, as represented in Eq.(5).
jV≈ jw ð5Þ
As previously described for the ionic flux, the water transfer in ED is the result of two contributions, osmosis (jos) and electro-osmosis (jeo),
as expressed in the following equation:
jw¼ josþ jeo ð6Þ
where the osmotic flux is due to the chemical potential gradient across the membrane, while the electro-osmotic flux is due to the water
trans-fer coupling the ion migration through the membrane[1].
Usually in ED, when an electric current is applied, the water flux due to osmosis can be neglected compared to that of electro-osmosis[5,7,11,12]. And owing to its link to the salt, this flux jeois
also proportional to the current. By introducing an electro-osmotic
coefficient, β (m3·m− 2
·s− 1·A− 1), the expression of the water
transfer can be written as in Eq.(7):
jw≈ jeo¼ βI ð7Þ
2.2. Hydration number calculation
As discussed above, the water transfer (electro-osmotic flux) is linked to the salt transfer in ED. Then, one can calculate the salt
hydra-tion number (nhs), defined as the number of mole of water per mole of
salt, knowing the simultaneous transfer of salt and the associated water, according to Eq.(8):
ns h¼
jw=Vwm
js ð8Þ
where Vmwis the molar volume of water (m3·mol−1).
Combining with Eqs.(2) and (7), this equation can be expressed as
below:
ns h¼
β=Vwm
α ð9Þ
Therefore, the hydration number for each single electrolyte can be calculated from the experimental measurements of the salt and water flux. Indeed, this salt hydration number can be assumed as the total amount of water accompanying the cation and anion migration through
the stoichiometric coefficients for cation and anion, respectively), the following relation can be drawn:
nS CðϑCAϑAÞ
h ¼ ϑCnChþ ϑAnAh ð10Þ
where nhCand nhAare the hydration numbers for cation and anion,
re-spectively. But in order to solve Eq.(10)to get the individual hydration numbers of cation and anion, an additional equation is necessary.
In general, one can calculate the hydration number of a transferring ion, nhi, as: ni h¼ mi w mi ð11Þ
where mi(mol) and mwi(mol) are the number of moles of ion and water
transferred through the membrane.
Assuming that the ion hydration number remains constant over time, this equation can be further expressed as:
ni h¼
mi wð Þt
mið Þt ð12Þ
where the values mi(t), mwi(t) are the transferred quantities (in mole)
for ion and water respectively, from initial beginning of ED until the time t.
However, as previously explained, it is not possible to get the individ-ual values of the water transfer corresponding to each ion, mwi(t), versus
time, but only the total amount of water transferred, mw(t), deduced from
the variation of the volume, which can be expressed by Eq.(13): mwð Þ ¼t
X
im i
wð Þt ð13Þ
Thus, combining Eqs.(12) and (13), one can obtain Eq.(14): mwð Þ ¼t
X
in i
h% mið Þt ð14Þ
The ion hydration numbers are obtained by fitting the value of the
water transfer as obtained by Eq.(14)knowing the experimental values
of the ion transfer mifor each ion with that obtained experimentally.
The least square method is used for that fitting. The ionic hydration numbers are assumed to be constant, regardless of the ion concentra-tion and composiconcentra-tion in mixtures. This assumpconcentra-tion will be further checked.
This theoretical water transfer can be written as a matrix considering the 4 ions (Na+, Mg2+, Cl−, SO
4
2−) used in this study, as seen in Eq.(15):
mw ð Þ ¼ mNa mMg mCl mSO4 " # % nNa h nMgh nCl h nSO4 h 0 B B B B @ 1 C C C C A ð15Þ
The experimental results corresponding to the different salt compositions offer a database for ion and water transfer at each time t during the ED, and thus the 4 ion hydration numbers can be solved simultaneously.
In addition, to solve the matrix and ensure the calculated result rea-sonable, a constraint, i.e. upper and lower limits, of hydration numbers for the 4 ions is required.
In this study, we are dealing with hydration number during ion's migration through IEM. Then, on the one hand, the lower limit corresponds to the case where the ion sheds its waters of hydration, upon sorbing into the polymer, in favor of possible interactions with
the polymer matrix[20,21]. Thus, a value of zero, corresponding to an
unhydrated ion, may be regarded as the lower limit. On the other hand, the upper limit can be considered to be that obtained for the salt hydration number as determined from single electrolyte solutions, since the individual value of an ion, nhi, cannot exceed the value of the
salt hydration number nhsbased on Eq.(10).
Therefore, the constraint for ionic hydration number is seen in
Table 1.
As shown inTable 1, the constraint of hydration number is with the
lower limit as 0, and the upper limit as the higher value of two salt hydra-tion numbers nhsinvolving the same ion (e.g. nNah ≤ maxðnNaClh ; nNah2SO4Þ),
which needs further estimation. This constraint is the input parameter to the experimental database for hydration number calculation.
To sum up, the assumptions used for the calculation of the ion hydration numbers in this study are listed inTable 2.
Hydration number is assumed as cumulative. Ionic hydration num-ber is considered to be not affected by using different current intensities and salt composition as well as concentration.
3. Materials and methods 3.1. ED set-up
The ED experiments were performed with EUR 2B-10 stack (Eurodia, France). The ED stack comprised 10 cells of Neosepta anion-exchange membrane AMX and cation-exchange membrane CMX, from Tokuyama Corp, Japan. For each type of membrane, the total effective area was 0.2 m2, i.e. 0.02 m2per cell. The principal properties of these membranes
AMX and CMX are listed inTable 3.
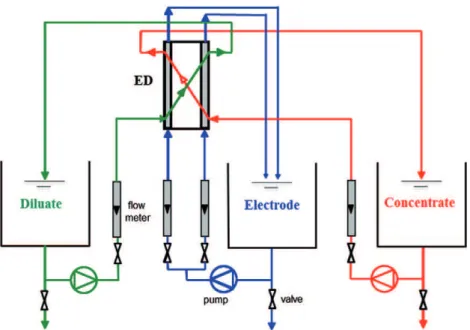
Then, the ED set-up used in this study is depicted inFig. 1. The experiments were carried out in batch mode (complete recycling of diluate, concentrate and electrode solutions). Three centrif-ugal pumps were used to circulate these solutions, and flow meters were used to set the flow rates. The feed flow rates were set at constant
values of 180 L·h−1for the diluate and concentrate, and 360 L·h−1for
Table 1
Ionic hydration number constraint for calculation.
nhi Na+ Mg2+ Cl− SO42−
Lower limit 0 0 0 0
Upper limit maxðnNaCl h ; n Na2SO4 h Þ maxðn MgCl2 h ; n MgSO4 h Þ maxðnNaClh ; n MgCl2 h Þ maxðn Na2SO4 h ; n MgSO4 h Þ Table 3
Principal properties of ion-exchange membranes.
Membrane property AMX CMX
Exchange capacity (meq·g−1) 1.4–1.7 1.5–1.8 Specific resistance (Ω·cm−1) 2.0–3.5 2.0–3.5
Permselectivity (%) 0.98 0.98
Water content (%) 25–30[22] 25–30[23]
pH 0–12 0–12
Functional group Ammonium quaternary Sulfonic acid Thickness (mm) 0.16–0.18 0.17–0.19 Cross linker Divinyl benzene Divinyl benzene Table 2
Calculation assumptions.
Negligible ionic volume Cumulative volume/hydration Constant nhi jV≈ jw mw= ∑imwi(t) nhi= constant nSðCϑCAϑAÞ h ¼ ϑCnChþ ϑAnAh 0 ≤ nh i≤ n h s
the electrode solution. All the experiments were carried out at constant temperature 25 ± 1 °C. The experiment duration was determined according to the conductivity of the diluate. Experiments were stopped
once that conductivity reached about 5 mS·cm−1in order to have
current lower than the limiting current for any set of experiments. Experiments were performed at a constant current, in the range of
0–6 A (0–300 A·m−2), with solution conductivities, temperature, pH
and voltage measured in real time. The solutes concentration and the volume were determined in both compartments as function of time.
Different sets of experiments were carried out, with each one corresponding to a given electrolyte solution (S1 to S10 inTable 4). For each experiment set, the membranes were first soaked in 4 L of the electrolyte solution by running the set-up for about 4 h at a flow rate of
180 L·h−1and then stopping at least 10 h without circulation. This
soaking solution was exactly the same electrolytic solution as that used in ED. Since the quantity of ions in these solutions is about 40 times higher than the total ion-exchange capacity of AMX and CMX membranes in the ED stack, one can consider that this procedure ensures a complete exchange of the membrane counter ion, thus a fully equilibrated IEM. 3.2. Salts and ions
Four different electrolytes were selected and used in the ED experi-ments, making salt solutions of single electrolyte and mixed ones (2 or 3 electrolytes) as shown inTable 4.
Ten solutions of different compositions were prepared according to
Table 4, namely S1–S10. The total salt concentration in this study was
fixed at 1 eq·L− 1except for S10 (0.87 eq·L−1). Single salt solutions
(solution S1–S4) were used for the determination of the salt hydration number. Mixed salt solutions (solution S5–S9) were used to calculate the individual ion hydration numbers. Finally, S10 was an artificial
seawater reverse osmosis concentrate (SROC), prepared according to the standard method (ASTM D 1141–86) for artificial sea water preparation.
Both concentrate and diluate compartments were initially fed with 2 L of salt solution at the given composition. The electrode compartment was initially fed with 3 L of a Na2SO4solution at 10 g·L−1. All the salts
(Acros Organics) were dissolved in RO water (resistivity N1 MΩ·cm, Elga, France) to get the proper solution composition.
3.3. Analytical and computational methods
For single electrolyte, the salt/ion concentration was determined from conductivity measurements, using a conductivity meter (HI933100, Hanna Instruments). For mixed electrolyte solutions (containing more than two ions) the concentrations of ions were determined by ionic chromatography. Ion chromatography system (ICS-3000, Dionex, France) was using an ionPac column, equipped with an auto sampler AS50 and conductivity detector CD20. The injection volume was 25 μL and the temperature was set at 30 °C. Samples were diluted to a maxi-mum of 1000-folds by ultra-pure water (resistivity N18 MΩ·cm, Elga, France) before analysis.
In this study, the mass balance for water and ions was checked, knowing the variation of the volume and concentrations in the 2 compartments. The maximum deviation was less than 2% for volume and 5% for salt/ions.
The fitted values of the hydration numbers were obtained using an open access software Rstudio (RStudio Inc, Version 3.0), based on a nonlinear regression method.
4. Results and discussions 4.1. Hydration number of salts
An example of the variations of the salt and water quantities transferred versus time in the case of single electrolyte is shown in
Fig. 2for different current intensities.
Fig. 2shows a simultaneous increase of both salt (a) and water
(b) quantities transferred versus time from the diluate to the concen-trate compartment. And according to mass balance, a decrease trend of salt and water quantities in diluate compartment was found.
One can also observe inFig. 2that the transfer increases with the
current intensity (2–6 A). For each current, there is a linear variation
Fig. 1. Schematic diagram of the electrodialysis set-up.
Table 4
Composition and concentration of the salt solutions used in ED experiments.
Salt Single salts (eq·L−1) Mixed salts (eq·L−1) S1 S2 S3 S4 S5 S6 S7 S8 S9 S10 NaCl 1 0.5 0.5 0.33 0.63 Na2SO4 1 0.5 0.5 0.33 0.08 MgCl2 1 0.5 0.5 0.33 0.16 MgSO4 1 0.5 0.5
of the salt and water transfer over time, which is in agreement with
previous results[5,11,12,24]. Then the corresponding slopes provide
the salt and water flux densities, the values of which are plotted in
Fig. 3versus the current, with S1 as example.
Fig. 3demonstrates that the flux densities for both salt and water are
proportional to the current. This confirms that under current, migration and electro-osmosis fix the salt and water transfer respectively, i.e. that the contribution of diffusion to the salt flux as well as that of osmosis to the water flux are negligible[5].
Then, according to Eqs.(2) and (7), the aforementioned coefficients
αand β can be estimated from the linear variation of the salt and water
transfer versus current, based on the corresponding slope. The salt hydration number can also be calculated based on these two coefficients
according to Eq.(9). The results obtained for the different salts are
reported inTable 5.
The following trend for the salt hydration numbers of the 4 electro-lytes is obtained: nNaCl h b nNah2SO4≈ n MgSO4 h b n MgCl2 h :
These results can be compared with the ones obtained from experi-mental studies previously reported in the literature. For instance, the hy-dration number of NaCl is found to be 14 in this study. This is close the
values of 11, 11.4 and 13 reported in comparable conditions[18,8,16].
However, much lower values like a hydration number as low as 5 were also reported but in different conditions[19,25]. This will be discussed later into more details. Concerning Na2SO4,the value of 26.1 obtained in
this work is very close to that, equal to 26, previously reported[18]. No
value was reported for MgCl2. However, Mg2+is known to be more
hy-drated than Ca2+[15]and a value of 29 was reported for the hydration
number of CaCl2[16]. Then the value of 31 obtained in the present work
seems to be in agreement with the one that can be expected. Finally, one can conclude that the values obtained in the present work are in good agreement with the ones previously reported in comparable conditions.
Knowing the salt hydration number (nhs), the upper limit of the ion
hydration number can be fixed, as previously explained (seeTable 1).
Then the range of values is reported inTable 6. 4.2. Hydration number of ions
The transfer of water and ions versus time obtained under different currents in mixed electrolytes (containing at least 3 different ions) is shown inFig. 4, with solution S5 (NaCl–Na2SO4case, 3 ions included)
as example.
For any current, one can observe a linear increase of the water transferred versus time, as observed in the case of single electrolyte.
The transfer of Na+varies also in a linear manner versus time. On the
contrary, the transfer of the individual anions, Cl−and SO 4
2−does not
Fig. 2. Variation of the salt transfer (a) and water transfer (b) under different current intensities (2-6A) versus time, e.g. solution S1 (C for concentrate, D for diluate).
follow a linear trend. A selectivity between the anions is thus
empha-sized, as already reported with the same membranes[26]. Finally, in
this study, only the anion selectivity was observed (solution S5, S8, S9,
S10) while there was no such phenomenon for cations (Na+and Mg2+).
In fact, for the calculation of the ion hydration number, mass transfer data under 4 different currents in all these experiments are mixed as an overall database. One can arrange all these data as function of the electrical charge (i.e. the product of current with time, as quantity of coulomb given to ED stack)[9].Fig. 5illustrates these transfer variations versus the electrical charge.
Fig. 5(a) shows that the mass transfer data obtained under different
currents are located on a single curve when plotted as function of the electrical charge, for Na+, Cl−and SO
4
2−respectively. Likewise, in
Fig. 5(b), one can observe that the water transfer is directly related to
the electrical charge.
Moreover, it should be noted that although NaCl and Na2SO4have
variable composition ratio versus the electrical charge, because of the anion selectivity, and their hydration numbers are different (as seen in
Table 5), no visible influence is observed on the water transfer once
considering the electrical charge. Indeed, salt hydration numbers in
Table 5indicate that for an electrical driving charge of 1 equivalent,
the number of moles for water transfered with NaCl is 14 while it is 13 (26/2) for Na2SO4.
Finally, following the method explained inSection 2.2, it is possible to get the values of the ion hydration numbers knowing the values of the water and ion transfer determined experimentally. The fitted values obtained for the 4 ions investigated are reported inTable 7.
The validation of the result is checked by comparing the calculated
water transfer obtained according to Eq.(14)considering the hydration
numbers reported inTable 7, with the experimental one. For any
condition (S1–S9), the difference does not exceed 7%.
To further check the robustness of the method and the values of the hydration numbers, another solution, S10, with a different ionic
composition is used. On the one hand, the experimental values of the
ion and water transfer are plotted inFig. 6(a) versus the electrical
charge. On the other hand, the water transfer, mwtheo, is calculated using
the ion transfer and the values of the hydration numbers previously de-termined. The obtained values are reported inFig. 6(b). One can observe that there is a good agreement between these calculated values and the experimental ones (relative difference ca. 3%).
It means that in the conditions of this study for a salt concentration
up to 1 eq·L−1, the hydration numbers of the individual ions do not
change with the ionic composition or with the current intensity. 4.3. Discussion
It is further interesting to compare the ion hydration numbers obtained in this study with those reported in the literature. However, it is important to keep in mind that the literature values concern the hy-dration number of the ions in solution, while those obtained in this study are related to the ions transferring through the membranes. One can expect the hydration of the transferring ions to be lower than that in the solution.
Fig. 7provides the values reported in the literature for the hydration
number for each ion investigated in this work. More precisely, the plot shows the frequency distribution of the different values reported in the literature, concerning the 1st hydration shell, i.e. that in which the water molecules interact directly and strongly with the ion. The values of the hydration numbers obtained in this work are also indicated on the graph for comparison.
Fig. 7shows a broad distribution of the reported values for each ion,
3 to 9 for Na+, 4 to 12 for Mg2+, 2 to 10 for Cl−and 3 to 15 for SO 4 2−. As
already mentioned, this broad distribution comes from the different methods (experimental and computational ones based on various as-sumptions on the ion structure and water dynamic) used to get the
hy-dration number[14,15]. Nevertheless, for any ion, the distribution
shows a maximum, corresponding to the most frequently reported
value. Then the hydration number for Na+is about 6–7, a value similar
to that for Mg2+
(6–7). For the anions, the hydration number of Cl−is
6–9, while it is around 8 for SO42−.
The values obtained in this work can be further compared to the
ones reported. For monovalent ions (Na+, Cl−), one can observe that
the hydration number of the transferring ion obtained in this work is not only within the reported 1st shell distribution but also quite close to the most frequent value of the considered ion. On the contrary, the values obtained for divalent ions are higher than the most frequently re-ported values. In the case of SO42−it is close to the highest value
report-ed in the literature for the 1st hydration shell, about 15. For Mg2+it is
still higher, around 16 while the highest reported value is around 12. Other ionic characteristics, like ion charge density and hydration free energy for instance, are also interesting to characterize the ion hydra-tion. For instance, the hydration energy represents the strength of the bound between the ion and its surrounding water. Then it can probably
Table 5
Transfer coefficient of salt (α), water (β) and salt hydration number (nhs).
Salt NaCl Na2SO4 MgCl2 MgSO4
α (×10−4mol·m−2·s−1·A−1) 4.60 2.38 2.46 2.93 β (×10−7m3·m−2·s−1·A−1) 1.16 1.12 1.36 1.37 nhs
(mol water/mol salt)
14.0 26.1 30.8 26.0
Table 6
Input ion hydration number constraint.
nhi Na+ Mg2+ Cl− SO42−
Constraint 0–27 0–31 0–31 0–27
be linked to the variation of the hydration number of the ion while
transferring through the membrane[27,28]. The values are reported in
Table 8for the 4 ions considered in this study.
One can state that the hydration free energy of divalent ions, and thus the bonding strength of water and ion, is stronger compared to that of monovalent ones (3–5 times for anion and cation, respectively).
In particular, the fact that Mg2+has the highest value may also agree
with its highest hydration energy among the considered ions. Meanwhile, the fact that these transferring hydration numbers of monovalent ions approximate the values corresponding to the 1st hydration shell has to be pointed out. It means that in the conditions in-vestigated, the water contained in the 1st hydration shell is transferred together with the ion through the membranes. But it also suggests that while transferring through the membranes, the ions are dehydrated, losing the water contained in their 2nd hydration shell. It is accepted that the 2nd shell's water molecules are weakly bonded and can more easily be reoriented and/or detached when ion is in motion, even in
aqueous solution, compared with the 1st shell[15,29]. The very few
data available regarding the 2nd hydration shell of ions can also be attributed to its weak strength and a consequently not well-defined hydration structure[14].
Concerning divalent ions, it is shown that the hydration number of the transferring ions is higher than the most frequent value corresponding to
the 1st hydration shell. Especially for Mg2+the hydration number of the
transferring ion is about 15–16, while the only reported value of hydra-tion number of the 2nd hydrahydra-tion shell is about 12[14], that of the first hydration shell ranging from 4 to 12 with the most frequent value
about 6–7. Then, the results show that the Mg2+transferring through
the membrane carries more water than that comprised in its 1st hydra-tion shell, i.e. also part of the water in its 2nd hydrahydra-tion shell.
These results show that the membranes used in this study have no significant influence on the hydration of the transferring ions, at least on their first hydration shell. It means that the water–ion interactions are dominant with respect to membrane–ion interactions. In fact, there is hypothesis that transfer through membrane depends on the comparison of ‘transport energy’ and the hydration energy that bonds
the hydrated shell to the ion[30]. In ED, the ion migrates towards the
membrane with current as driving force; the polymer matrix of the ion exchange membrane may interact with the ion and serve as barrier to the ion transfer. Thus, one can imagine that with stronger mem-brane–ion interaction, stronger dehydration of the ions may happen.
As a result, lower hydration numbers can be expected[10,17,19,29].
In-deed, lower salt hydration number of NaCl (4.5[10]and 3.5[19]) have
been sometimes reported, compared with that (equal to 14) obtained in this study. Further comparison shows that the membranes used in these previous studies were selective IEM membranes for which lower
electro-osmotic flux was observed[8]. As a result, the hydration number
of the migrating ions, directly linked to the electro-osmotic flux as indi-cated in the present work, was lower.
Overall, attention should be paid to hydration of ions that fixes electro-osmosis and thus the performances of ED. The present work shows that mass transfer prediction in ED is possible knowing hydration
Fig. 5. Variation of the ion transfer (a) and water transfer (b) versus electrical charge, e.g. solution S5; symbol of different filling in (a) indicating under different current as 2A (blank), 3A (cross), 4A (right solid), 6A (left solid).
Table 7
Calculated values of the ion hydration number nhi.
Na+ Mg2+ Cl−
SO42−
6 15–16 8 13–14
Fig. 6. Variation of the ion transfer (a) and the theoretical and experimental water transfer (b) versus electrical charge in solution S10; symbol of different filling in (a) indicating under different current as 2A (blank), 3A (cross), 4A (right solid), 6A (left solid).
number of ions, as shown inFig. 6, which can be significant for process control, considering different kinds of applications like purification of fermentation broth or desalination/concentration of brines[12]. 5. Conclusions
The aim of this work was to investigate the transfer of salt and water during ED. The objective was to determine the water transfer due to electro-osmosis and the hydration number of ions transferring through IEM, since it is a key parameter with respect to the process performance. A methodology was proposed to calculate these ion hydration num-bers. It was based on the experimental measurements of ion and water transfer under different conditions, like salt composition and concentra-tion and current. Salt hydraconcentra-tion was first obtained, and then the individ-ual hydration numbers of 4 transferring ions (Na+, Mg2+, Cl−, SO
4 2−)
were calculated simultaneously. It was shown that, in the conditions
investigated, these hydration numbers are constant, independent from the salt composition and current. The hydration number for monovalent ion was found to be lower than that of divalent one, for cation and anion respectively. This is in agreement with the values of the hydration free energy, characterizing the strength of bond between the ion and its surrounding water. Further comparison with the reported values concerning the hydration of the same ions in solution demonstrated that for monovalent ions the hydration numbers are close to those re-ported for the 1st hydration shell while much higher values are obtain-ed for divalent ions.
Future work will be devoted to the study of membrane–solute– water interactions with a focus on hydration mechanisms. This will be carried using computational as well as experimental approach. Regard-ing the process performances, further work is necessary to consider more complex solutions closer to applications, containing both mixed salts and organic compounds.
Nomenclature List of symbols
js salt flux (mol·m−2·s−1)
ji ion flux (eq·m−2·s−1)
jV volumetric flux (m3·m−2·s−1)
jw water flux (m3·m−2·s−1)
mi number of mole transferred for ion (mol)
mw number of mole transferred for water (mol)
Fig. 7. Frequency distribution histogram of ion hydration number within 1st shell from literature[14,15](each value based on different methodology but same electrolyte as in this study; arrows indicating the values obtained in this study).
Table 8
Calculated ion hydration number in this study and some other ionic characteristics.
Parameter Na+ Mg2+ Cl−
SO42− Reference Molar mass (g·mol−1) 23 24 35.5 96
Valence (eq·mol−1) 1 2 −1 −2 Hydration free energy
(kJ·mol−1)
−375 −1838 −347 −1090 [15]
Hydration number (mol water/mol ion)
nhi ion hydration number, (mol water/mol ion)
nhs salt hydration number, (mol water/mol salt)
Vmi ion molar volume (m3·mol−1)
Vmw water molar volume (1.8 × 10⁻⁵m3·mol−1)
z valence (eq·mol−1)
I current intensity (A)
Greek symbols
α current coefficient (eq·m−2·s−1·A−1)
β electro-osmotic coefficient (m3·m−2·s−1·A−1)
Superscripts & subscripts
A anion
C cation
diff diffusion
eo electro-osmosis
exp experimental data
h hydration
i ion
mig migration
s salt
t experiment time
theo theoretical data
w water
Acknowledgments
The authors would like to acknowledge the support provided by the China Scholarship Council (CSC), Ministry of Education, P. R. China to the PhD student (Le Han).
References
[1] H. Strathmann, Ion-Exchange Membrane Separation Processes, Elsevier Science, Stuttgart, 2004.
[2] H. Strathmann, Electrodialysis, a mature technology with a multitude of new applications, Desalination 264 (2010) 268–288.
[3] C. Huang, T. Xu, Y. Zhang, Y. Xue, G. Chen, Application of electrodialysis to the production of organic acids: state-of-the-art and recent developments, J. Membr. Sci. 288 (2007) 1–12.
[4] C. Abels, F. Carstensen, M. Wessling, Membrane processes in biorefinery applica-tions, J. Membr. Sci. 444 (2013) 285–317.
[5] F.J. Borges, H. Roux-de Balmann, R. Guardani, Investigation of the mass transfer processes during the desalination of water containing phenol and sodium chloride by electrodialysis, J. Membr. Sci. 325 (2008) 130–138.
[6] Y. Zhang, K. Ghyselbrecht, B. Meesschaert, L. Pinoy, B. Van der Bruggen, Electrodialysis on RO concentrate to improve water recovery in wastewater reclamation, J. Membr. Sci. 378 (2011) 101–110.
[7] A.H. Galama, M. Saakes, H. Bruning, H.H.M. Rijnaarts, J.W. Post, Seawater predesalination with electrodialysis, Desalination 342 (2013) 61–69.
[8] W. Walker, Y. Kim, D. Lawler, Treatment of model inland brackish groundwater reverse osmosis concentrate with electrodialysis — Part II: sensitivity to voltage application and membranes, Desalination 345 (2014) 128–135.
[9]M. Fidaleo, M. Moresi, Electrodialytic desalting of model concentrated NaCl brines as such or enriched with a non-electrolyte osmotic component, J. Membr. Sci. 367 (2011) 220–232.
[10] T. Rottiers, K. Ghyselbrecht, B. Meesschaert, B. Van der Bruggen, L. Pinoy, Influence of the type of anion membrane on solvent flux and back diffusion in electrodialysis of concentrated NaCl solutions, Chem. Eng. Sci. 113 (2014) 95–100.
[11] C. Jiang, Y. Wang, Z. Zhang, T. Xu, Electrodialysis of concentrated brine from RO plant to produce coarse salt and freshwater, J. Membr. Sci. 450 (2014) 323–330.
[12] M. Bailly, H. Roux-de Balmann, P. Aimar, F. Lutin, M. Cheryan, Production processes of fermented organic acids targeted around membrane operations: design of the concentration step by conventional electrodialysis, J. Membr. Sci. (2001) 129–142.
[13] N.P. Berezina, N.A. Kononenko, O.A. Dyomina, N.P. Gnusin, Characterization of ion-exchange membrane materials: properties vs structure, Adv. Colloid Interf. Sci. 139 (2008) 3–28.
[14] H. Ohtaki, T. Radnai, Structure and dynamics of hydrated ions, Chem. Rev. 93 (1993) 1157–1204.
[15] Y. Marcus, Ion Properties, Marcel Deeker, INC., New York, 1997.
[16] A.J. Rutgers, Y. Hendrikx, Ionic hydration, Trans. Faraday Soc. 58 (1962) 2184–2191.
[17] L.A. Richards, A.I. Schäfer, B.S. Richards, B. Corry, The importance of dehydration in determining ion transport in narrow pores, Small 8 (2012) 1701–1709.
[18] E. Singlande, Integrated Process Coupling Electrodialysis and Upstream Biological Treatment: Influence of the Ionic Composition and Application to the Treatment of Salted Liquid Wastes(Ph.D. Thesis) Université Paul Sabatier, 2006.
[19] H.Y. Lu, C.S. Lin, S.C. Lee, M.H. Ku, J.P. Hsu, S. Tseng, et al., In situ measuring osmosis effect of Selemion CMV/ASV module during ED process of concentrated brine from DSW, Desalination 279 (2011) 278–284.
[20] G.M. Geise, D.R. Paul, B.D. Freeman, Fundamental water and salt transport properties of polymeric materials, Prog. Polym. Sci. 39 (2014) 1–42.
[21] D.A. Doyle, J.M. Cabral, R.A. Pfuetzner, A. Kuo, J.M. Gulbis, The structure of the potassium channel: molecular basis of K+ conduction and selectivity, Science 280 (1998) 69–77.
[22] A. Elattar, A. Elmidaoui, N. Pismenskaia, C. Gavach, G. Pourcelly, Comparison of transport properties of monovalent anions through anion-exchange membranes, J. Membr. Sci. 143 (1998) 249–261.
[23] J.H. Choi, H.J. Lee, S.H. Moon, Effects of electrolytes on the transport phenomena in a cation-exchange membrane, J. Colloid Interface Sci. 238 (2001) 188–195.
[24] S. Galier, H. Roux-de Balmann, Demineralization of glucose solutions by electrodialysis: influence of the ionic composition on the mass transfer and process performances, Can. J. Chem. Eng. 93 (2015) 378–385.
[25] K. Ghyselbrecht, A. Silva, B. Van der Bruggen, K. Boussu, B. Meesschaert, L. Pinoy, Desalination feasibility study of an industrial NaCl stream by bipolar membrane electrodialysis, J. Environ. Manag. 140 (2014) 69–75.
[26] A.H. Galama, G. Daubaras, O.S. Burheim, H.H.M. Rijnaarts, J.W. Post, Seawater electrodialysis with preferential removal of divalent ions, J. Membr. Sci. 452 (2013) 219–228.
[27] J. Havel, E. Högfeldt, Evaluation of water sorption equilibrium data on Dowex ion exchanger using WSLET-MINUIT program, Scr. Fac. Sci. Masaryk Univ. 25 (1995) 73–84.
[28] B. Tansel, Significance of thermodynamic and physical characteristics on permeation of ions during membrane separation: hydrated radius, hydration free energy and viscous effects, Sep. Purif. Technol. 86 (2012) 119–126.
[29] R. Rautenbach, R. Albrecht, Membrane Processes, Wiley, 1989.
[30] L.J. Banasiak, A.I. Schäfer, Removal of boron, fluoride and nitrate by electrodialysis in the presence of organic matter, J. Membr. Sci. 334 (2009) 101–109.


![Fig. 7. Frequency distribution histogram of ion hydration number within 1st shell from literature [14,15] (each value based on different methodology but same electrolyte as in this study; arrows indicating the values obtained in this study).](https://thumb-eu.123doks.com/thumbv2/123doknet/3212589.91859/9.892.175.732.107.681/frequency-distribution-hydration-literature-different-methodology-electrolyte-indicating.webp)