O
pen
A
rchive
T
OULOUSE
A
rchive
O
uverte (
OATAO
)
OATAO is an open access repository that collects the work of Toulouse researchers and
makes it freely available over the web where possible.
This is an author-deposited version published in:
http://oatao.univ-toulouse.fr/
Eprints ID : 18392
To link to this article : DOI:10.1016/j.egypro.2017.03.1573
URL :
http://doi.org/10.1016/j.egypro.2017.03.1573
To cite this version :
Loschetter, Annick and De Lary De Latour, Louis and Grandia,
Fidel and Powaga, Emilie and Colignan, Bernard and Marcoux,
Manuel and Davarzani, Hossein and Bouc, Olivier and Le Guenan,
Thomas Assessment of CO2 Health Risk in Indoor Air Following a
Leakage from a Geological Storage: Results from the First
Representative Scale Experiment. (2017) Energy Procedia, vol. 114.
pp. 4287-4302. ISSN 1876-6102
Any correspondence concerning this service should be sent to the repository
administrator:
[email protected]
13th International Conference on Greenhouse Gas Control Technologies, GHGT-13, 14-18
November 2016, Lausanne, Switzerland
Assessment of CO
2
health risk in indoor air following a leakage
from a geological storage: results from the first representative scale
experiment
LOSCHETTER Annick
a*, DE LARY DE LATOUR Louis
a, GRANDIA Fidel
b,
POWAGA Emilie
c, COLLIGNAN Bernard
c, MARCOUX Manuel
d, DAVARZANI
Hossein
a, BOUC Olivier
a, LE GUENAN Thomas
aaBRGM, 3 Avenue Claude Guillemin, 45060 Orléans, France bAmphos 21, Paseo de García Faria, 49-51, 08019 Barcelona, Spain cCSTB, 24 Rue Joseph Fourier, 38400 Saint-Martin d'Hères, France dIMFT, 2 Allée du Professeur Camille Soula, 31400 TOULOUSE, France
Abstract
If a leakage of CO2out of a geological reservoir were to happen and to reach the vadose zone below a building, CO2
could migrate through the vadose and the building’s slab and accumulate in the building, leading to possible acute risk for the inhabitants. A representative-scale experiment, including a prototype for a building, was developed to better understand and quantify this possible risk. It brought fruitful directions for further modeling work, since unexplained CO2 peaks were observed in the prototype. Numerical simulations were carried out to address the
variability of CO2concentrations considering the influence of soil and building properties as well as meteorological
conditions, with promising results for risk analysis.
Keywords:CO2geological storage; leakage; intrusion; indoor exposure; risk for humans; exposure; experiment; modeling; risk analysis
*
Corresponding author. Tel.: +33 (0)2 38 64 38 22
1. Introduction
Leakage of CO2 from geological reservoirs is one of the most fearsome unexpected scenarios for CO2 storage
activities (e.g. [1]). If a leakage reaches the ground level, exposure to high CO2 concentrations is more likely to
occur in low ventilated spaces (pit dug in the ground, basement, building) where CO2 could accumulate to high
concentrations [2]. Significant literature and models about indoor exposure resulting from intrusion of soils gases in building are available in several domains (e.g., contaminated soils, radon, etc.)[3]. However, these approaches may not be appropriate for the assessment of consequences of CO2 leakage, due to the specificity of CO2 and to the
singularities of the source in case of leakage from anthropic reservoirs. Furthermore, another singularity compared to many conventional approaches is that the risk due to CO2 exposure should be evaluated considering acute
concentrations in addition to evaluation of long term exposure to low concentrations [4]. It should be noted that CO2
is a naturally occurring gas which exists in ambient air in low proportion (about 0.038% in volume or 380 ppm). It is harmless and even essential to life at low concentration, but it can become hazardous or even lethal at high concentration. The “15 min Short-Term Exposure Limit Level” of 3% used in the United States [5] gives an order of magnitude for potentially hazardous exposure. Thus, a specific approach is needed to enable a quantitative assessment of the risk for health and living in indoor environment in case of leakage from a reservoir reaching the unsaturated zone below the buildings. Some attempts were achieved by Stenhouse et al. [6] who proposed a basic conceptual model where CO2 migrates from the wellhead to the dwelling without any attenuation or resistance
during the transport via the upper soil layers or the foundation of the building. De Lary et al. [4] then proposed a refined approach that took into account attenuation by the unsaturated zone and the basements. This work showed that important parameters controlling the risk level in buildings are: the leakage flow rate, the thickness of the unsaturated zone, the permeability of the unsaturated zone, the building ventilation rate, the air permeability of the building slab. However, that study lacked of a validation by comparison to field experiments. Moreover, average static meteorological conditions and ventilation rate were assumed in simulations. This may compromise conservative risk analysis since acute exposure may be related to situations that deviate from average conditions. In this context, the IMPACT-CO2 project (funded by ADEME and conducted by BRGM, CSTB, Amphos 21 and
IMFT) aimed at understanding the possible migration of CO2to indoor environment and to refine knowledge and
approaches for risk analysis. To achieve this goal, one of the main objectives of the project was to carry out a representative experiment. The aim of the experiment was to provide experimental data in order to discuss and validate models, and potentially to highlight influential phenomena. Once better understood, models can be used to further investigate potential risks. An important challenge is to discriminate among the very large number of phenomena (and associated parameters) the most influential ones that may lead to adverse situations for human health.
The paper first defines the scenarios for risk assessment (section 2), then presents the experiment and associated modeling (section 3), the numerical modeling in view of risk analysis (section 4), and ends with a discussion of the results and conclusion (section 5).
2. Defining scenarios for risk assessment
The objective of this preliminary task was to define scenarios that could be representative of leakage near the soil surface from deep storage sites. Recent projects have already determined leakage scenarios close to ground level (e.g. FP7 RISCS [7]). Nevertheless, those scenarios are often not focused on the impacts at ground level or do not bring enough details about the impacts on indoor air. Thus, we decided to define a list of appropriate scenarios for the IMPACT-CO2 project based on existing knowledge.
Defining leakage scenarios at ground level is rather difficult mainly because experience feedback in the field of CCS (Carbon Capture and Storage) is very limited due to the few sites in operation. To enable the determination of scenarios we reviewed the state of the art regarding: 1) leakages from natural and industrial analogues; 2) modeling of transfers in the geological media and in the unsaturated zone; 3) CO2injection experiments in the near surface.
This review highlighted the very wide variability of leakage situations and possible flow rates. This led to select a very wide range of parameters in order to take into account the variability of the possible leakage situations. The proposed scenarios investigated are presented in Table 1.
The project focused on the downstream part of the scenario, without trying to relate it to causes of the CO2release.
In fact, due to the complexity and the great number of possible situations, each cause (ex: leakage from well, fault, permeable zone) could lead to a wide range of leakage configurations in the shallow subsurface.
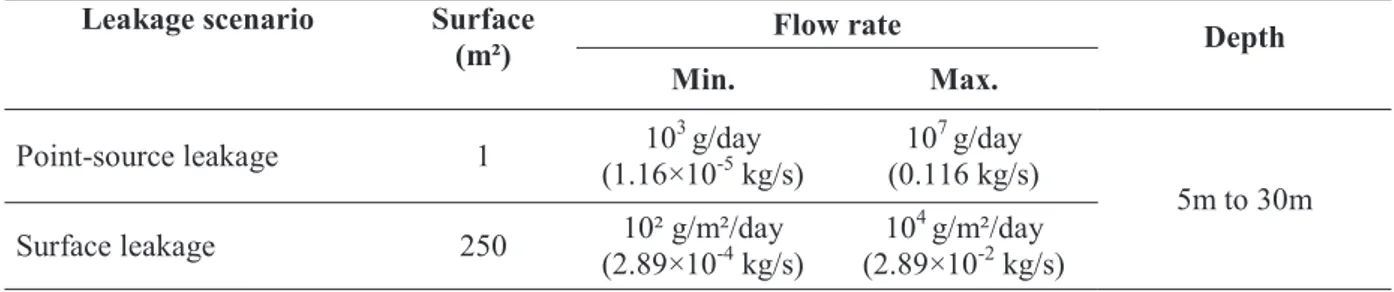
Table 1 – Scenarios of special interest for health risk assessment in case of unexpected leakage from a geological reservoir
Leakage scenario Surface
(m²)
Flow rate Depth
Min. Max. Point-source leakage 1 10 3 g/day (1.16×10⁻⁵kg/s) 107g/day (0.116 kg/s) 5m to 30m
Surface leakage 250 10² g/m²/day
(2.89×10⁻⁴kg/s)
104g/m²/day (2.89×10⁻²kg/s)
3. Presentation of the experiment and associated modeling
The experiment was designed as injection tests at representative scale to study the resulting concentration in a prototype figuring a building. Its aim was to record the main phenomena controlling the migration of CO2through
the unsaturated zone, and its intrusion and accumulation in buildings. The experimental results were also used to assess models. The experimental set-up is not intended to be used to investigate the whole range of scenarios afore-introduced. It enables to inform models that are then used to perform sensitivity analysis. The experiment is not at real-scale but representative-scale. It is intermediate between a fully-controlled laboratory experiment and on-field observations in a complex environment. This compromise is intended to facilitate understanding without eliminating phenomena.
Experimental set-up
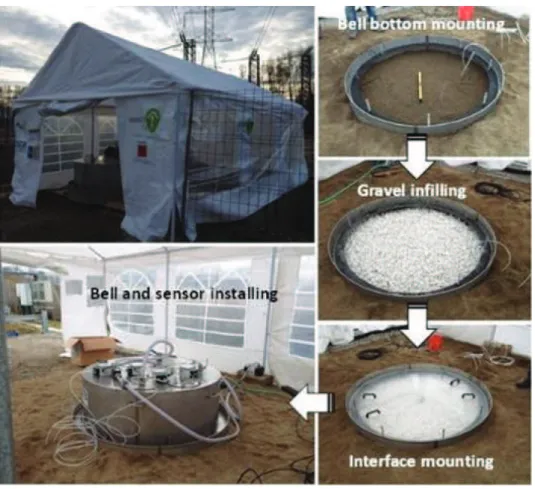
The experiment was performed in one cell of the PISCO2 facilities in the ES.CO2 center in Ponferrada (León
province, Spain). These facilities consist of a set of 18 experimental units or basins in which fluxes of CO2(from 1.0
to 60 L·h-1) are injected to monitor environmental impacts on surface and vadose zone (
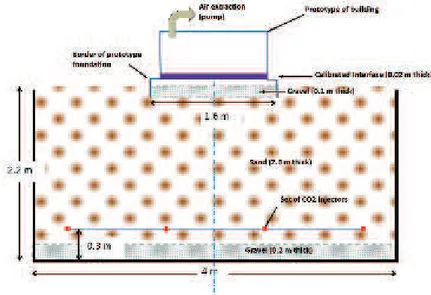
Figure 1 and Figure 2). Each experimental basin consists of an infilling of sand and gravel, and is outlined by concrete. A gravel layer (0.2 m thick) is deposited at the bottom of the cell to preserve liquid flow drainage in order to maintain an unsaturated zone in the upper layers. A layer of coarse sand (2 m thick) overlies the gravel and represents the unsaturated horizon. The average grain size of the coarse sand is 3 mm, and it is quite homogeneous. The intrinsic permeability of the sand measured in laboratory is 1× 10⁻¹⁰ m². CO2is injected through a grid with 16
pinholes located at 2 m depth in the sand (Figure 2). The flux is set to 60 L·h-1for all our experiments.
The cell can optionally be filled with water through watering/raining from surface and controlled by a drainage system. The water table in the IMPACT-CO2experiments was set well below the injection level.
The gas accumulation experiments were performed using a metallic container of cylindrical shape, representative of a building (called “prototype”). The prototype consists of several components: a support (representative of the building foothold), a “bell” that represents the building itself, a gravel layer and an interface that are representative of the building basements (Figure 2). The bell was mounted on a 10 cm-thick gravel layer. This gravel layer was set into an excavation in the sand, and it is made of quartz so that it is not reactive with CO2and water. It covers the
extension corresponding to the diameter of the bell and it is limited by the support. Over the gravel layer, an interface (2 cm thick) is mounted onto the support. This interface has a permeability equivalent to that expected in a real building with rather degraded foundation.
The basin and the bell system were covered by a tent to prevent raining and limit wind impact.
The prototype has a volume of ca. 0.770 m3and has a number of air entries (valves) on the top. Indoor air can be pumped out from an outlet tube connected to a pump in order to impose a fixed ventilation rate and a depressurization in the prototype, mimicking a building.
In order to monitor the CO2concentration and the pressure, temperature and relative humidity, a number of sensors
were installed inside/outside the bell and in the basin.
Preliminary tests were performed to verify the functioning of the whole device and determine the in situ permeability of the basin and the interface (about 10-10m²).
Figure 1 - View of the experimental set-up in the PISCO2facilities at Ponferrada. The sequence of pictures on right represents the installation of
Figure 2- Scheme of the experimental set-up
Experimental results
Several sets of experiments of CO2 injection were performed: first a set of three short-term experiments to test the
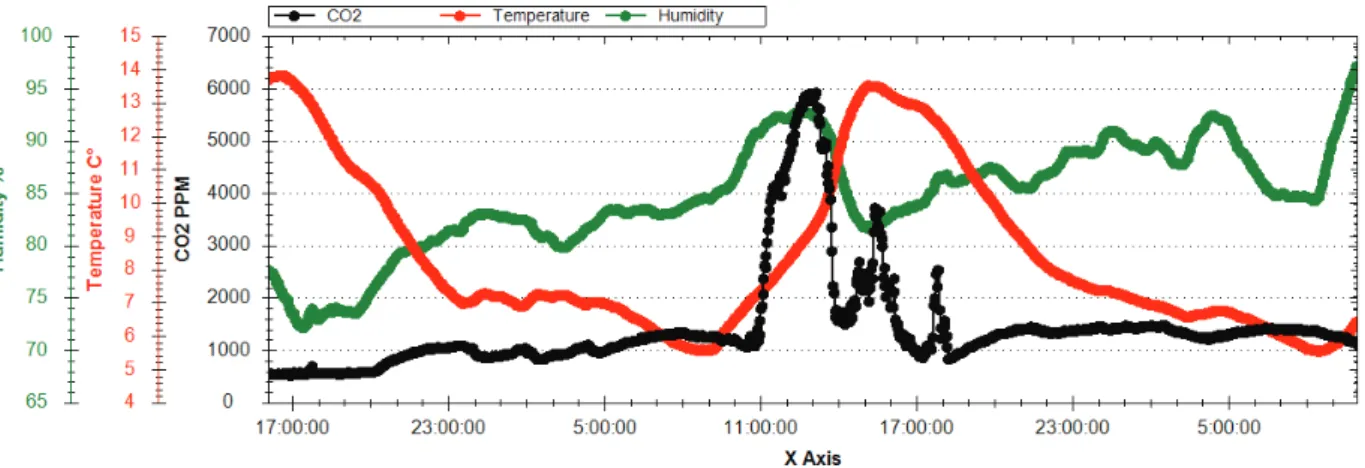
influence of the depressurization in the prototype; then a longer experiment (5 days) to evaluate daily fluctuations. The first set of experiments was intended to determine the response of the system at different !P conditions. This was carried out setting partially open the valves of the bell (fully closed, ¼ open and ½ open), leading to depressurizations of respectively 18 Pa, 4 Pa and 1.2 Pa. The duration of these tests was short (4 hours). The injected CO2 rapidly accumulated in the bell, reaching average concentrations around respectively 6000 ppm, 4000 ppm and
1200 ppm. The depressurization and ventilation rates thus strongly influence indoor concentration. Another very interesting outcome of this first set of experiments was the capture of a strong CO2 concentration peak during the
last experiment: the concentration increased in the prototype from around 1200 ppm to 6000 ppm (factor 5) very suddenly (1.5 hour), as illustrated in Figure 3. We did not find strong evidence explaining this peak. The importance of this observation relates to the nature of the risk considered. For contaminants such as radon for which chronic risk over long-time periods is feared, capturing the average concentration constitutes valuable information. For CO2, we
are also concerned with acute risks over short-term periods in the order of few minutes. Thus average values do not bring sufficient information, and extreme values also need to be evaluated.
Figure 3 - Evolution of CO2concentration (black curve), temperature (red line), and relative humidity (green curve) in the prototype for the ½
open valve short experiment. Note the sharp peak in the CO2concentration during late morning - early afternoon.
Following this first set of experiments, we decided to perform a longer experiment, with the hope to capture new peaks and to explain their origin. This experiment lasted for almost 4 days in early February 2016 with relatively stable meteorological conditions (no much wind, and no rainfall). The depressurization was set at -10 Pa. The basin was emptied from CO2before the beginning of the experiment through pumping at high flow rate in the prototype
(100 L.min-1) during several weeks. Just before the experiment, the concentrations of CO2inside the bell and in the
sand were 440 and 530 ppm, respectively.
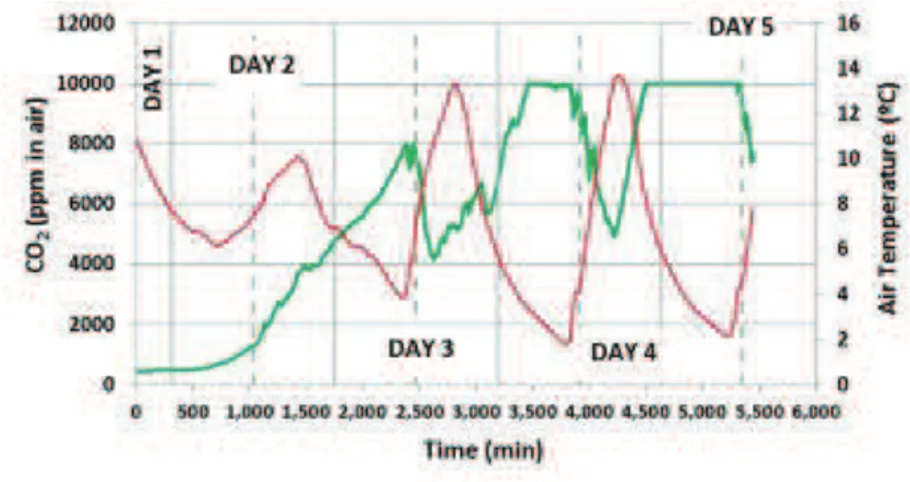
The CO2 concentration inside the bell started to increase from atmospheric background after 10 hours injection
(Figure 4).The concentration increased until noon of the third day of injection (40 h after the onset of the experiment), reaching up to 8000 ppm. This maximum coincided with the lowest air temperature (3.8 ºC) and with the lowest humidity of the day. From noon till the evening, CO2concentration dropped down to 4100 ppm. During
the night, CO2 increased reaching sensor saturation (10,000 ppm) and then decreased in the morning when
temperatures and humidity started to increase. This daily cycle was repeated in the next 24 hours. The variations are significant, with extreme concentrations overpassing twice the average concentration. Another interesting result comes from the concentration recorded in the soil (10 cm below the surface) outside of the prototype perimeter: it is anti-correlated with the indoor concentration. This behaviour seems to suggest that some process is perturbing the access of injected gas inside the bell at some point, diverting and promoting gas flow laterally, reducing the inflow to the bell.
There seems to be an anti-correlation between temperature and concentrations, and between humidity and concentrations, but the mechanisms that control these correlations are not fully understood. Another hypothesis to explain the sharp peaks of concentration involves the variations of atmospheric pressure that modifies advective fluxes. Unfortunately, the pressure sensor was deficient during experiments. Thus it was not possible to analyse the correlation between atmospheric pressure and CO2concentrations. For non-technical reasons, it was not possible to
Figure 4 - Evolution of the concentration of CO2(green line) and temperature (red line) in the air inside the prototype. Note that the CO2Sensor
saturated at 10000 ppm=1%.
Modeling of experimental results
Model
Simulations were carried out using the multiphase and multicomponent simulator TOUGH2 [8] combined with the research module EOS7CA [9]. This module is specifically dedicated to simulate transport of CO2 at shallow depth in
the saturated and unsaturated zones. It includes the equations of state for a two phase flow (gas and liquid), five components (water, brine, CO2 or N2, a gas tracer, and air) for a system at near ambient pressure / temperature
conditions. In this module, both advection and molecular diffusion transport mechanisms are represented for the components (gaseous and dissolved). The effect of gravity is taken into consideration through the advection equation for gas and liquids. This code has already been used to model injection in shallow subsurface injection sites [10,11].
Simulations gave similar results with 3D and 2D radial models. Thus 2D radial models were used in the following (the basin is seen as a cylinder of 16 m² of section). A sensitivity analysis (not shown here) was performed to determine the optimal size of the mesh (compromise between precision and computation time). The cell widths are around 20 cm and the heights around 10 cm. Hydraulic parameters were determined through measures (Table 2).
Table 2 - Parameters used for modeling the PISCO2soil.
PISCO2Soil
Permeability (m²) 10-10
Porosity (-) 0.43
T°(°C) 15
Residual water saturation 0.08 Residual gas saturation 0.01 Soil saturation Residual saturation Van Genuchten (!) (Pa-1
) 10-4
Van Genuchten (m) 0.2
The boundary conditions on vertical and bottom boundaries consist of no-flux. The injection was simulated by imposing a CO2flux in bottom cells at 2 m depth. The upper surface (atmosphere and inside-prototype) is modeled
by a layer of cells with infinite volume, such that the boundary condition corresponds to a fixed pressure. Constant atmospheric pressure was imposed in the cells representative of the atmosphere. The depressurization between the prototype and the atmosphere was considered to fix pressure in the cells representative of the prototype. In the prototype, the concentration of CO2is calculated by a simple accumulation model in steady state (as in [4]). This
"
#
$
$
%
&
2 2 CO CO out inV
Q
C
C
Equation 1Where Cinis the resulting concentration in the prototype (% vol.); QCO2 the flux of CO2 entering the prototype (g/s);
V, the volume of the prototype (here 0.75 m3); ", the ventilation rate of the prototype (s-1); Cout the CO2 atmospheric
background concentration (0.04 % vol); #, the masse volume of CO2 (g/m3).
Modeling results for the longer experiment
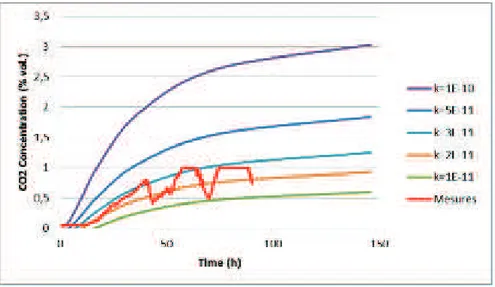
Several injection configurations were modeled. Here only the results of the longer experiment with depressurization of -10 Pa with valves closed (air renewal=1.36 h-1) are presented. Modeling shows that after about 5 to 8 days injection the system is close to steady state. The model with a permeability around 2 to 3·10-11 m² reproduces quite well the average concentration over time into the prototype by comparison to measurement, but does not capture the important variations (Figure 5). At steady state, nearly all the basin is under the influence of the depressurization of the interface. As a consequence, a significant part of the injected CO2 (about 50%) is channelized to the prototype
while the surface of the prototype is about 1/8 of the basin surface.
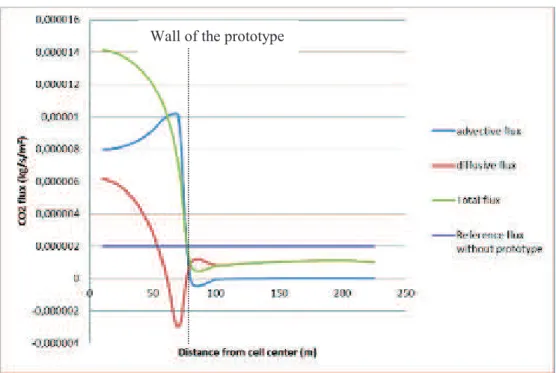
The flux entering the prototype is mostly advective due to the pressure gradient imposed by the depressurization system (Figure 6). This flux is the main contributor in terms of resulting concentration. The advective flux of CO2
just around the prototype is negative: the soil sucks CO2 from the atmosphere, due to the footprint of the lower
pressure caused by depressurization in the building. Farther from the prototype the advective flux is nil because of the absence of pressure gradient. The diffusive flux decreases from the center of the prototype to its perimeter. It becomes negative near the walls of the prototype. This could be explained by variations of concentration in soil below the prototype: near the walls of the prototype, the concentration in soil at 10 cm depth is 1%-2% (Figure 7, this value was validated by an experimental measurement) while the average concentration in soil at the center of the prototype is about 3.2%. Thus, at this specific location, the diffusive flux is from the interior of the prototype to the soil outwards. Farther from the prototype the diffusive flux to atmosphere reaches a value of half the average injection flux.
Figure 5 – Concentration of CO2 in the prototype for different permeabilities of the basin. Comparison with measured concentration in the -10 Pa
Figure 6 – Flux of CO2 at the soil/prototype interface and the soil/atmosphere interface at steady state (long experiment, dP= -10 Pa).
Figure 7 - CO2 concentration at 10 cm deep in the basin (-10 Pa) at steady state (model).
From Figure 5 we note that with the permeability used in the base case (k=1.10-10) the increase of concentration is not consistent with observations. It is possible to reproduce the tendency while modifying the permeability of the basin. When permeability decreases, the speed of migration decreases and the increase of concentration in the prototype gets slower. Thus, with a permeability of about 2-3·10-11 m² the model reproduces in average the global tendency in terms of concentration in the prototype. The difference in permeability could be due to the following causes: 1) Soil compaction (due to removing of water from the cell, walking on sand), 2) Modification of the relative permeability due to variation of water saturation.
As a conclusion, the model reproduces the overall tendencies and orders of magnitudes, and enables to better understand the transport mechanisms involved. But it fails to reproduce daily variations observed during the experiment, which is unsurprising considering the modeling assumptions. As already mentioned, environmental conditions (especially pressure variations) during the experiments were missing to perform refined simulations.
4. Modeling for risk analysis
The objective of this section is to perform additional simulations in the view of risk analysis. More precisely, we aimed to:
- Investigate the scenarios defined for risk assessment (section 2), for reference settings, and carry out sensitivity analyses.
- Investigate with models how the pressure could lead to deviations from the average CO2concentration.
- Investigate with building models how other meteorological (wind, temperature) and building parameters (dimensions, foundation type, air permeability of the envelope, ventilation system) influence the indoor pressure field and the ventilation rate and thus the CO2income and the CO2indoor concentration.
Parameters of the reference setting
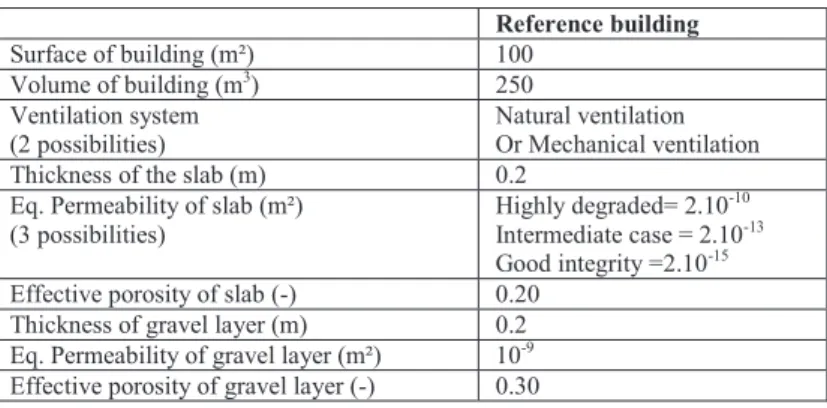
A reference slab on grade building is defined. To take into account the variability of buildings, two options are considered for the ventilation system (natural, mechanical) and 3 types of slab tightness are proposed (Table 3). Three types of soils are also considered (Table 4). Three values were also investigated for the vadose thickness (the injection being considered at the basis of the vadose): 5, 10 and 20 m.
Table 3 – Properties of the reference building used for modelling of scenarios.
Reference building Surface of building (m²) 100 Volume of building (m3 ) 250 Ventilation system (2 possibilities) Natural ventilation Or Mechanical ventilation Thickness of the slab (m) 0.2
Eq. Permeability of slab (m²) (3 possibilities)
Highly degraded= 2.10-10
Intermediate case = 2.10-13
Good integrity =2.10-15
Effective porosity of slab (-) 0.20 Thickness of gravel layer (m) 0.2 Eq. Permeability of gravel layer (m²) 10-9
Effective porosity of gravel layer (-) 0.30
Table 4 – Properties of the three different soils used for modelling of risk scenarios. Un-specified parameters are kept unchanged compared to Table 2.
Coarse soil Average soil Clay soil
Permeability (m²) 10-10 5.10-11 10-15 Effective porosity (-) 0.25
Residual water saturation 0.15
Results of the modelling of the scenarios defined for risk assessment, with constant parameters
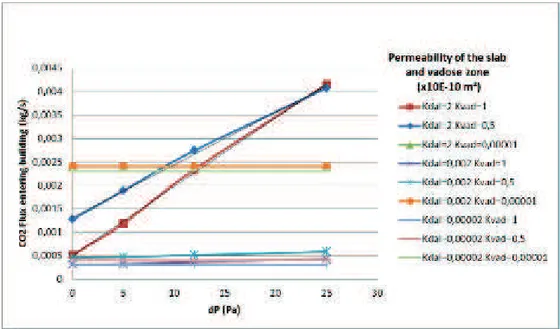
In this first set of simulations, all parameters are fixed against time (no meteorological variations): for given permeabilities (slab and vadose), for a given leakage flux, for a given depressurization, for a given injection depth, we obtain a single value of the flux entering the building once the steady-state is reached. The dilution model introduced in Equation 1 above can be used to translate fluxes in concentrations, considering a constant ventilation rate. Assuming a constant ventilation rate of 1 h-1, the entering flux above which adverse CO2 concentrations are
reached (i.e. content higher than 3%) is 0.004 kg.s-1. The results of this set of simulations, for given values for the leakage rate and its depth are represented in Figure 8.
Figure 8 - Flux entering the building for different indoor depressurization values, for different slab and vadose permeabilities (respectively kdal
and kvad). Here Q source =0.01 kg/s on a 1 m² surface at 10 m depth (equivalent to a flow of about 106 g/day).
For CO2 injection rates around 0.01 kg/s, the flux entering the building can lead to CO2 concentrations higher than
3% (assuming a ventilation rate of 1 h-1) for unfavorable couple of permeability values and for significant depressurization values (around 20-25 Pa, which is a rare and punctual value). Of course lower values of leakage rates lead to lower entering fluxes. Nevertheless the figures obtained for other leakage rates present similar tendencies: the flux entering the building depends on the depressurization only for very permeable media. When permeabilities decrease, the pressure gradient caused by building depressurization does not propagate into the soil, and the entering flux is only very slightly impacted. When the depth of the leakage source increases, the entering flux decreases. This prior set of simulations confirms the influence of leakage rates and depth, of the slab and vadose permeabilities, and in some cases of the depressurization value.
Influence of atmospheric pressure variations
Important variations of indoor CO2 concentrations have been evidenced during the experiment. As health effects are
mainly related to the maximum of exposure, it appeared necessary to be able to capture and evaluate these extreme values. A new set of simulations was carried out based on the previous one. The initial state for the new set of simulations corresponds to the steady-state previously computed with a constant injection rate and a constant atmospheric pressure. From this initial state, the new simulations are performed by time steps of 1 hour. At each time step, a supervisor modifies the pressure in the cells representing the atmosphere, based on a pressure history previously defined. The pressure in the cells representing the building is also modified to maintain a constant depressurization.
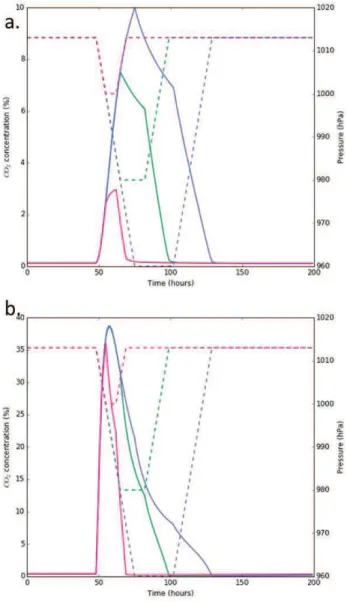
We then created artificial pressure histories, with different magnitude and speed for atmospheric pressure drop, based on observations for the Paris basin. We present below the results obtained for a vadose permeability of ! " #$%&& m², for an indoor depressurization of 12 Pa, a leakage depth of 10 m and a leakage rate of 0.0028 kg/s (quite low flux). For this situation, with a constant dilution rate of 1 h-1, the steady-state CO2 concentration in the
building remains acceptable: 0.12 % for an intermediate slab permeability (' " #$%&( m²) and 0.36 % for a highly degraded slab (' " #$%&) m²). When subjected to a synthetic pressure history, peaks of CO2 concentration are
observed. The magnitude of these peaks is very high compared to the steady-state average value, as presented in Figure 9: for the intermediate permeability case, the concentration rises abruptly up to several percent (meaning a danger to health), in the range 2-10 % depending on the magnitude of the pressure drop,
i.e.
a factor 20-100 compared to the average concentration. For the highly degraded slab, we do not observe much differencebetween the three pressure histories: the concentration reaches very high values (around 35 %) even for the smaller pressure drop. Further increase is barely possible for larger pressure drops due to the limitations in the quantity of available CO2: most of the CO2 present in the soil has been sucked out due to the pressure drop.
The magnitudes of the observed peaks should be considered cautiously, but in any case the simulations give evidence that variations of atmospheric pressure have a very strong influence on the short-term concentrations in the building. This result constitutes a significant result in the view of risk analysis.
Figure 9 – Impact of atmospheric pressure drop on the CO2 concentration inside the building. Dotted lines correspond to the pressure drop
history. Plain lines correspond to the CO2 indoor concentration. Three pressure drop histories are tested, from a rather usual one (pink) to more
unfrequent values (green) and to violent meteorological events (violet). Top (a.): low slab permeability, bottom (b): high slab permeability.
Influence of building parameters and meteorological conditions
In previous simulations, the ventilation rate and the depressurization in the building were considered as constant. A new set of simulations was performed to address the limitation of these hypotheses. To this purpose the SIREN code developed by CSTB to assess indoor exposure to pollutants such as radon, was used downstream the previously described TOUGH model. Figure 10 illustrates the principle of the weak coupling between both codes. The SIREN code integrates meteorological parameters (temperature, wind, humidity), characteristics of the building
(dimensions, foundation type, air permeability of the envelope, ventilation system) to derive the value of the depressurization inside the building and the ventilation rate with a time step of 3 minutes. Knowing the pressure in the building, the SIREN code deduces the flux of CO2 entering the building through a QCO2=f(dP) intrusion law,
which is drawn from a set of Tough2/EOS7CA simulations of leakage scenarios. Typical meteorological conditions from the Paris Basin were used.
Figure 10-Modelling approach for calculation of indoor concentration for “typical” variations of meteorological conditions. Parameters that vary with time are followed with (t), other parameters are constant against time.
The SIREN simulations have been conducted over one year, for several injection flux provided by TOUGH simulations and for two buildings scenarios, a building relatively permeable (I4 = 2.5 m
3
/h/m²) with a natural ventilation system (cf. old house) and a building more airtight (I4 = 1.7 m
3
/h/m²) with a mechanical ventilation system (cf. standard house).
For the SIREN simulation that corresponds to an injection flux of 0.01 kg/s on a 1 m² surface at 10 m depth, a vadose permeability of 5.10-11 m², and a slab permeability of 2.10-13 m², the annual average concentration is around 4527 ppm for the old house and around 4090 ppm for the standard house.
Figure 11 shows an example of CO2 concentration evolution during one month (June). On this basis, we can
evaluate the orders of magnitude between average and extreme values, considering realistic depressurization and ventilation rates histories. During summer, the indoor concentration could be multiplied by a factor 5 for the natural ventilation building, compared to a factor 1.5 times for the mechanical ventilation building. We can see that the mechanical ventilation system imposes a continuous air renewal that limits the increase of CO2 concentration
especially during the night period. This result could be attenuated considering the opening window airing, which is not taken into account in our calculations.
Figure 11- CO2concentration in the building over time (example of June month), for an injection flux of 0.01 kg/s, a vadose permeability of 5.10 -11
m², a slab permeability of 2.10-13
m²
Another way to present the annual results is to give the one year indoor concentration distribution as illustrated in Figure 12, enabling to better quantify extreme values to constitute a useful result for risk analysis
Figure 12- CO2concentration distribution in the building for the year, for an injection flux of 0.01 kg/s, a vadose permeability of 5.10-11m², a slab
permeability of 2.10-13
5. Conclusion
The representative-scale experiment enabled to better understand the transport and accumulation in the prototype at the PISCO2 site. The influence of depressurization in the prototype was highlighted through a set of three
experiments. An unexpected peak of CO2 concentration in the prototype was observed during the first set of
experiments. This observation is of prior importance considering the nature of risk. Exposure to CO2can indeed lead
to acute risks over very short-term periods. Thus average values do not bring sufficient information, and extreme values need to be evaluated. A new experiment was carried out, motivated by the capture of new peaks, with the objective of quantifying and explaining these peaks. This experiment lasted several days and enabled the record of new peaks. Even if numerous questions remained at the end of the experiments campaign (which could not be enriched for non-technical reasons), the experimental results enabled confrontation with models and brought fruitful directions for further modelling work.
A significant number of simulations were carried out. In a first time these simulations consisted in strengthening and enriching the results obtained previously. Sensitivity analyses on soil and interface parameters confirmed the importance of parameters such as the permeability of the vadose and the slab, indoor depressurization, vadose thickness, leakage flow rate. Numerical models give interesting insights in the understanding of transport mechanisms (namely diffusion and advection) in the different locations, especially at singular points (walls). More sophisticated simulations were then carried out to address the variability of CO2 concentrations. The simulations
gave evidence that variations of atmospheric pressure have a very strong influence on the short-term concentration in the building. Additional simulations showed the influence of building parameters and meteorological conditions leading to variations in the CO2 content in indoor air that deviate significantly from average values. Since the
challenge is to capture extremes and not average values, these results constitute significant progress in view of risk analysis.
Acknowledgements
This work was co-funded by ADEME (1394C0032) (the French Environment and Energy Management Agency) through the IMPACT-CO2 project. The authors are grateful to Curtis M. Oldenburg (Lawrence Berkeley National Laboratory) who provided the research code TOUGH EOS7CA.
References
[1] Bouc O, Bellenfant G, Dubois D, Guyonnet D, Rohmer J, Gastine M, et al. CO2 geological storage safety assessment: Methodological developments. 10th Int Conf Probabilistic Saf Assess Manag 2010, PSAM 2010 2010;2:1023–34.
[2] Chow FK, Granvold PW, Oldenburg CM. Modeling the effects of topography and wind on atmospheric dispersion of CO2 surface leakage at geologic carbon sequestration sites. Energy Procedia 2009;1:1925–32. doi:10.1016/j.egypro.2009.01.251.
[3] Diallo TMO, Collignan B, Allard F. 2 D semi-empirical models for predicting the entry of soil gas pollutants into buildings. Build Environ 2015:1–16.
[4] de Lary L, Loschetter A, Bouc O, Rohmer J, Oldenburg CM. Assessing health impacts of CO2 leakage from a geological storage site into buildings: Role of attenuation in the unsaturated zone and building foundation. Int J Greenh Gas Control 2012;9:322–33. doi:10.1016/j.ijggc.2012.04.011.
[5] Hepple RP. Chapter 26 – Human Health and Ecological Effects of Carbon Dioxide Exposure. Carbon Dioxide Capture Storage Deep Geol Form 2005;2:1143–72. doi:10.1016/B978-008044570-0/50155-0. [6] Stenhouse M, Arthur R, Zhou W. Assessing environmental impacts from geological CO2 storage. Energy
Procedia 2009;1:1895–902. doi:10.1016/j.egypro.2009.01.247.
[7] Pearce J, Jones D, Blackford J, Beaubien S, Foekema E, Gemeni V, et al. A Guide for Assessing the Potential Impacts on Ecosystems of Leakage from CO2 Storage Sites. Energy Procedia 2014;63:3242–52. doi:10.1016/j.egypro.2014.11.351.
Laboratory. 1999.
[9] Oldenburg CM. EOS7CA Version 1.0: TOUGH2 Module for Gas Migration in Shallow Subsurface Porous Media Systems. University of California Berkeley, CA 94720. 2015.
[10] Oldenburg CM, Lewicki JL, Dobeck L, Spangler L. Modeling Gas Transport in the Shallow Subsurface During the ZERT CO2 Release Test. Transp Porous Media 2010;82:77–92. doi:10.1007/s11242-009-9361-x.
[11] Basirat F, Niemi A, Perroud H, Lofi J, Denchik N, Lods G, et al. Modeling Gas Transport in the Shallow Subsurface in Maguelone Field Experiment. Energy Procedia 2013;40:337–45.