Official URL
https://doi.org/10.1109/ICIP40778.2020.9191013
Any correspondence concerning this service should be sent
to the repository administrator:
[email protected]
This is an author’s version published in:
http://oatao.univ-toulouse.fr/26432
Open Archive Toulouse Archive Ouverte
OATAO is an open access repository that collects the work of Toulouse
researchers and makes it freely available over the web where possible
To cite this version: El Mansouri, Oumaima and Basarab,
Adrian and Figueiredo, Mario and Kouamé, Denis and Tourneret,
Jean-Yves Ultrasound and magnetic resonance image fusion using
a patch-wise polynomial model.
(2020) In: IEEE International
Conference on Image Processing (ICIP 2020), 25 October 2020 -
28 October 2020 (Abu Dhabi, United Arab Emirates).
ULTRASOUND AND MAGNETIC RESONANCE IMAGE FUSION USING A PATCH-WISE
POLYNOMIAL MODEL
O. El Mansouri
(1),(2)A. Basarab
(2)M. A. T. Figueiredo
(3)D. Kouam´e
(2)J.-Y. Tourneret
(1)(1)
University of Toulouse, IRIT/INP-ENSEEIHT/T´eSA, 31071 Toulouse Cedex 7, France
(2)University of Toulouse, IRIT, CNRS UMR 5505, Universit´e Paul Sabatier, Toulouse, France (3)Instituto de Telecomunicac¸˜oes, Instituto Superior T´ecnico, Universidade de Lisboa, 1049-001 Lisbon, Portugal
images in a single image in order to improve the diagnosis capacity of each modality.
Image fusion refers to assembling all the important infor-mation from multiple images and including them in fewer im-ages or into a single image. Its purpose is not only to reduce the amount of data but also to build enhanced images that are more comprehensible and informative for human and ma-chine insight [2]. Fusion of medical images is becoming very common for the study of a given pathology [3–5], and gen-erally allows for a better medical decision in clinical studies. Medical images that are commonly fused include CT scans and positron emission tomography [6], or gammagraphy and US images [7]. However, to the best of our knowledge, the fusion of MR and US images, which is the purpose of this work, has been less addressed in the existing literature.
In our previous work on MR and US image fusion [8], we introduced a new algorithm performing both super-resolution of the MR image and despeckling of the US image. That algo-rithm was based on a polynomial function relating the US and MR images, accounting for the discrepancy between these two modalities. The coefficients of this polynomial were pre-estimated from the observed images. This paper further im-proves the polynomial relation between the two images by estimating the polynomial coefficients patch-wise, thus allow-ing for a better matchallow-ing between the two images to be fused. Note that a similar idea was used in [9] for MRI images.
The paper is organized as follows. Section 2 presents the observation models, the patch-based polynomial function re-lating the US and MR images, and the optimization problem considered to fuse these images. The algorithm proposed to solve the fusion problem is detailed in Section 3. Simulation results are presented in Section 4. Conclusions and perspec-tives are finally reported in Section 5.
2. MAGNETIC RESONANCE AND ULTRASOUND IMAGE FUSION
2.1. Observation models
Denote as ymr ∈ RM and yus ∈ RN the registered MR and US images, withM and N the number of pixels in each ABSTRACT
This paper introduces a novel algorithm for the fusion of mag-netic resonance and ultrasound images, based on a patch-wise polynomial model relating the gray levels of the two imaging systems (called modalities). Starting from observation mod-els adapted to each modality and exploiting a patch-wise poly-nomial model, the fusion problem is expressed as the mini-mization of a cost function including two data fidelity terms and two regularizations. This minimization is performed us-ing a PALM-based algorithm, given its ability to handle non-linear and possibly nonconvex functions. The efficiency of the proposed method is evaluated on phantom data. The re-sulting fused image is shown to contain complementary infor-mation from both magnetic resonance (MR) and ultrasound (US) images, i.e., with a good contrast (as for the MR image) and a good spatial resolution (as for the US image).
Index Terms— Image fusion, magnetic resonance imag-ing, ultrasound imaging, super-resolution, despeckling, im-age enhancement, patch-based method.
1. INTRODUCTION
Magnetic resonance (MR) and ultrasound (US) images have been used intensively in many clinical diagnosis and guided surgery applications. While they both carry important infor-mation in assessing the condition of organs, they exploit dif-ferent physical phenomena and thus have their own advan-tages and limitations. In particular, US imaging offers a good spatial resolution and high frame rate compared to MRI, at the cost of a very low signal to noise ratio (SNR), low contrast (depending on the central frequency of the probe), a presence of speckle noise and a reduced field of view. In contrast, MRI enables a wide field of view, with a good SNR, high contrast, but relatively low spatial resolution [1]. As a consequence of these complementary properties, MR and US images are commonly used jointly in various clinical applications. The objective of this paper is to propose a method to fuse the two
The authors would like to thank Fabien Vidal for providing the ultra-sound and magnetic resonance data, as well as for the fruitful discussions about the clinical pertinence of the proposed algorithm.
image1. This section introduces two observation models ac-counting for the low spatial resolution of MR images and the low SNR of US images. The low resolution of the MR image is modeled by a downsampling operation and a low pass filter [11], while an additive noise model is considered for the US B-mode image. Note that speckle is assumed to be a multi-plicative noise, leading to additive perturbations when apply-ing log-compression, which is classically considered before forming B-mode images. Furthermore, this works assumes that the speckle noise affecting B-mode images is distributed according to a log-Rayleigh distribution, as in [12, 13]. The two resulting observation models are
yus= xus+ nus ymr= SHxmr+ nmr,
(1)
where yus ∈ RN is the observed B-mode US image, xus ∈ RN is the noiseless US image, nus∈ RN is the log-Rayleigh speckle noise, xmr ∈ RN is the high-resolution MR image, ymr ∈ RM is the observed (low-resolution) MR image, and nmr ∈ RN is an additive Gaussian noise. The matrix H ∈ RN×N is the blurring matrix and S ∈ RM×N (withN = d2
M ) is a decimation operator with decimation factor d. Note that the decimation factor is such that xus and xmr have the same spatial sampling.
2.2. Patch-based polynomial model
The patch-based polynomial model proposed in this work (relating the gray levels of MR and US images) is moti-vated by the fact that US images highlight the interfaces be-tween different anatomical structures with different acoustic impedances [14]. More precisely, the US image is expressed as a function of the MR image and its spatial gradient is computed in the direction of US wave propagation
xus= f (xmr, ∇xHmru), (2) wheref : RN × RN → RN is unknown and∇xH
mru∈ R N contains in itsith line the inner product between the ith local gradient xmrand the US scan direction u.
The functionf was represented by a global polynomial in our previous work on image fusion [15], and in [14] for multimodal image registration. However, the relationship be-tween MR and US images may depend on tissue acoustic and magnetic properties, and thus may change from one image re-gion to another. Thus, considering a global polynomial model may lead to inaccurate gray level matching in specific image regions. To overcome this issue, this paper introduces a more general patch-based polynomial model, fitting independently low-order polynomial functions to each overlapping patch ex-tracted from MR and US images. This patch-based polyno-mial model is defined as
1The MR and US images are supposed to be registered with an algorithm
such as [10] and the possible registration errors are ignored.
Ppxus= fp(Ppxmr, Pp∇xHmru), (3) where Pp ∈ Rn×N is a binary operator that extracts thepth patch of sizen from an image of size N . In the following, Npwill denote the total number of patches. Replacingfpby a polynomial function, the relation between patches from the US and MR images becomes
Ppxus= X l+k≤dp
cl,k,pPpxlmr⊙ (Pp∇xHmru) k, (4)
wherep = 1, ..., Npis the patch number,dpandcl,k,pare the order and the coefficients of the polynomial functionfp cor-responding to patch#p, ⊙ is the Hadamard product (element by element multiplication) and the power operations applied to vectors are element-wise. In this paper, the final functionf is obtained by averaging patch-wise polynomials, since each pixel of the image is contained in several overlapping patches. More precisely, the transformation of theith pixel denoted as fi : RN × RN → R is the average of all the polynomials associated with the patches containing this pixel.
2.3. Cost function
Using the observation models in (1), the relationship between MR and US images defined in (3) and (4), and the ideas pro-posed in [15], this paper formulates image fusion as the fol-lowing optimization problem:
ˆ x= argmin x 1 2!ymr− SHx! 2 ! "# $
MRI data fidelity
+ τ1!∇x!2+ τ2!∇f (x, ∇xHu)!2 ! "# $ regularization + τ3 N X i=1 %
exp(yus,i− fi(x, ∇xHu)) − λ(yus,i− fi(x, ∇xHu))
&
! "# $
US data fidelity
,
(5) where ˆx is the fused image,yus,iis theith pixel of yus and whereτ1,τ2,τ3are hyperparameters balancing the weights of the MR and US data fidelity terms and regularizations. Note that, following [15], total variation was used to regu-larize the solution, thus promoting piecewise constant fused images both in the US and MR domains.
3. OPTIMIZATION
3.1. PALM algorithm for MR and US image fusion The cost function in (5) is non-convex because of the pres-ence of the polynomial functionsf and fi. Therefore, we investigate a solution based on the proximal alternating lin-earized minimization (PALM) algorithm [16]. In order to fit the general form of this algorithm, we propose the following parametrization:
l(x) = 1 2&ymr− SHx& 2 2+ τ1&∇x& 2 , g(v) = τ3 X i
[exp(yus,i− vi) − γ(yus,i− vi)] + τ2&∇v&2, H(x, v) = τ4&v − f (x, ∇xHu)&2,
where
v= f (x, ∇xHu).
This parametrization allows (5) to be rewritten as argmin
x,v l(x) + g(v) + H(x, v),
(6) where l and g are related to the MRI and US images, and H ensures the coupling between the two modalities (whose importance is controlled by the hyperparameterτ4).
The PALM algorithm iteratively minimizes the cost func-tion in (6) with respect to x and v (the reader is invited to consult [16] for more details about PALM). Note that this cost function depends on the coefficientscl,k,pand degreesdpof the different polynomials, which need to be estimated for each patch, as shown in the next subsection.
3.2. Estimation of the polynomial functionsfp
For a given degree dp, the polynomial function fp relating patches Ppxmrand Ppxusis defined by(dp+ 1)(dp+ 2)/2 coefficients assembled in the vector cd,p = {ck,l,p | k + l ≤ dp}. To estimate these coefficients, we consider that the pth observed MR and US patches are related according to
Ppyus= X k+l≤3 ckl,pPpylmr⊙ (Pp∇yHmru) k+ ǫ p, or in a matrix form Ppyus= Amr,pcd,p+ ǫp, (7) where Amr,p is a matrix whose elements are Ppylmr ⊙ (Pp∇yHmru)k for l + k ≤ dp, and ǫp is the measurement error. The least-squares estimator of cd,pis defined by
ˆ cd,p= A†mr,pPpyus, p = 1, ..., Np, where A†mr,p = (A T mr,pAmr,p)−1ATmr,pis the pseudo-inverse of the matrix Amr,p.
In order to estimate the polynomial degree of thepthpatch, we minimize the least square distance between Ppymr and Ppyus, i.e., solve the following problem
argmin dp
&Ppyus− fp(Ppymr, Pp∇yHmru)& 2
, where we highlight that the polynomial degreedpdepends on the patch size. In the results provided in this paper, patches of size30×30 were extracted from images containing 600×600 pixels, with an overlap of25%. The degree of the polynomial relating the patches was constrained todp∈ {1, ..., 3}.
4. RESULTS AND DISCUSSION
The proposed MR-US image fusion algorithm was validated on experimental phantom data.2. Figs. 1(a,b) show the ob-served MR and US images.
(a) MRI (b) US image
(c) Noisy US image (d) Fused image using [15]
(e) Fused image (this paper)
Fig. 1. Original MR image (200 × 200 pixels) and US image (600 × 600 pixels) and fusion results: (a) observed MRI, (b) original US image, (c) noisy US image, (d) fused image us-ing a global polynomial model [14], (e) fused image with the proposed path-based polynomial model.
To mitigate the relatively good SNR obtained due to the phantom design, the US image was further degraded by log-Rayleigh noise as shown in Fig. 1(c). Figs. 1(a,b,c) highlight the differences in gray levels, spatial resolution, contrast, and noise between the two MR and US images. Three main structures can be observed in these images: a PVC phantom
2More details about the experimental model design and image acquisition
(a) (b)
(c)
Fig. 2. (a) and (c) show normalized pixel intensities of extracted lines from the MR, US and fused images (using [15] and the proposed patch-based fusion). (a) shows the vertical straight lines in (b) whereas (c) displays the horizontal straight lines in (b).
(bright structure in the MR image), a piece of beef meat (gray structure in the MR image), and the glue used to attach them, only visible in the US image. Figs. 1(c,d) show the fused images obtained with the algorithm in [15] and the new pro-posed approach. Both fused images gather information from MR and US images (with a small preference to the proposed method): they provide a good contrast between the PVC and the beef tissue (similar to MRI), a good spatial resolution (similar to US) allowing small structures such as the glue to be distinguished, and good SNR. Moreover, the image obtained after fusion seems to carry more information than MRI, especially in the beef tissue.
Table 1. CNR results CNR
MRI US Fused image with [15] Proposed 48.76 dB 20.64 dB 37.73 dB 41.72 In addition to visual inspection, the performance of the pro-posed patch-wise method was evaluated using two quanti-tative measures and compared to the global fusion method of [15]: 1) the contrast-to-noise ratio (CNR) [18] between the PVC and the beef meat, and 2) the slope between two neighboring structures as an indication of the spatial resolu-tion [19]. As reported in Tables 1 and 2, the patch-wise ap-proach offers a better compromise between MR and US
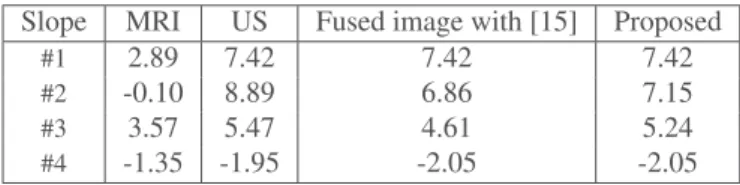
im-Table 2. Slope values at the interface between different regions of interest in the MR, US and fused images, corresponding to the vertical profile in Fig. 2.
Slope MRI US Fused image with [15] Proposed
#1 2.89 7.42 7.42 7.42
#2 -0.10 8.89 6.86 7.15
#3 3.57 5.47 4.61 5.24
#4 -1.35 -1.95 -2.05 -2.05
ages with a CNR close to that of the MRI and a slope close to that of the US image. Fig. 2 confirms these results, showing that the patch-wise fused image captures more details from the MRI than the global model-based fused image.
5. CONCLUSION
This paper studied a new approach for MR and US image fu-sion. The relation between MR and US images was modeled locally by low-order polynomial functions associated with the image patches. Interestingly, results obtained on a phantom show the advantage of using local polynomials associated with the image patches. A natural progression of this work is to combine the proposed fusion method with multimodal image registration in order to correct the registration errors and to further validate the algorithm on in vivo data.
6. REFERENCES
[1] M. C. Mahoney and M. S. Newell, “Screening MR imaging versus screening ultrasound: pros and cons,” Magnetic Resonance Imaging Clinics, vol. 21, no. 3, pp. 495–508, 2013.
[2] M. Amin-Naji and A. Aghagolzadeh, “Multi-focus im-age fusion in DCT domain using variance and energy of Laplacian and correlation coefficient for visual sensor networks,” Journal of AI and Data Mining, vol. 6, pp. 233–250, 2018.
[3] J. Du, W. Li, K. Lu, and B. Xiao, “An overview of multi-modal medical image fusion,” Neurocomputing, vol. 215, pp. 3–20, 2016.
[4] A. P. James and B. V. Dasarathy, “Medical image fusion: A survey of the state of the art,” Information Fusion, vol. 19, pp. 4–19, 2014.
[5] A. Loza, D. Bull, N. Canagarajah, and A. Achim, “Non-Gaussian model-based fusion of noisy images in the wavelet domain,” Computer Vision and Image Under-standing, vol. 114, no. 1, pp. 54–65, 2010.
[6] D. W. Townsend and T. Beyer, “A combined PET/CT scanner: the path to true image fusion,” The British jour-nal of radiology, vol. 75, pp. S24–S30, 2002.
[7] S. Gautier, G. L. Besnerais, A. Mohammad-Djafari, and L. Blandine, “Data fusion in the field of non destructive testing,” in Maximum Entropy and Bayesian Methods, New Mexico, U.S.A., 1996, pp. 311–316.
[8] O. El Mansouri, F. Vidal, A. Basarab, P. Payoux, D. Kouam´e, and J.-Y. Tourneret, “Fusion of magnetic resonance and ultrasound images for endometriosis de-tection,” IEEE Trans. Image Process., vol. 29, pp. 5324– 5335, 2020.
[9] N. Eslahi and A. Foi, “Joint sparse recovery of mis-aligned multimodal images via adaptive local and non-local cross-modal regularization,” in Proc. IEEE Int. Workshop Comput. Adv. Multi-Sensor Adaptive Process. (CAMSAP), Guadeloupe, West Indies, 2019.
[10] A. Yavariabdi and A. Bartoli, “Mapping and characteriz-ing endometrial implants by registercharacteriz-ing 2D transvaginal ultrasound to 3D pelvic magnetic resonance images,” Computerized Medical Imaging and Graphics, vol. 45, pp. 11–25, 2015.
[11] F. Shi, J. Cheng, L. Wang, P.-T. Yap, and D. Shen, “LRTV: MR image super-resolution with low-rank and total variation regularizations,” IEEE Trans. Med. Imag-ing, vol. 34, pp. 2459–2466, 2015.
[12] D. Kundu and M. Z. Raqab, “Generalized Rayleigh dis-tribution: different methods of estimations,” Computa-tional statistics & data analysis, vol. 49, no. 1, pp. 187– 200, 2005.
[13] T. Tuthill, R. Sperry, and K. Parker, “Deviations from Rayleigh statistics in ultrasonic speckle,” Ultrasonic imaging, vol. 10, no. 2, pp. 81–89, 1988.
[14] A. Roche, X. Pennec, G. Malandain, and N. Ayache, “Rigid registration of 3D ultrasound with MR images: a new approach combining intensity and gradient infor-mation,” IEEE Trans. Med. Imaging, vol. 20, no. 10, pp. 1038–1049, 2001.
[15] O. E. Mansouri, A. Basarab, F. Vidal, D. Kouam´e, and J.-Y. Tourneret, “Fusion of magnetic resonance and ul-trasound images: A preliminary study on simulated data,” in Proc. IEEE Int. Symp. Biomed. Imaging (ISBI), Venice, Italy, 2019, pp. 1733–1736.
[16] J. Bolte, S. Sabach, and M. Teboulle, “Proximal alter-nating linearized minimization or nonconvex and non-smooth problems,” Mathematical Programming, vol. 146, no. 1-2, pp. 459–494, 2014.
[17] F. Vidal, O. E. Mansouri, D. Kouam´e, and A. Basarab, “On the design of a pelvic phantom for magentic resononance and utltrasound image fusion,” in 2019 IEEE International Ultrasonics Symposium (IUS), Glas-gow, Scotland, 2019, pp. 2400–2403.
[18] M. Welvaert and Y. Rosseel, “On the definition of signal-to-noise ratio and contrast-to-noise ratio for fMRI data,” PloS one, vol. 8, no. 11, p. e77089, 2013. [19] R. Morin, A. Basarab, S. Bidon, and D. Kouam´e,
“Mo-tion estima“Mo-tion-based image enhancement in ultrasound imaging,” Ultrasonics, vol. 60, pp. 19–26, 2015.