Any correspondence concerning this service should be sent to the repository administrator:
[email protected]
To link to this article : DOI:10.2106/JBJS.16.01461
URL :
https://doi.org/10.2106/JBJS.16.01461
This is an author-deposited version published in:
http://oatao.univ-toulouse.fr/
Eprints ID: 23135
To cite this version: Thévenin-Lemoine, Camille and Destombes, Louise
and Vial, Julie and Wargny, Matthieu and Bonnevialle, Paul and Lefevre,
Yan and Gomez Brouchet, Anne and Sales de Gauzy, Jérôme
Planning
for Bone Excision in Ewing Sarcoma: Post-Chemotherapy MRI More
Accurate Than Pre-Chemotherapy MRI Assessment. (2018) The Journal of
Bone and Joint Surgery, 100 (1). 13-20. ISSN 0021-9355
O
pen
A
rchive
T
oulouse
A
rchive
O
uverte (
OATAO
)
OATAO is an open access repository that collects the work of Toulouse
researchers and makes it freely available over the web where possible.
Background: In determining the level of bone resection in Ewing sarcoma, the most suitable time at which to perform magnetic resonance imaging (MRI) remains controversial. Current guidelines recommend that surgical planning be based on MRI performed prior to neoadjuvant chemotherapy. The goal of this study was to determine whether pre-chemotherapy or post-chemotherapy MRI provides greater accuracy of tumor limits for planning bone excision in the management of Ewing sarcoma.
Methods: This was a single-center, retrospective study. MRI was performed using 3 sequences: T1-weighted, T1-weighted with contrast enhancement by gadolinium injection, and afluid-sensitive sequence (STIR [short tau inversion recovery] or proton-density-weighted with fat saturation). The tumor extent as assessed on pre-chemotherapy and post-chemotherapy MRI was compared with histological measurement of the resected specimen.
Results: Twenty patients with Ewing sarcoma of a long bone were included. In 6 cases, the tumor was located on the femur, in 5, the tibia; in 5, thefibula; and in 4, the humerus. The median patient age at diagnosis was 9.7 years. We found greater accuracy of measurements from MRI scans acquired after chemotherapy than from those acquired before che-motherapy. For both pre-chemotherapy and post-chemotherapy MRI, the greatest accuracy was achieved with the non-enhanced T1 sequence. There was no benefit to gadolinium enhancement. The median difference between T1 MRI and histological measurements was 19.0 mm (interquartile range [IQR], 4.3 to 32.8 mm) before chemotherapy and 5.0 mm (IQR, 2.0 to 13.0 mm) after chemotherapy. Adding a minimum margin of 20 mm to the limit of the tumor on post-chemotherapy T1 MRI always led to safe histological margin.
Conclusions: Post-chemotherapy MRI provided a more accurate assessment of the limits of Ewing sarcoma. Surgical planning can therefore be based on post-chemotherapy MRI. Surgical cuts can be, at minimum, 20 mm from the limits as seen on MRI.
E
wing sarcoma is the second-most common type ofmalignant bone tumor in children1
. Conventional treatment includes neoadjuvant chemotherapy, local treatment, and adjuvant chemotherapy. Local treatment may consist of surgical resection and/or radiation therapy2
. When possible, resection within healthy margins seems preferable to radiation therapy alone3,4
. Enneking5defined
resection areas as “radical,” “wide,” “marginal,” and “in-tralesional.” Because of the importance of neoadjuvant chemotherapy in reducing the size of the tumor, the re-quired size of the margins has come under reconsideration. The issue remains controversial in the literature. In a review of 244 patients, Ozaki et al. found no significant difference
between adequate (radical and wide) and inadequate (marginal and intralesional) margins with respect to the local relapse rate and overall survival after surgery6
. In a review of 64 patients, Lin et al. assessed local control ac-cording to whether the margins were 0 to 2 mm, 3 to 9 mm, or‡10 mm7
. They found a trend toward better local control with wider as opposed to narrower margins, although this did not reach significance.
Magnetic resonance imaging (MRI), by improving the assessment of tumor limits8
, is the gold standard for plan-ning surgical margins. During the treatment of Ewing sar-coma, 3 MRI studies are generally performed: the first, at diagnosis, before the start of neoadjuvant chemotherapy; the
Planning
for Bone Excision in Ewing Sarcoma
Post-Chemotherapy
MRI More Accurate Than Pre-Chemotherapy
MRI
Assessment
Camille The´venin-Lemoine, MD, Louise Destombes, MD, Julie Vial, MD, Matthieu Wargny, MD,
Paul Bonnevialle, MD, PhD, Yan Lefevre, MD, Anne Gomez Brouchet, MD, PhD, and J´erome Sales de Gauzy, MD, PhD
second, during the course of chemotherapy; and the third, at the end of neoadjuvant chemotherapy, before local treat-ment. The intraosseous signal anomalies found on MRI may be related to tumor development but also to perilesional inflammation. Neoadjuvant chemotherapy can alter the signals of both the inflammation and tumor regions, but to an extent that is not known. It also remains unknown whether bone resection should be carried out at the level defined on the initial pre-chemotherapy MRI or as defined on the post-chemotherapy MRI, with the latter typically supporting a lesser and better defined resection. The current recommendation is to decide the limits of surgical resection using pre-chemotherapy MRI9,10
to avoid the risk of con-taminated resection margins.
The primary objective of this study was to determine which MRI study was more reliable for determining tumor extent: MRI performed pre-neoadjuvant chemotherapy or performed post-neoadjuvant chemotherapy. The secondary objective was to determine the most suitable MRI sequence. We compared the assessment of tumor limits on pre-chemotherapy and post-pre-chemotherapy MRI with the limits as evaluated on histological analysis of the resected specimen.
Materials and Methods
T
his was a single-center, retrospective study including pa-tients treated for Ewing sarcoma of a long bone between March 2005 and June 2015. Excluded were patients with a bone resection margin that was contaminated (classified as R1 orR2), because histological tumor limits could not be deter-mined, or those with a pathological fracture, because the modification of bone orientation could result in noncompa-rable radiographic measurements.
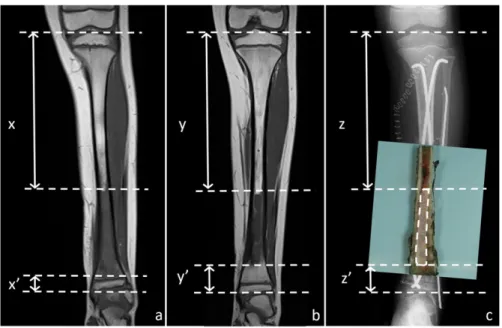
An analysis of pre-chemotherapy and post-chemotherapy MRI scans was performed in a standardized manner by a senior radiologist. Three sequences were studied: weighted, T1-weighted with contrast enhancement by gadolinium injection, and a fluid-sensitive sequence (STIR [short tau inversion re-covery] or proton-density-weighted with fat saturation [PD fat-sat]) (Fig. 1). For each sequence, we determined the tumor extent as delineated by abnormal compared with normal signal on the coronal sections. We considered that it was not possible to determine the difference between edema and tumor by MRI signal changes, so we therefore included all signal abnormalities. Once the tumor extent was determined, we measured the dis-tance between the proximal and distal limits of the abnormal signal within the bone and the corresponding bone end (Figs. 2-A and 2-B). The extension into the soft tissues was not part of the evaluation. These MRI measurements were performed for the study and were independent from the measurements used for surgical planning.
Histological analysis was performed by an experienced bone-tumor pathologist. We defined the limits of the tumor as the area beyond which the tissue was normal, i.e., without necrotic tumor and without a scar area that could contain tumor stigma as foamy macrophages orfibrous regions. On the resected specimen, we measured the distance between the tu-mor limits (proximal and distal) and the corresponding bone
Fig. 1
Ewing sarcoma of the left femur in an 11-year-old boy, as demonstrated on pre-chemotherapy T1-weighted MRI (Fig. 1-A), post-chemotherapy T1-weighted MRI (Fig. 1-A’), pre-chemotherapy STIR MRI (Fig. 1-B), post-chemotherapy STIR MRI (Fig. 1-B’), pre-chemotherapy T1-weighted MRI with gadolinium enhancement (Fig. 1-C), and post-chemotherapy T1-weighted MRI with gadolinium enhancement (Fig. 1-C’).
ends. When the end included the epiphysis, this histological measurement was sufficient. When the end was a bone cut, we added to the histological measurement the distance between the bone cut and the end of the residual bone as measured on postoperative computed radiography. The sum of these 2 dis-tances corresponded to the distance of the tumor relative to the bone end (Fig. 2-C).
To evaluate MRI accuracy in determining the tumor limit, we chose to study the difference between each MRI measurement and the reference histological measurement. Thus, this difference was not dependent on bone length. Values were scored negative when the MRI limit was in a healthy zone relative to the histological limit and were scored positive when the MRI limit was within the tumor area.
Statistical Analysis
For descriptive analyses, we report frequencies and percentages for categorical variables and the median and interquartile range (IQR) for quantitative variables. We used the 1-sample Wilcoxon paired test to compare the results between pre-chemotherapy and post-chemotherapy. The concordance between values of the different measures was assessed using Bland and Altman plots and Spear-man correlation coefficients. Analyses were performed using R software (version 3.0.1; R Foundation for Statistical Computing).
Results
T
wenty-two patients with Ewing sarcoma of a long bone were initially included. However, 2 patients were ex-cluded, 1 because of a pathological fracture and 1 because ofan intralesional resection (R2). In the latter case, pre-chemotherapy and post-pre-chemotherapy MRI showed signal abnormalities where the surgical cut was made. It was therefore not a failure of MRI to identify the tumor limits. We analyzed the data of 20 patients, 15 children and 5 adults, with a median age at diagnosis of 9.7 years (range, 3 to 38 years). In 6 cases, the tumor was located on the femur; in 5, thefibula; in 5, the tibia; and in 4, the humerus. In some cases, mea-surements were not feasible for all of the sequences studied because of the quality of the images. Thus, of the 40 possible measurements for each sequence at each MRI assessment period, we report measurements from 38 T1, 36 STIR,
and 36 T1 1 gadolinium-enhanced sequences from
pre-chemotherapy MRI and 39 T1, 35 STIR, and 39 T1 1
gadolinium-enhanced sequences from post-chemotherapy MRI. The median duration between pre-chemotherapy MRI and surgery was 161 days (range, 93 to 315 days). The median duration between post-chemotherapy MRI and surgery was 13 days (range, 1 to 60 days).
Table I lists the difference between the MRI measurement (distance between the signal abnormalities and the corre-sponding bone end) and the histological measurement (distance between the proximal or distal extent of the tumor and the corresponding bone end) by MRI sequence for each patient.
We compared the distribution of the absolute values of these differences for all sequences studied and found greater accuracy of the measurements made using post-chemotherapy MRI compared with pre-chemotherapy MRI (Table II). The greatest accuracy was found for the nonenhanced T1
Fig. 2
Ewing sarcoma of the left tibia in an 8-year-old boy. Fig. 2-A Pre-chemotherapy T1-weighted MRI. The distance between the proximal end of the bone and the proximal limit of the tumor (x) and the distance between the distal end of the bone and the distant limit of the tumor (x’) are indicated. Fig. 2-B Post-chemotherapy T1-weighted MRI. The distance between the proximal end of the bone and the proximal limit of the tumor (y) and the distance between the distal end of the bone and the distant limit of the tumor (y’) are indicated. Fig. 2-C Histological measurements are shown. In this case, the proximal (z) and distal (z’) measurements represent the distance between the respective tumor limit and the bone cut on the surgical specimen added to length of the residual bone as measured on computed radiograph.
TABLE I Difference Between MRI Measurement and Histological Measurement, by MRI Sequence*
Difference(mm)
Pre-Chemotherapy Post-Chemotherapy
Patient Age(yr) T1 STIR T11 Gado. T1 STIR T11 Gado.
1 10 Proximal 223 222 222 213 215 215 Distal 28 228 234 24 24 24 2 6 Proximal 220 224 224 28 212 26 Distal 221 234 235 28 27 211 3 10 Proximal 25 211 3 1 0 Distal 229 236 215 213 29 4 5 Proximal 242 246 241 236 234 232 Distal 24 21 22 2 1 1 5 11 Proximal 213 269 262 21 22 24 Distal 213 213 246 26 25 28 6 9 Proximal 22 211 23 24 23 22 Distal 4 27 3 1 2 1 7 9 Proximal 21 0 2 4 22 4 Distal 241 230 226 214 212 7 8 3 Proximal 233 229 235 21 214 210 Distal 267 277 275 218 225 216 9 6 Proximal 25 28 25 22 22 Distal 20 215 2 1 210 10 8 Proximal 276 276 278 0 1 0 Distal 263 263 261 15 15 15 11 13 Proximal 212 29 28 28 Distal 234 224 217 218 12 38 Proximal 232 238 240 221 218 221 Distal 226 219 228 225 222 222 13 14 Proximal 1 245 248 0 212 25 Distal 14 4 Proximal 232 242 242 28 213 220 Distal 218 217 219 0 24 21 15 9 Proximal 25 27 28 22 0 0 Distal 234 289 281 249 257 257 16 8 Proximal 224 234 234 28 27 25 Distal 274 271 249 6 27 29 17 24 Proximal 2 222 220 25 28 27 Distal 218 218 210 213 211 215 18 27 Proximal 2 220 26 21 24 219 Distal 22 22 22 22 22 22 19 23 Proximal 0 23 27 0 1 1 Distal 60 53 51 25 28 214 20 32 Proximal 22 22 22 22 22 22 Distal 234 228 242
*Difference between the MRI measurement (distance between the signal abnormalities and the corresponding bone end) and the histological measurement (distance between the proximal or distal extent of the tumor and the corresponding bone end) for each MRI sequence. STIR = short tau inversion recovery, and gado. = gadolinium.
sequences. There seemed to be no benefit from the addition of a contrast medium.
We then conducted a categorical analysis of the differ-ences between MRI and histological measurements, with the differences categorized as follows:£210 mm, >210 to 0 mm, and >0 mm (Table III). For each MRI sequence, we also report the minimum and maximum difference between the MRI and histological measurements.
Using a threshold of 210 mm, the categorical analysis demonstrated a trend similar to that of an analysis of the average of the absolute values: values of£210 mm were more common for the pre-chemotherapy measurements. MRI limits within the tumor area were slightly more common for the post-chemotherapy measurements but with much lower maximum values than for the pre-chemotherapy measurements (15 mm post-chemotherapy compared with values ranging from 51 to 60 mm pre-chemotherapy). On pre-chemotherapy MRI, the overvaluation of the tumor limits was sometimes important, up to 76 mm for the T1 sequence, with 4 values of >50 mm. In 2 cases, there was an underestimation corresponding to tumor progression during the course of chemotherapy (Fig. 3). On post-chemotherapy MRI, the underestimation of the tumor limits was always£15 mm.
Finally, we report the results as Bland and Altman plots, which demonstrate greater accuracy of post-chemotherapy
TABLE II Quantitative Analysis of Differences between MRI and Histological Measurements
Absolute Value of Difference*(mm)
Pre-Chemotherapy Post-Chemotherapy P Value
MRI sequence
T1 (n = 38) 19.0 (4.3-32.8) 5.0 (2.0-13.0) <0.0001
STIR (n = 34) 26.0 (11.5-44.3) 7.0 (2.0-13.0) <0.0001
T11 gadolinium (n = 36) 25.0 (6.8-43.0) 7.5 (2.0-15.0) <0.0001
*The values are given as the median with the interquartile range in parentheses.
TABLE III Categorical Analysis of Differences Between MRI and Histological Measurements
£210 mm >210 to 0 mm >0 mm
Min./Max. Difference(mm)
No. % No. % No. %
Pre-chemotherapy T1 (n = 38) 22 58% 10 26% 6 16% 276/60 STIR (n = 36) 27 75% 8 22% 1 3% 289/53 T11 gadolinium (n = 36) 23 64% 9 25% 4 11% 281/51 Post-chemotherapy T1 (n = 39) 11 28% 21 54% 7 18% 249/15 STIR (n = 35) 14 40% 15 43% 6 17% 257/15 T11 gadolinium (n = 39) 15 38% 18 46% 6 15% 257/15 Fig. 3
Ewing sarcoma of the left femur in a 23-year-old woman. Fig. 3-A Pre-chemotherapy T1-weighted MRI. Fig. 3-B Post-Pre-chemotherapy T1-weighted MRI, showing obvious tumor progression during the course of chemotherapy.
assessment (Fig. 4). The Spearman correlation coefficients for the MRI-based measurements in relation to the histological measurements were high: before chemotherapy, 0.96 for T1, 0.94 for STIR, and 0.94 for T11 gadolinium enhancement; and after chemotherapy, 0.98, 0.98 and 0.99, respectively (p < 0.0001 for all).
There were epiphyseal signal abnormalities in 12 cases on pre-chemotherapy MRI, and in 8 of those cases, abnormal signal persisted on post-chemotherapy MRI. However, pathological evaluation revealed epiphyseal extension of the tumor in only 2 of the 8 cases; in the remaining 6 cases, no
epiphyseal abnormality was observed. Among the 4 cases in which the anomaly of epiphyseal signal was normalized on post-chemotherapy MRI, 1 resection with epiphyseal preser-vation was carried out, with R0 margins on pathological evaluation. This would not have been possible with surgical cuts planned according to pre-chemotherapy MRI (Fig. 5). In the 3 other cases, the epiphyseal bone pathology was strictly normal.
No local recurrence was diagnosed in any of the patients included in this study at the time of the latest follow-up (mean follow-up of 68 months; range, 24 to 111 months).
Fig. 4
Bland and Altman plots of MRI-based measurements compared with measurements made by an anatomopathologist (AP). The continuous red line indicates the average difference (diff) between the considered MRI measurements and histological measurements. The dashed red lines indicate 2 standard deviations above and below the average difference.
Discussion
W
e found excellent correlation between MRI and histo-logical analysis in the assessment of tumor limits. Similar results were presented by Panuel et al.11. Their study included 22 children (5 with Ewing sarcoma and 17 with osteosarcoma). Pathological analyses were compared with MRI performed up to 3 weeks before surgery. A transphyseal extension was evident on MRI in 13 cases (12 of the 17 patients with osteosarcoma and 1 of the 5 with Ewing sarcoma), which corresponded in all cases to an extension found histologically. There were no false-positive or false-negative cases. They recommended using primarily T1 sequences. Bloem et al.8
compared the length of the tumor as measured on MRI with that of the histological specimen for 56 patients (including 27 with osteosarcoma, 14 with chondrosar-coma, and 10 with Ewing sarcoma). MRI measurements were acquired using T1 and T2 sequences; the timing of MRI in re-lation to neoadjuvant chemotherapy was not specified. The correlation coefficient was 0.99. The most precise type of se-quence was not investigated.
The current study validates the use of post-chemotherapy MRI to determine the tumor limits during the planning of bone cuts in the management of Ewing sar-coma. We found that the best sequence to determine the tu-mor limits was T1-weighted. Our results did not show any benefit of gadolinium enhancement. STIR sequences over-estimated tumor limits because of their susceptibility to
in-flammatory abnormalities. These results are similar to those of Panuel et al.11
. In our series, growth-plate signal abnor-malities on pre-chemotherapy MRI disappeared after che-motherapy in 4 cases. This allowed surgery preserving the epiphysis in 1 case (Fig. 5).
Planning the resection using post-chemotherapy MRI allows for the possibility of tumor progression during the course of chemotherapy. In the case of progression, planning based on pre-chemotherapy MRI may lead to an incomplete resection. In our series, pre-chemotherapy MRI undervalued the tumor limit for 2 patients, with a difference of 20 mm for one and 60 mm for the other (Fig. 3). Similarly, there is sometimes a period of several weeks between the initial MRI and the beginning of chemotherapy, particularly when a problem of biopsy analysis arises. The tumor may progress in the meantime. Again, the initial MRI may undervalue the length of the bone segment to be resected.
Our study had limitations. This was a retrospective study, with a small number of cases (n= 20). However, this did not prevent the demonstration of significant differences between pre-chemotherapy and post-chemotherapy MRI measure-ments (Table II). In this study, we dealt only with bone limits. Therefore, our results do not suggest on which MRI to base planning regarding the extension to soft tissues. In addition, we chose not to analyze the tumor limit on MRI in the sagittal plane because we thought that measurements were less
Fig. 5
Ewing sarcoma of the right femur in a 3-year-old girl. Fig. 5-A Pre-chemotherapy T1-weighted MRI, showing epiphyseal signal abnormalities. Fig. 5-B Post-chemotherapy T1-weighted MRI, showing complete normalization of epiphyseal signal. Fig. 5-C Radiograph made 3 years after surgery. The epiphysis was preserved with healthy margins.
reproducible than in the coronal plane and that it would not dramatically improve accuracy. Finally, the time when the MRI was performed was variable, which may have affected the ac-curacy of the measurements.
We chose to study only Ewing sarcoma and not osteo-sarcoma, as inflammatory peri-tumor phenomena vary be-tween the 2 types. They are often more important in Ewing sarcoma, which makes the choice of resection limits more difficult. These non-mass-like areas with abnormal MR signal intensity are often qualified as inflammation or edema. However, we know that there may be tumor cells in those areas. Masrouha et al.12
reported on 30 cases (27 osteosarcoma and 3 Ewing sarcoma) in which they found that 17.4% of these areas were positive for tumor (viable or necrotic). That is why we included all signal abnormalities in the MRI analysis.
Improving the accuracy of the assessment of tumor limits can permit reduction of safety margins. The objective is to expand the possibilities for epiphyseal conservation, for better durability of function of the reconstructed limb. Be-cause of the possibility of the presence of tumor cells away from the main tumor, it seems necessary to maintain a margin beyond the limit suggested by post-chemotherapy MRI. We recommend a minimum margin of 20 mm, which, in our series, always allowed a resection in a healthy area. This rec-ommendation is valid when there is no anatomical barrier separating the resection limit from the tumor. However, it can probably be further reduced when there is an anatomical barrier such as the physis. Previous studies showed the ca-pacity of the physis to act as a barrier, limiting tumor exten-sion13,14
, although it can sometimes be crossed11
. It is important to underline that the objective of the present study was to correlate MRI with histological evaluation, not to de-termine the amount of margin necessary. Despite there being no local recurrence among our patients, additional studies are needed to highlight prognostic factors.
References
1. Unni KK, editor. Dahlin’s bone tumors: general aspects and data on 11,087 cases. 5th ed. Philadelphia: Lippincott-Raven; 1996. p 92.
2. Werier J, Yao X, Caudrelier JM, Di Primio G, Ghert M, Gupta AA, Kandel R, Verma S. A systematic review of optimal treatment strategies for localized Ewing’s sarcoma of bone after neo-adjuvant chemotherapy. Surg Oncol. 2016 Mar;25(1):16-23. Epub 2015 Dec 11.
3. Givens SS, Woo SY, Huang LY, Rich TA, Maor MH, Cangir A, Murray JA, Oswald MJ, Peters LJ, Jaffe N. Non-metastatic Ewing’s sarcoma: twenty years of experience suggests that surgery is a prime factor for successful multimodality therapy. Int J Oncol. 1999 Jun;14(6):1039-43.
4. Oberlin O, Deley MC, Bui BN, Gentet JC, Philip T, Terrier P, Carrie C, Mechinaud F, Schmitt C, Babin-Boillettot A, Michon J; French Society of Paedi-atric Oncology. Prognostic factors in localized Ewing’s tumours and peripheral neuroectodermal tumours: the third study of the French Society of Paediatric Oncology (EW88 study). Br J Cancer. 2001 Nov 30;85(11):1646-54. 5. Enneking WF. A system of staging musculoskeletal neoplasms. Clin Orthop Relat Res. 1986 Mar;204:9-24.
6. Ozaki T, Hillmann A, Hoffmann C, R¨ube C, Blasius S, Dunst J, J¨urgens H, Winkelmann W. Significance of surgical margin on the prognosis of patients with Ewing’s sarcoma. A report from the Cooperative Ewing’s Sarcoma Study. Cancer. 1996 Aug 15;78(4):892-900.
7. Lin PP, Jaffe N, Herzog CE, Costelloe CM, Deavers MT, Kelly JS, Patel SR, Madewell JE, Lewis VO, Cannon CP, Benjamin RS, Yasko AW. Chemotherapy response is an important predictor of local recurrence in Ewing sarcoma. Cancer. 2007 Feb 1;109(3):603-11.
8. Bloem JL, Taminiau AH, Eulderink F, Hermans J, Pauwels EK. Radiologic staging of primary bone sarcoma: MR imaging, scintigraphy, angiography, and CT correlated with pathologic examination. Radiology. 1988 Dec;169(3):805-10. 9. Gerrand C, Athanasou N, Brennan B, Grimer R, Judson I, Morland B, Peake D, Seddon B, Whelan J; British Sarcoma Group. UK guidelines for the management of bone sarcomas. Clin Sarcoma Res. 2016 May 4;6:7.
10. Jones KB, Ferguson PC, Lam B, Biau DJ, Hopyan S, Deheshi B, Griffin AM, White LM, Wunder JS. Effects of neoadjuvant chemotherapy on image-directed planning of surgical resection for distal femoral osteosarcoma. J Bone Joint Surg Am. 2012 Aug 1;94(15):1399-405.
11. Panuel M, Gentet JC, Scheiner C, Jouve JL, Bollini G, Petit P, Bourliere-Najean B, Devred P. Physeal and epiphyseal extent of primary malignant bone tumors in childhood. Correlation of preoperative MRI and the pathologic examination. Pediatr Radiol. 1993;23(6):421-4.
12. Masrouha KZ, Musallam KM, Samra AB, Tawil A, Haidar R, Chakhachiro Z, Saghieh S, Abdallah A, Saab R, Muwakkit S, Abboud MR, Khoury NJ. Correlation of non-mass-like abnormal MR signal intensity with pathologicalfindings surrounding pediatric osteosarcoma and Ewing’s sarcoma. Skeletal Radiol. 2012 Nov;41 (11):1453-61. Epub 2012 Mar 10.
13. Cañadell J, Forriol F, Cara JA. Removal of metaphyseal bone tumours with preservation of the epiphysis. Physeal distraction before excision. J Bone Joint Surg Br. 1994 Jan;76(1):127-32.
14. Sales de Gauzy J, Lafontan V, Urse¨ı M, Accadbled F. Ewing sarcoma of the acetabulum in children: a“growth plate-based” surgical strategy. J Pediatr Orthop. 2014 Apr-May;34(3):326-30.
In summary, the results of our study contradict the conventional recommendation: the determination of Ewing sarcoma bone tumor limits as assessed on post-chemotherapy MRI seems more accurate than limits as-sessed on pre-chemotherapy MRI. We therefore recommend planning for bone excision in Ewing sarcoma using post-chemotherapy MRI.
NOTE: The authors thank Marion Seignan for her assistance in the production of the figures.
Camille The´venin-Lemoine, MD1 Louise Destombes, MD1 Julie Vial, MD1 Matthieu Wargny, MD2 Paul Bonnevialle, MD, PhD2 Yan Lefevre, MD3
Anne Gomez Brouchet, MD, PhD4
J´erome Sales de Gauzy, MD, PhD1
1Departments of Pediatric Orthopaedics (C.T.-L. and J.S.d.G.) and
Radiology (L.D. and J.V.), Hˆopital des Enfants, Toulouse-Purpan University Hospital, Toulouse, France
2Departments of Epidemiology and Public Health (M.W.) and
Orthopaedics and Trauma (P.B.), Toulouse-Purpan University Hospital, Toulouse, France
3Department of Pediatric Orthopaedics, Hˆopital des Enfants, Bordeaux
University Hospital, Bordeaux, France
4Department of Pathology, IUCT-Oncopole, University of Toulouse,
Toulouse, France
E-mail address for C. The´venin-Lemoine: [email protected]