En vue de l'obtention du
DOCTORAT DE L'UNIVERSITÉ DE TOULOUSE
Délivré par :Institut National Polytechnique de Toulouse (INP Toulouse) Discipline ou spécialité :
Agrosystèmes, Écosystèmes et Environnement
Présentée et soutenue par :
M. ANDRE SCHWANCKle lundi 9 mai 2016
Titre :
Unité de recherche : Ecole doctorale :
IDENTIFICATION DE PREDICTEURS EPIDEMIOLOGIQUES POUR LA
RESISTANCE QUANTITATIVE: APPLICATION AU PATHOSYSTEME
TOURNESOL-PHOMA
Sciences Ecologiques, Vétérinaires, Agronomiques et Bioingénieries (SEVAB) AGroécologie, Innovations, TeRritoires (AGIR)
Directeur(s) de Thèse : MME LAETITIA WILLOCQUET
Rapporteurs :
M. DIDIER ANDRIVON, INRA RENNES M. JEAN CARLIER, CIRAD MONTPELLIER
Membre(s) du jury :
1 M. CLAUDE DE VALAVIEILLE-POPE, INRA VERSAILLES GRIGNON, Président
2
Acknowledgments / Agradecimentos / Remerciements
I want to thank my adviser Laetitia, for all her guidance and patient during these three and half years, and for trusting on my work and capacity since my arrival. I am deeply thankful for all the time spent together, for all your efforts in
showing me what the features of a good scientist are.
Another important person is Serge, who I want to thank for being almost a co-adviser in my Ph.D. Thank you, Serge, for everything.
I would like to thank my Ph.D. committee for their efforts in improving my study: Alain Palloix, Emerson Del Ponte, Emmanuelle Mestries, Patrick Vincourt, Philippe Debaeke, Serge Savary and Thierry Marcel.
I also would like to thank the members of the Jury: Claude de Valavieille-Pope, Didier Andrivon, Grégory Dechamp-Guillaume and Jean Carlier.
Quero agradecer ao professor Emerson, com quem sempre pude contar nesse período aqui, trabalhando nos artigos do mestrado, quando tive o privilégio da sua orientação. Boa parte do profissional que sou é sua obra. Eu espero
que minha tese de doutorado seja de sua aprovação.
Je tiens à remercier mes collègues de l'INRA, spécialement ceux de l'équipe VASCO. Notamment, je tiens à remercier Philippe et Patrick, qui ont contribué à ma formation et mon travail.
Sem dúvida a companhia de brasileiros aqui no INRA ajudou muito a amenizar a saudade do Brasil e da família. Em ordem cronológica: Tiago, Piérri, Leandro, Alaerson/Darliane e Antonio, eu fui muito feliz em ter vocês por aqui. Tenho muito orgulho de ter passado esse tempo aqui com vocês, todos bons profissionais e boas pessoas, bons
amigos e exemplos para mim.
Thank you, Aurélien, for being a good colleague and friend.
Un grand merci à tous mes collègues de l'école doctorale en particulier Clément, Hélène, Bochra, Marion et Ariane. Je vous remercie profondément pour tous les moments de détente que nous avons partagés ensemble,
ces dîners, « ces bières », ces rigolades...
I want to thank Jay Ram for all good phytopathological conversations we had in our lunch time here at INRA. You are a great life example and good friend to me.
Agradeço à Maria Martha e sua família, por me encorajarem a seguir o doutorado em Toulouse.
My Ph.D. played on three languages, and it was quite a challenge to me. I want to thank Oxford University Press for providing free-online access to the dictionaries and thesaurus.
Naturally, missing family and friends was a frequent feeling and also a challenge. I want to thank Priit Kasesalu and Jaan Tallinn for inventing Skype software.
Agradeço ao Conselho Nacional de Desenvolvimento Científico e Tecnológico pelo financiamento. Agradeço o apoio da minha família: minha mãe, pai, irmã, irmão, cunhada e sobrinhos (Davi e Augusto), que são
importantes e inspiradores para mim. A companhia de vocês é o melhor que o mundo me proporciona. Eu dedico minha tese ao meu sobrinho Davi Schwanck e a minha avó materna Ana Elisa da Silva. Enquanto aqui em
Toulouse, um veio ao mundo, e a outra o deixou. O exemplo deles está sempre comigo.
You were all essencial on my Ph.D. / Vocês foram essenciais para meu doutorado. / Vous étiez
3
TABLE DE MATIÈRE
INTRODUCTION ... 5
HOST PLANT RESISTANCE ... 5
MONOCYCLIC EPIDEMICS ... 6
QUANTITATIVE RESISTANCE AGAINST PATHOGENS ASSOCIATED WITH MONOCYCLIC EPIDEMICS ... 7
PHOMA BLACK STEM ... 7
OBJECTIVES OF THE PH.D. THESIS AND OUTLINE OF THE PH.D.DISSERTATION ... 8
1. Exploring spatiotemporal patterns of phoma black stem in sunflower ... 11
1.1.ABSTRACT ... 11
1.2.INTRODUCTION ... 11
1.3.MATERIALS AND METHODS ... 13
1.3.1. Spatiotemporal experiments ... 13
1.3.2. Disease gradient experiments ... 15
1.4.RESULTS ... 16
1.4.1. Spatiotemporal experiments ... 17
1.4.2 Disease gradient experiments ... 25
1.5.DISCUSSION ... 26
1.6.ACKNOWLEDGEMENTS ... 28
2. Effects of plant morphological traits on phoma black stem in sunflower...29
2.1.ABSTRACT...29
2.2.INTRODUCTION ... 30
2.3.MATERIALS AND METHODS ... 31
2.3.1. Experimental design and general features ... 31
2.3.2. Plant material ... 32
2.3.3. Disease assessments ... 33
2.3.5. Data analysis ... 36
2.4.RESULTS ... 39
2.4.1. Overview of disease intensity and morphological traits ... 39
2.4.2. Association between disease variables and definition of disease groups ... 41
2.4.3. Association between morphological variables and definition of morphological groups ... 44
2.4.4. Associations between disease intensity and morphological traits ... 47
2.5.DISCUSSION ... 49
2.5.1. Experimental framework, protocols of assessment and features of variables measured... 49
2.5.2. Relationships between phoma black stem intensity and morphological attributes of sunflower ... 50
2.5.3. Implications for morphological and disease assessment and for breeding ... 52
2.6.ACKNOWLEDGMENTS ... 52
3. Predicting quantitative host plant resistance against phoma black stem in sunflower ... 54
3.1.ABSTRACT ... 54
3.2.INTRODUCTION ... 55
3.3.MATERIALS AND METHODS ... 57
3.3.1. Overview of the experiments ... 57
3.3.2. Sunflower genotypes ... 57
3.3.3. Growth chamber experiments on seedlings ... 59
3.3.4. Greenhouse experiments on adult plants ... 60
4
3.3.6. Data analysis ... 63
3.4.RESULTS ... 65
3.4.1. Overview of the data set and variable selection ... 65
3.4.2. Pairwise correlations among predictors ... 67
3.4.3. Prediction of field disease intensity ... 69
3.5.DISCUSSION ... 74
3.6.ACKNOWLEDGEMENTS ... 79
DISCUSSION ... 81
MAIN FINDINGS ... 81
BROAD APPLICATIONS OF THIS WORK: METHODOLOGICAL ASPECTS ... 82
KNOWLEDGE GAPS ON PHOMA BLACK STEM AND PERSPECTIVES ... 84
REFERENCES ... 86
5
INTRODUCTION Host plant resistance
Host plant resistance (HPR) is an environment-friendly and low-cost technology for disease management (e.g., McDonald and Linde, 2002; Poland et al 2009; Brown 2015). HPR can be classified according to two general categories: (i) complete or qualitative resistance and (ii)
incomplete or quantitative resistance (e.g., Poland et al. 2009). Qualitative resistance is
expressed as the absence of disease, and is generally governed by single major genes for resistance (R genes; Poland et al. 2009). Qualitative resistance is prone to the "boom and bust" cycle that occurs when resistance is overcome by pathogen populations that progressively adapt to the deployed HPR (e.g., McDonald and Linde 2002). Quantitative (or partial) HPR, on the other hand, is expressed as a reduction in disease, and is often conditioned by multiple minor genes (Poland et al. 2009). Quantitative resistance is conditioned by quantitative trait loci (QTLs), which are portions of chromosomes that include a gene that contributes significantly to the expression of a quantitative trait (Lannou et al. 2012). Quantitative HPR has been associated to a higher durability as compared to qualitative HPR (Parlevliet 2002; Mundt 2014; Zhan et al. 2015). Quantitative HPR therefore represents a critical component when aiming at developing sustainable agricultural production systems (e.g., Poland et al. 2009; Savary and Willocquet, 2014).
The particular easiness in selection of qualitative resistance, due to the phenotypic contrast it involves (absence or not of symptoms), makes this type of resistance the basis of most breeding programs worldwide (Vale et al. 2001; Stuthman et al. 2007). However, attention on quantitative resistance has increased as a result of its higher durability (Zhan et al. 2015; Mundt et al. 2014), and of its genetic identification and tracking which is now technically possible (e.g., StClair 2010). The need to develop high quality phenotyping analysis and screening methodologies for quantitative resistance has been recently advocated (e.g. St Clair 2010; Mundt et al. 2014; Brown 2015).
From an epidemiological perspective, quantitative resistance reduces the rate of speed of epidemics by affecting one or several components of the disease cycle (Parlevliet 1979). These
components of resistance (Zadoks 1972; Parlevliet 1979) can be measured, through monocyclic
experiments (Zadoks and Schein 1979) involving host genotypes expressing a range of quantitative resistance. Low infection efficiency, long latency period, small lesions, low number of propagules per lesion, short infectious period, for example, are considered components of
6
quantitative resistance and the slow development of an epidemic is a consequence of these components acting alone or in combination (Parlevliet 1979; Mundt 2014).
QTLs driving other quantitative traits [e.g. plant morphological traits] can also affect disease through disease escape (or avoidance) processes (Ando et al. 2007; Poland et al. 2009; Andrivon, et al. 2013; Srinivasachary et al. 2013). Thus, identifying morphological traits that are associated with reduced disease intensity, through plant phenotyping, can represent a useful basis for plant breeding for resistance.
Components of resistance and plant morphological traits can be considered as potential
predictors of quantitative resistance [e.g. desirable host plant traits, phenotyping targets] for
plant breeding programs.
Monocyclic epidemics
Epidemics have been classified into two broad categories based on disease progress processes:
simple interest and compound interest epidemics (e.g., Van der Plank 1965; Zadoks and Schein
1979). In simple interest epidemics, only one cycle of infection occurs per growing season. These have been referred to as monocyclic epidemics (Zadoks and Schein 1979). By contrast, a polycyclic epidemic is characterized by the occurrence of secondary infections during the course of the growing seasons, which originate from lesions produced from primary or secondary infections (Zadoks and Schein 1979; Campbell and Madden 1990). Knowledge on disease cycle constitutes fundamental information in plant pathology. Literature in plant epidemiology brings a range of spatiotemporal experimental and analytical methods that allow inferring on the occurrence of secondary cycles in crop diseases (e.g. Campbell and Madden 1990; Madden et al. 2007).
When considering monocyclic epidemics, primary inoculum is crucial for field epidemics. Disease cycles of fungi associated to monocyclic epidemics mainly involve the production of structures resilient for overwintering/oversummering, i.e., source of inoculum for the next crop cycle (Bergamin Filho and Amorim 1996; Vidhyasekaran 2004). The cotton wilt (Fusarium
oxysporum), is an example provided by Vanderplank (1963) of a typical monocyclic disease
(Campbell and Madden 1990). F. oxysporum dissemination relies on infected seeds, contaminated water or soil, and wind (Cia and Salgado 2005), and the inoculum present in the soil at the beginning of the season remains the main source of inoculum for cotton wilt (Campbell and Madden 1990). Nevertheless, defining whether a disease is monocyclic or polycyclic is not always simple. For some diseases, the pathogen cycle is known to produce spores for potential
7
secondary infections, but the role of secondary infections in epidemics can be highly dependent on a range of factors (e.g. synchrony between spore production and crop susceptibility period; environmental effects; pathogen population). This is illustrated by two examples. Stem canker of oil seed rape (Leptosphaeria maculans Sowerby) can be associated to monocyclic epidemics (West et al. 2001). L. maculans secondary cycles, from pycnidiospores (Travadon et al. 2007), can be more frequently observed in Australia rather than in Canada and Europe, possibly due to pathogen populations aggressiveness differences (West et al. 2001). Fusarium head blight of wheat (Gibberella zeae Schwein.), in which primary infections occur on wheat spikes between flowering and soft dough, has been associated to monocyclic epidemics as well (e.g., Fernando et al. 1997; Del Ponte et al. 2004). Although G. zeae produces macroconidia on infected spikelets within the season (Trail 2009), gradient and spatiotemporal studies have suggested that no secondary cycles occur within the crop cycle (Ferdando et al. 1997; Spolti et al. 2015).
Quantitative resistance against pathogens associated with monocyclic epidemics
Assessing quantitative resistance through the concept of components of resistance was developed for air-borne fungi associated with polycyclic epidemics (Parlevliet 1979). In the case of monocyclic epidemics, such an approach is limited, since only a few components such as infection efficiency and lesion expansion can be measured. The concept of component of resistance is however still relevant in the case of pathogens associated with monocyclic epidemics, and can be mobilized in order to develop phenotyping methods for quantitative host plant resistance. The study presented in this Ph.D. dissertation exemplifies the use of the concept of components of resistance in a disease associated to monocyclic epidemics.
Phoma black stem
Phoma black stem, caused by the fungus Leptosphaeria lindquistii Frezzi (synonym Phoma
macdonaldii Boerema; MacDonald 1964), has become an important sunflower disease in France
(Debaeke and Pérès 2003). Short rotations (mainly sunflower-wheat) and reduced tillage, which were introduced in the 90s in France, may have contributed to an increase in inoculum density, leading to more severe epidemics (Debaeke and Pérès 2003; Bordat et al. 2011). The disease currently occurs in all sunflower production zones in France (Bordat et al. 2011).
Epidemic onset usually occurs after flowering, with lesions on the stem progressing from the bottom to upper leaf nodes. Typical symptoms are black lesions on the stem, localized at the leaf nodes, and expanding around and along the stem. Although phoma black stem symptoms
8
have been described, a diagram to assess disease severity on the stem has not been developed. Lesions on the stem originate from infections which take place at the trough located at the basis of the leaf petioles, or along the petioles. Lesions on the petiole or on the stem accelerate leaf senescence (Quiroz et al. 2014). Lesions on the leaf veins can be observed at the end of the crop cycle when epidemics are severe. Lesions can also develop on collars, triggering the senescence and death of the plant a few weeks before normal maturity. This is referred to as premature death or premature ripening, and can be associated with high yield losses (Donald et al. 1987; Debaeke and Pérès 2003; Seassau et al. 2010).
It is generally considered that Leptosphaeria lindquistii overwinters as pseudothecia, pycnidia, and mycelium produced on infected sunflower stubble residues (Gulya et al. 1997). In France, the main source of primary inoculum appears to consist in ascospores released from infected sunflower residues (Délos et al. 1997; Seassau et al. 2010; Bordat et al. 2011). The occurrence of pycnidia on lesions developed on the stems during the growing season were observed in the USA (McDonald 1964), and in the former Yugoslavia (Maric et al. 1988). In South West of France, however, the presence of pycnidia on black stem lesions has not been observed during epidemics (Délos et al. 1997; Bordat et al. 2011). In this area, the disease is therefore considered to be associated to monocyclic epidemics (sensu Zadoks and Schein 1979), e.g., to not involve secondary infections over the course of the crop cycle. Nevertheless, this appears to be an untested working hypothesis, since no study to our knowledge has formally explored the occurrence of secondary cycles in phoma black stem epidemics.
Sources of quantitative resistance to phoma black stem have been identified (e.g., Roustaee et al. 2000), and several quantitative traits loci (QTLs) for resistance to phoma have been characterised (Al-Chaarani et al. 2002; Bert et al. 2004; Darvishzadeh et al. 2007a), using phenotyping methods involving inoculation under controlled conditions on 10-day-old seedlings. Phenotypic variation explained by individual QTLs was moderate, ranging between 6 and 20%. However, no varieties resistant to phoma black stem have been deployed until now, and no specific disease management tools are currently deployed to control the disease.
Objectives of the Ph.D. thesis and outline of the Ph.D. dissertation
The main objective of the Ph.D. dissertation presented here was to develop and implement methods to identify predictors for quantitative resistance of host plants, using phoma black stem of sunflower as a study case. This work involved a range of complementary experimental and
9
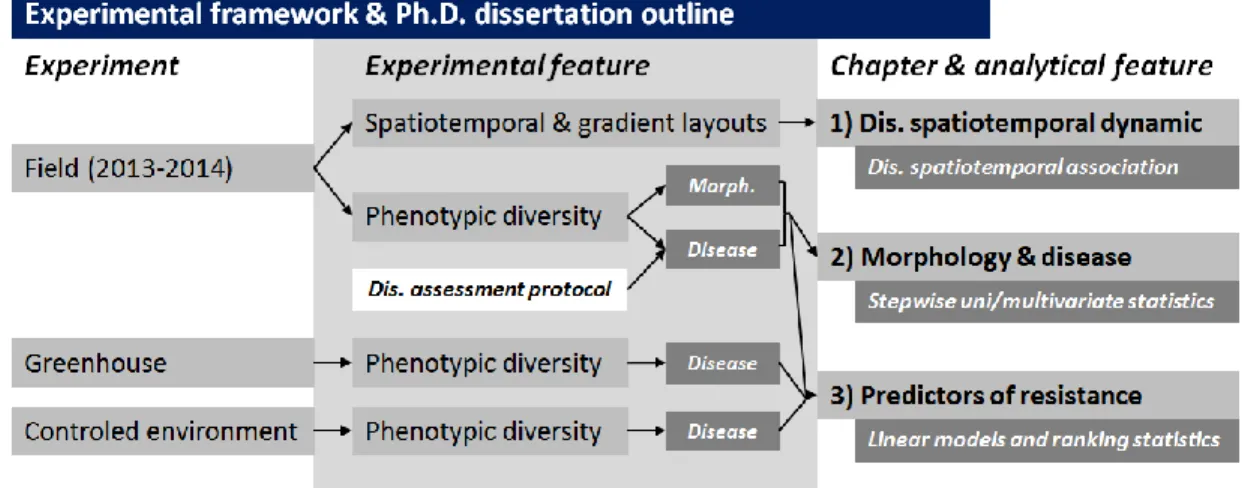
be divided into three studies, each corresponding to a chapter in this Ph.D. dissertation, as presented in Figure 1.
Figure 1. Flowchart of the experimental framework and Ph.D. dissertation outline.
The first specific objective was to explore the occurrence of secondary cycles in phoma black stem epidemics. Findings may have important implications for the management of the disease in general, and for the for host plant resistance in particular: the development of relevant phenotyping methods for HPR will depend on whether the disease is associated to monocyclic or polycyclic epidemics. Experiments were conducted in the field over two years in order to describe the (i) spatiotemporal attributes and (ii) disease gradients of phoma black stem, as well as (iii) the association between phoma black stem and defoliation. This work is presented in
Chapter 1.
The second specific objective was to (i) develop a protocol for assessment of phoma black stem in sunflower (including a sampling design and a scale for severity on stem), and (ii) to apply it to address relationships between sunflower morphological traits and phoma black stem intensity. Experiments were conducted over two years with a range of sunflower genotypes, on which both morphological traits and disease intensity features were measured, in order to assess relationships between plant morphology and disease intensity. This work is presented in Chapter
2.
The third specific objective was to identify predictors of phoma black stem resistance in the field through (i) measuring components of physiological resistance under different experimental conditions and plant ages, (ii) identifying morphological traits associated with reduced disease, and (iii) conducting complementary analyses to identify predictors best
10
associated to disease intensity in the field. This work involved replicated experiments under growth chamber, greenhouse, and field conditions involving a set of sunflower genotypes for which predictors for resistance were measured, together with disease intensity in the field. This work is presented in Chapter 3.
A last section presents a general discussion with conclusions and perspectives drawn from this work.
11
1. Exploring spatiotemporal patterns of phoma black stem in sunflower
André Aguiar Schwanck and Laetitia Willocquet
Comment: manuscript submitted to ‘Journal of Phytopathology’ journal (Online ISSN:
1439-0434). Citations in the text appear according to the journal author guidelines. 1.1. Abstract
Field experiments were conducted over two growing seasons with three sunflower cultivars to explore the spatio-temporal dynamics of Phoma black stem epidemics and to test hypotheses pertaining to (i) disease spread from a known inoculum source; (ii) spatial patterns of the disease; (iii) disease spatiotemporal association; and (iv) association between disease intensity and sunflower defoliation. The spatial patterns of disease were random in most of epidemics, and disease gradients were not detected. Our results suggest absence of secondary infections, that is, that the studied phoma black stem epidemics were monocyclic under the experimental conditions reported here. Significant associations between the number of dead leaves per plant and the number of phoma black stem lesions per plant were detected towards the end of epidemics.
1.2. Introduction
Phoma black stem is a sunflower disease caused by the fungus Leptosphaeria lindquistii Frezzi (syn. Phoma macdonaldii Boerema). The importance of this disease has increased in France at the end of the last century (Debaeke and Pérès 2003). Short rotations (sunflower-wheat) and reduced tillage, which were introduced in 90’s in France, may have contributed to amplify disease inoculum in fields and landscape, leading to more frequent and stronger epidemics (Debaeke and Pérès 2003; Bordat et al. 2011). Infections appear along the leaf petioles, or at the insertion of the petiole on the stem (stem node), and then expand around and along the stem. Typical symptoms on the stem are black lesions that are well delimited by a slight brownish halo. Lesions on the leaf veins can be observed at the end of the crop cycle under favourable conditions (Bordat et al. 2011). Lesions can also develop on collars, causing plant senescence and death a few weeks before normal maturity. This is referred to as premature death or premature ripening, and can be associated to high yield losses (Donald et al. 1987; Debaeke and Pérès 2003; Seassau et al. 2010). Although the disease has gained importance in France, no disease control methods are currently deployed against this disease.
12
It is generally considered that L. lindquistii overwinters as pseudothecia, pycnidia and mycelium produced on infected sunflower stubble residues (Gulya et al. 1997). Phoma black stem epidemic onset typically occurs at flowering, with lesions on the stem progressing from bottom to upper stem nodes (Schwanck et al. 2016). Lesions on the petiole or on the stem are associated to leaf senescence (Quiroz et al. 2014). In France, the main source of primary inoculum appears to consist in ascospores released from infected sunflower residues (Délos et al. 1997; Seassau et al. 2010; Bordat et al. 2011).The occurrence of pycnidia on lesions developed on the stems during the growing season were observed in the USA (McDonald 1964), and in the former Yugoslavia (Maric et al. 1988). In South West of France, however, the presence of pycnidia on black stem lesions has not been observed during epidemics (Délos et al. 1997; Bordat et al. 2011). In this area, the disease is therefore considered to be associated to monocyclic epidemics (sensu Van der Plank 1965; Zadoks and Schein 1979), i.e., to not involve secondary infections over the course of the crop cycle. Nevertheless, this appears to be an untested working hypothesis, since no study to our knowledge has formally explored the occurrence of secondary cycles in phoma black stem epidemics.
The characterization of spatiotemporal disease patterns and the measurement of disease or spore dispersal gradient are two complementary approaches that allow deriving hypotheses on the physical and biological mechanisms that determine disease development in time and space (e.g., Fitt et al. 1987; Madden et al. 2007). Knowledge on the spatiotemporal dynamics of plant diseases has considerable implications for disease management and for further epidemiological research, including the improvement of disease sampling strategy (e.g., Alexander et al. 2005), short or long term inoculum influence on epidemics (e.g. Nita et al. 2012), or environmental influence on epidemics (e.g. Shah et al. 2005). Statistical approaches such as Spatial Analysis by Distance IndicEs (SADIE; Perry 1995; Perry 1998) allow considering other processes that may be associated with the progress of plant disease epidemics, such as defoliation (Pethybridge et al. 2005), or the occurrence of other diseases (Pethybridge and Turechek 2003; Spolti et al. 2012). The measurement of disease gradients allows describing the occurrence and spatial range of secondary infections from a known source of inoculum artificially created (e.g., Fitt et al 1987; Campbell and Madden 1990; Madden et al. 2007). This approach further allows addressing questions on the origin of infections that build epidemics, as was done to assess the relative role of sexual or asexual spores in wheat Fusarium head blight progress (Fernando et al. 1997).
13
The objectives of this study were to describe (i) the spatiotemporal attributes and (ii) disease gradients of phoma black stem, as well as (iii) the association between phoma black stem and defoliation.
1.3. Materials and Methods
All experiments were conducted in Auzeville, near Toulouse (South-West of France), at the INRA experimental unit, in 2013 and 2014. The experiments were performed with three commercial hybrids (cultivars) currently grown in France (Schwanck et al. 2016): Kerbel, ES Paulina and NK Ferti. The experimental plots were sown at a rate of 7 seeds.m-2, on May 6 and April 15, in 2013 and 2014, respectively. Nitrogen was applied once in both years at 50 days after sowing, at a rate of 35 and 70 kg.ha-1 in 2013 and 2014, respectively. Each experimental unit consisted in a plot of six rows with a length of six meters and an inter-row space of 0.5 m, corresponding to an area of 18 m² (6 × 3 m).
Experiments were grown under rainfed conditions and weather data were collected with a weather station (CE-180, Cimel, France) located less than 400 m from the experimental site. Mean monthly temperature and accumulated rainfall were computed each year from April to September.
1.3.1. Spatiotemporal experiments
The spatiotemporal experiments involved one plot of each cultivar (Kerbel, ES Paulina and NK Ferti) in both years. All plants of the four central rows in the plots were assessed every seven days during five weeks, starting when the first phoma black stem symptoms were observed. At each assessment, the number of phoma black stem lesions and the number of dead leaves per plant were counted in all assessed plants. Furthermore, the total number of leaves per plant was counted at the first assessment. A leaf was considered dead when more than 50% of its area was not green. Coordinates (x; y) of each plant within the plot were recorded and used to construct bubble maps of the lesion density per plant with the ggplot2 package (Wickham 2009) of R software (R Core Team 2014).
Complementary analyses were performed in order to characterize the spatio-temporal patterns of phoma black stem epidemics: no single method is expected to identify all of the spatial characteristics of a given population (Madden et al. 2007). Combining different methods to analyse spatial patterns is therefore recommended (Perry et al. 2002; Madden et al. 2007). First, the Morisita’s index (Iδ) (Morisita 1962; Madden and Hughes 1995), a variance-mean
14
statistics which provides a measure of the degree of spatial aggregation for counting data, was computed as:
𝐼𝛿 =
𝑛[∑(𝑥2) − ∑ 𝑥 ] (∑ 𝑥)2− ∑ 𝑥
Where n is the number of plants and x is the number of lesions (or dead leaves) per plant.
Iδ < 1 indicates a uniform distribution; Iδ = 1 indicates a random distribution, and Iδ > 1 indicates
an aggregated distribution (Morisita 1962; Madden et al. 2007). The indexes and the chi-squared based probability test (H0: randomness) were calculated using the “dispindmorisita” function of the R vegan package (Oksanen et al. 2015).
Second, the spatial arrangement of lesions and dead leaves counts was evaluated using spatial analysis by distances (SADIE) indices (SADIE software version 1.22; Perry 1995). Similar to a correlation-based analysis, results from SADIE reflect the spatial arrangement of counting data at the sampling unit level and above (x; y coordinates) and depends on the level of heterogeneity in the dataset (Perry 1995). In SADIE, the distance to regularity, Dr, is the
minimum total distance that units (= number of lesions or dead leaves) would need to be moved to achieve the same number m in each plant, i.e., a uniform (regular) distribution. The degree of no randomness within a set of data is quantified by comparing the observed spatial pattern with rearrangements obtained after random permutations of the units among the plants. An overall index of aggregation is given by Ia = Dr ⁄ Ea, where Ea is the mean distance to regularity of the
randomized samples. An aggregation index (Ia) > 1 indicates an aggregated pattern, while indices
equal to and below 1 indicate random and regular patterns, respectively (Perry 1995; Perry 1998). Third, the Taylor’s power law (Taylor 1961; Madden et al. 2007) was used to examine the overall relationship between variance (s2) and mean (µ) of the number of lesions per plant across all
assessments and cultivars, as follows:
ln(s2) = ln(A) + b ln(µ)
where s2 is the variance, µ is the mean and ln(A) and b are the intercept and slope of the linear
model, respectively. A random pattern is expected when ln(A) = 0 and b = 1, while b >1 indicates heterogeneity among plants (aggregation; Madden and Hughes 1995; Madden et al. 2007). t-tests were performed to test the null hypothesis H0 where: ln(A) = 0 and H0: b = 1 using the “pt” function of R. Model fitness was evaluated based on the coefficient of determination (R2) with the “lm” function of R software (multiple R2 provided by the “summary” function).
Fourth, the association of the number of lesions and the number of dead leaves per plant between assessment dates was assessed through the association test of SADIE X (1: first and
15
third; 2: third and fifth; 3: first and fifth assessment; Perry et al. 1999). The association test (X) is equivalent to the correlation coefficient between cluster indices of each assessment (Perry 1999; Madden et al. 2007). Finally, the association between the number of dead leaves and the number of phoma black stem lesions was characterized for each assessment and cultivar, using the association test of SADIE (X).
1.3.2. Disease gradient experiments
The disease gradient experiments were arranged as a complete randomized block design with four replications (blocks), whereby individual plots (a cultivar within a block) represented the elementary units. Plants located at the centre of the four central rows (3 m apart from the edge of the plot, one plant per row) were inoculated 66 days after sowing (DAS) in 2013 (July 11) and 77 DAS in 2014 (July 1), corresponding to the development stage “internode between last leaf and inflorescence between 0.5 and 2 cm long” (Schneiter and Miller 1981; Merrien and Milan 1992). This pattern of source plant inoculation corresponds to a line source of inoculum (Campbell and Madden 1990). The inoculation was performed before the time where epidemic onsets generally occur. No lesions were observed at the time of inoculation, indicating that the experiment was established in absence of a background noise (Gregory 1968; Savary and van Santen 1992) of spontaneous infections.
An aggressive strain of L. lindquistii (MPH2), isolated from infected sunflower stem residues collected near Auzeville in 2006 (Seassau et al. 2010), was used for inoculations. Inoculum consisted in 5 mm-diameter mycelial plugs of a two-week-old colony grown on potato-dextrose-agar medium at 25º C under darkness. The inoculation method was adapted from that used to inoculate sunflower collars (Seassau et al. 2010). A mycelial plug was applied against the stem of each plant, just above the first, second and third petiole insertion point (node). Each plug was then covered by a layer of humid cotton, and the inoculated nod was wrapped with aluminium foil in order to keep the cotton humid. The cotton and aluminium foil were removed 7 days after inoculation.
Plants located at 50, 100, 150 and 200 cm away from the inoculated plants (two plants per distance and per plot) were assessed for disease intensity. The plants were chosen so that two plants per row, located each on both sides of the inoculated plants, were assessed. Assessments were conducted every seven days during three weeks, starting when the first phoma black stem symptoms were observed. At each assessment, the number of phoma black stem lesions and the number of dead leaves (green area less than 50%) per plant were counted. Furthermore, the total
16
number of nodes per plant (cumulated numbers of dead and green leaves, i.e., the total number of leaves) was counted at the first assessment. The means of the number of lesions and of the number of dead leaves per plant were computed for each distance in each plot for further analyses.
Mixed model analyses of variance were performed to test the effect of distance from the inoculum source on the number of phoma black stem lesions (Savary and van Santen 1992; Willocquet et al. 2008). Analyses were performed for each [cultivar x assessment] combination, considering distance from the source as a fixed effect and block as a random effect. The mixed model analyses of variance were performed with the “lme” function from the “nlme” R package (Pinheiro et al. 2015).
1.4. Results
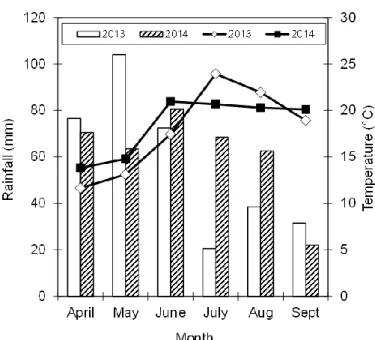
The climatic conditions under which experiments were conducted were very different in 2013 and 2014 (Figure I. 1). Monthly temperature from April to June was lower (≈ 2 ºC) in 2013 than in 2014. The opposite trend was observed in July and August, when temperature was greater in 2013 than in 2014. Temperature in September was similar in both years. Major differences in monthly accumulated rainfall were observed in May (2013 = 104 mm vs. 2014 = 63 mm) which was drier in 2014 than in 2013. In July and August, however, the accumulated rainfall was much lower in 2013 than in 2014.
17
1.4.1. Spatiotemporal experiments
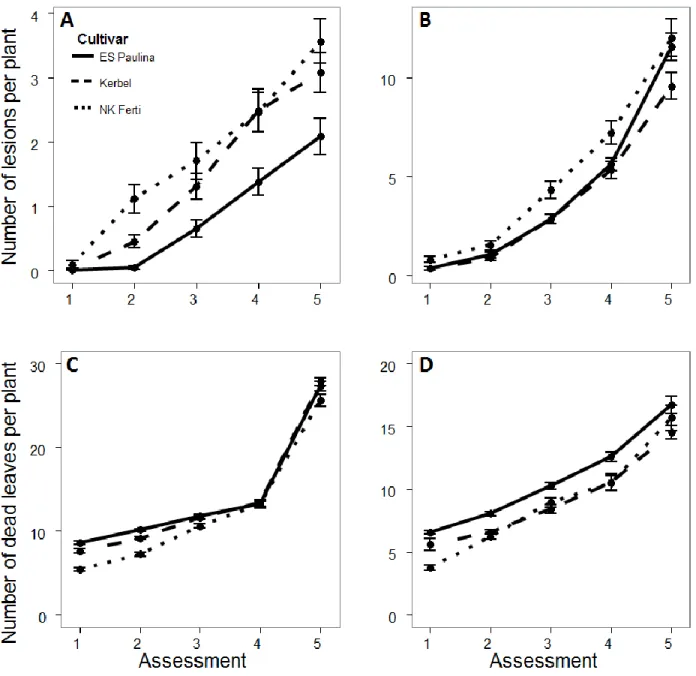
The total number of emerged plants in the four central rows of the plots varied according to cultivar and year: in 2013, the total number of emerged plants were 42, 46, and 44 for Kerbel, ES Paulina and NK Ferti, respectively; while in 2014, the total number of emerged plants were 44, 47, and 43 plants Kerbel, ES Paulina and NK Ferti, respectively. The first assessments were performed at 93 and 92 DAS in 2013 and 2014, respectively. In 2013, the mean total number of leaves per plant was 29, 29, and 27 for Kerbel, ES Paulina and NK Ferti, respectively; while in 2014, it was 26, 28, and 25 for Kerbel, ES Paulina and NK Ferti, respectively. The disease progress curves indicated that epidemics were much more severe in 2014 than in 2013, with a terminal number of lesions per plant ranging from 2 to 3.5 in 2013, and from 8 to 12 in 2014 (Figure I. 2A, B). The disease progress curves had a linear shape in 2013, and an exponential shape in 2014. NK Ferti showed the highest number of lesions in all assessments in both years. Disease intensity was higher on Kerbel than on ES Paulina in 2013. In 2014, disease levels were similar in Kerbel and ES Paulina during the first four assessments, but were larger in ES Paulina than in Kerbel at the last assessment.
The number of dead leaves per plant increased linearly over the four first assessments for all cultivars in both years (Figure I. 2C; D). Compared to the increase over the four first assessments, the increase in dead leaves between the fourth and fifth assessment was much larger in 2013, but only slightly larger in 2014. The number of dead leaves per plant was larger in 2013 than in 2014 in all cultivars, and the difference between years was the largest at the last assessment, with numbers ranging from 25 to 28 dead leaves in 2013, vs. 14 to 17 dead leaves in 2014. The number of dead leaves was in general lowest in NK Ferti, intermediate in Kerbel, and highest in ES Paulina. This ranking between cultivars was in general opposite to the ranking observed in terms of disease level (Figure I. 2A, B).
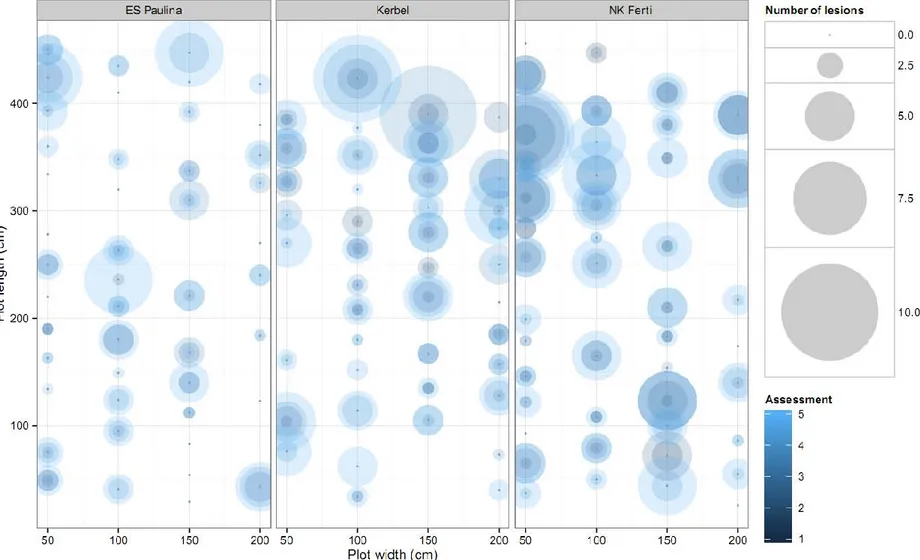
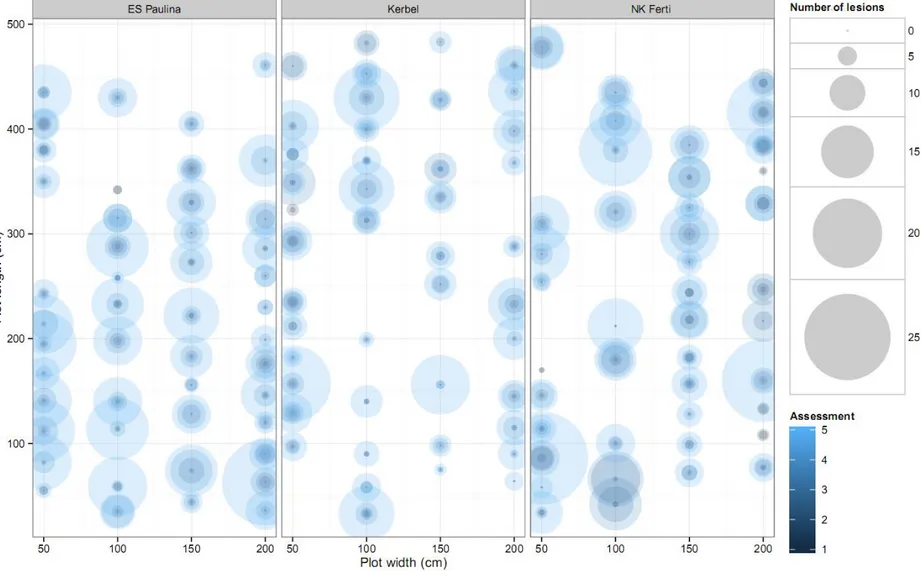
The spatial distribution of disease over assessments for each cultivar is displayed for 2013 (Figure I. 3) and 2014 (Figure I. 4). Patterns in 2013 indicate that disease intensity could vary greatly between plants at each assessment date, but not specific spatial pattern could be detected from visual observation. Similar features were observed in 2014, except that the overall level of disease intensity was larger than in 2013.
18
Figure I. 2. Temporal progress of the mean number of Phoma black stem lesions (A: 2013; B: 2014) and dead leaves (C: 2013; D: 2014) per plant in spatiotemporal experiments with cultivars ES Paulina, Kerbel and NK FertII. Dots and error bars represent the mean and standard error of the mean, respectively, from all assessed plants.
19
Figure I. 3. Bubble plots representing field plots from the spatiotemporal experiment conducted in 2013. Circles represent the number of Phoma black stem lesions per plant colored according to assessment from dark (earlier) to light (later) shade.
20
Figure I. 4. Bubble plots representing field plots from the spatiotemporal experiment conducted in 2014. Circles represent the number of Phoma black stem lesions per plant colored according to assessment from dark (earlier) to light (later) shade.
21
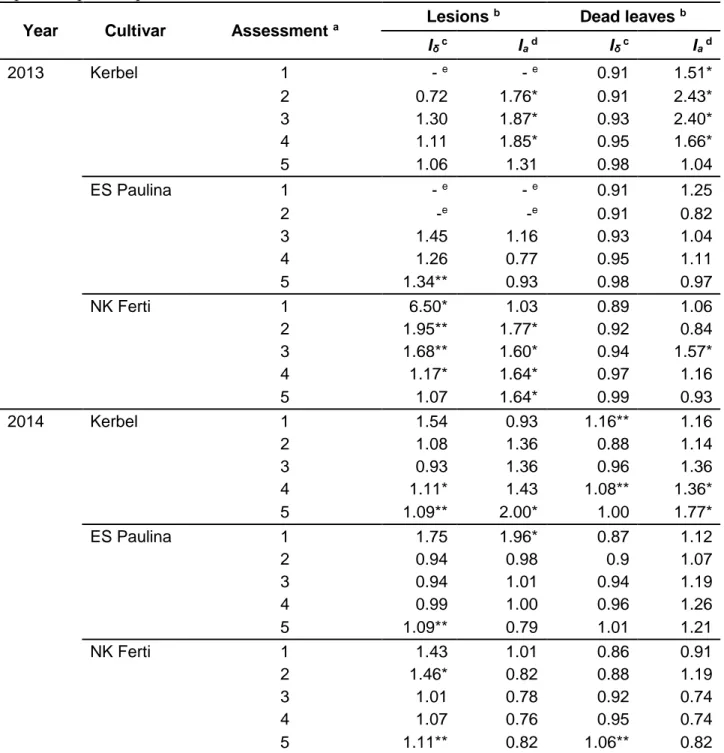
Morisita and SADIE aggregation indices for each assessment and cultivar in both years with respect to the number of lesions and number of dead leaves per plant are displayed in Table I. 1. Morisita’s index was associated to significant (P < 0.05) aggregation of the number of lesions per plant in one or two assessments for each cultivar by year combination, except for Kerbel in 2013, where no aggregation was detected, and for NK Ferti in 2013, where aggregation was detected in four assessments. SADIE index of aggregation indicated a significant (P < 0.05) aggregation in the number of lesions per plant for Kerbel (3 assessments) and NK Ferti (4 assessments) in 2013, and for Kerbel (1 assessment) and ES Paulina (1 assessment) in 2014. Both indices (Morisita and SADIE) significantly (P < 0.05) detected aggregation in the number of lesions per plant in only four instances: assessments 2, 3 and 4 in NK Ferti in 2013 and assessment 5 in 2014 for Kerbel. Morisita’s index indicated a significant (P < 0.05) aggregation in the number of dead leaves per plant for Kerbel in 2014 (2 assessments) and for NK Ferti in 2014 (1 assessment). Significant (P < 0.05) aggregation in the number of dead leaves was detected from the SADIE index for Kerbel in 2013 (4 assessments) and in 2014 (2 assessments), and for NK Ferti in 2013 (1 assessment). Both indexes (Morisita and SADIE) significantly (P < 0.05) detected aggregation in the number of dead leaves only in one instance (Kerbel, 2014, assessment 4).
Taylor’s power law provided a very good description of variation in observed variance of the number of lesions per plant when all plots across cultivars and years were combined (Figure I. 5). The regression was associated with an R2 value of 0.97. The slope (b = 1.09) was not significantly greater than 1 (t-test; P = 0.123) and the intercept (a = 0.11) was significantly greater than zero (t-test; P = 0.008). These results indicate an overall random distribution of the number of phoma black stem lesions within plots across assessments, cultivars and years.
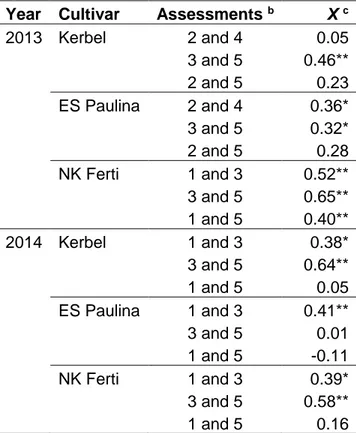
The spatiotemporal dynamics of phoma black stem epidemics was analysed with the association test of SADIE (X) between assessments dates on the three cultivars in both years (Table I. 2). Significant (P < 0.05) spatial associations were detected in five [cultivar x year] combinations out of six when associations between two assessments dates were considered (assessment dates 2 and 4, 3 and 5 for 2013 and assessments 1 and 3 and 3 and 5 for 2014). A significant (P < 0.05) association between assessments 1 and 5 was detected only once (NK Ferti, 2013).
22
Table I. 1. Morisita’s index and Index of aggregation (SADIE) of the number of black stem lesions and number of sunflower dead leaves per plant in five assessments performed at the spatiotemporal experiments.
Year Cultivar Assessment a Lesions
b Dead leaves b Iδ c Ia d Iδ c Ia d 2013 Kerbel 1 - e - e 0.91 1.51* 2 0.72 1.76* 0.91 2.43* 3 1.30 1.87* 0.93 2.40* 4 1.11 1.85* 0.95 1.66* 5 1.06 1.31 0.98 1.04 ES Paulina 1 - e - e 0.91 1.25 2 -e -e 0.91 0.82 3 1.45 1.16 0.93 1.04 4 1.26 0.77 0.95 1.11 5 1.34** 0.93 0.98 0.97 NK Ferti 1 6.50* 1.03 0.89 1.06 2 1.95** 1.77* 0.92 0.84 3 1.68** 1.60* 0.94 1.57* 4 1.17* 1.64* 0.97 1.16 5 1.07 1.64* 0.99 0.93 2014 Kerbel 1 1.54 0.93 1.16** 1.16 2 1.08 1.36 0.88 1.14 3 0.93 1.36 0.96 1.36 4 1.11* 1.43 1.08** 1.36* 5 1.09** 2.00* 1.00 1.77* ES Paulina 1 1.75 1.96* 0.87 1.12 2 0.94 0.98 0.9 1.07 3 0.94 1.01 0.94 1.19 4 0.99 1.00 0.96 1.26 5 1.09** 0.79 1.01 1.21 NK Ferti 1 1.43 1.01 0.86 0.91 2 1.46* 0.82 0.88 1.19 3 1.01 0.78 0.92 0.74 4 1.07 0.76 0.95 0.74 5 1.11** 0.82 1.06** 0.82
a Assessments were performed every seven days. See text for details. b * and ** = P < 0.05 and P < 0.01, respectively.
c Morisita’s index (I
δ).
d Index of aggregation (I
a) provided by the spatial analysis by distances indices (SADIE).
23
Table I. 2. Analysis of association between assessments of the number of black stem lesions per plant in spatiotemporal experiments.
Year Cultivar Assessments b X c
2013 Kerbel 2 and 4 0.05 3 and 5 0.46** 2 and 5 0.23 ES Paulina 2 and 4 0.36* 3 and 5 0.32* 2 and 5 0.28 NK Ferti 1 and 3 0.52** 3 and 5 0.65** 1 and 5 0.40** 2014 Kerbel 1 and 3 0.38* 3 and 5 0.64** 1 and 5 0.05 ES Paulina 1 and 3 0.41** 3 and 5 0.01 1 and 5 -0.11 NK Ferti 1 and 3 0.39* 3 and 5 0.58** 1 and 5 0.16
a * and ** = P < 0.05 and P < 0.01, respectively.
b Assessments used in the association analysis. Assessments were performed every seven days. See text for details.
c X: SADIE association function of the number of lesions per plant between two assessments. Significant (P < 0.05) spatial associations between the number of dead leaves and the number of phoma black stem lesions were detected in most of the last assessments (assessments 3 to 5; 13 significant associations out of 18; Table I. 3), whereas such an association was significant (P < 0.05) only in one instance when considering the two first assessments. No clear difference between cultivars, or between years, was detected.
24
Table I. 3. Analysis of association between the number of sunflower dead leaves and the number of black stem lesions per plant performed in five assessments in the spatiotemporal experiment.
Cultivar Assessment a X b 2013 c 2014 c Kerbel 1 - 0.09 2 0.51** 0.03 3 0.46** 0.94** 4 0.28* 0.88** 5 0.22 0.80** ES Paulina 1 - 0.55** 2 0.13 -0.08 3 -0.01 0.41* 4 0.31* 0.34* 5 0.33* -0.20 NK Ferti 1 0.13 -0.05 2 -0.13 -0.09 3 0.45** 0.97** 4 0.21 0.81** 5 -0.07 0.99**
a Assessments were performed every seven days. See text for details.
b X: SADIE association function of the number of lesions and number of dead leaves per plant at each assessment.
c * and ** = P < 0.05 and P < 0.01, respectively.
Figure I. 5. Relationship between the logarithm of the observed variance and the logarithm of mean number of Phoma black stem lesions per plant collected on three cultivars (Kerbel, ES Paulina and NK Ferti) over five assessments in spatiotemporal experiments. Squares and circles display data collected in 2013 and 2014, respectively. The dotted line represents the 1:1 line. The plain line represents the linear regression of the variance over the mean of the logarithm of the number of Phoma black stem lesions per plant.
25
1.4.2 Disease gradient experiments
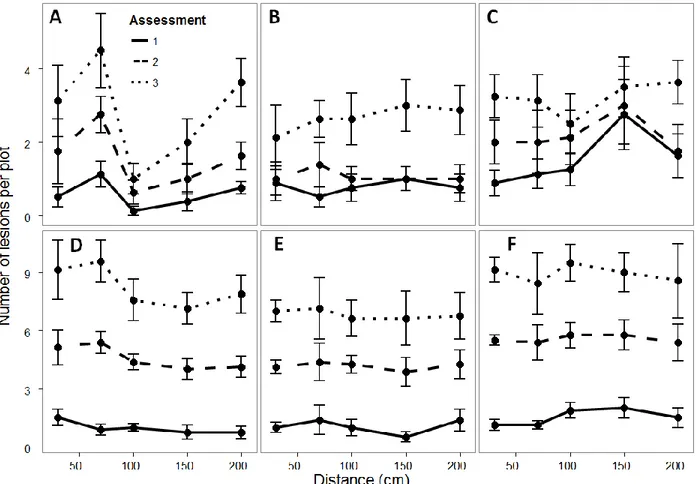
The first assessments in gradient experiments were performed at 112 and 104 DAS in 2013 and 2014, respectively, when first lesions were detected in the plots. All inoculations led to lesions on stems with appearance similar to lesions that are observed in natural infections. Lesions on inoculated plants had lengths ranging between 12 and 24 mm seven days after inoculation, when the aluminium foils and cotton were removed. The number of lesions per plant according to the distance from the source of inoculum over assessments, cultivars and years is displayed in Figure I. 6. No pattern according to the distance to the source could be visually detected. Phoma lack stem intensity was higher in 2014 than in 2013. The mean numbers of lesions in 2013 at the last assessment were 2.6, 2.8 and 3.2 for Kerbel, ES Paulina and NK Ferti, respectively. These means were 6.8, 8.2 and 8.9 for for Kerbel, ES Paulina and NK Ferti, respectively, in 2014.
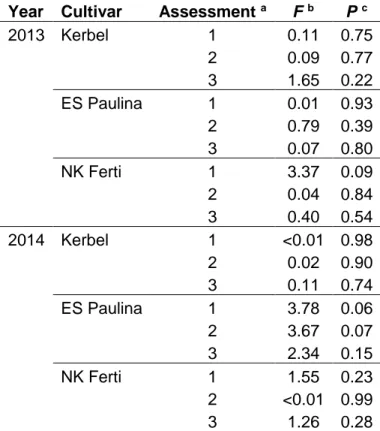
Table I. 4. Results from mixed model analyses of variance of the effects of distance from the inoculum source on the number of lesions per plant of sunflower black stem in the disease gradient experiments.
Year Cultivar Assessment a F b P c
2013 Kerbel 1 0.11 0.75 2 0.09 0.77 3 1.65 0.22 ES Paulina 1 0.01 0.93 2 0.79 0.39 3 0.07 0.80 NK Ferti 1 3.37 0.09 2 0.04 0.84 3 0.40 0.54 2014 Kerbel 1 <0.01 0.98 2 0.02 0.90 3 0.11 0.74 ES Paulina 1 3.78 0.06 2 3.67 0.07 3 2.34 0.15 NK Ferti 1 1.55 0.23 2 <0.01 0.99 3 1.26 0.28
a Assessments were conducted every seven days. See text for details. b Fisher associated to the effect of distance on number of lesions per plant. c P-value associated to the effect of distance on number of lesions per plant.
26
The mixed model analysis of variance indicated no significant (P < 0.05) effect of the distance from inoculum source on the number of phoma black stem lesions in any of the [cultivar x assessment x year] combinations analysed (Table I. 4). Therefore, no further analysis pertaining to characterizing disease gradients was considered.
Figure I. 6. Disease gradient of sunflower Phoma black stem per plant in ES Paulina (A: 2013; D: 2014), Kerbel (B: 2013; E: 2014) and NK Ferti (C: 2013; F: 2014). Dots and error bars represent the means and standard error of the mean derived from four replications (blocks), respectively.
1.5. Discussion
Analyses of the spatiotemporal experiments indicated that both Morisita’s index and SADIE index of aggregation detected aggregation of the number of lesions in four epidemics out of 28 (Table I. 1). The Taylor power law analysis further indicated a random distribution of phoma black stem lesions. These results indicate that lesions of phoma black stem were in general randomly distributed within the plots studied. Aggregated patterns are expected when secondary disease cycles are occurring in pathogens with rain-splash spores being produced in field epidemics (e.g., Pethybridge et al. 2005; Nita et al. 2012).
27
The results obtained in both years from the disease gradient experiments did not allow detecting any gradient along the total of 24 plots where line sources of inoculum had been established. Disease was observed on the plants assessed at any distance from the line source, indicating that absence of gradient was not due to host or environmental conditions unfavourable to infection. The random patterns of disease under natural epidemics, on the one hand (spatio-temporal experiments), and the non-detection of disease gradients (gradient experiment) over two years of experiment, on the other hand, would suggest that under the experimental conditions reported here no secondary infections took place.
Disease association between assessments separated by two weeks was detected in 10 instances (experimental plots) out of 12, whereas disease association between assessments separated by four weeks was detected only in one experimental plot out of six (Table I. 2). The lack of association between 4-week-apart assessments may be explained by the fact that lesions that appeared during this period originated from primary infections randomly distributed (originating from exogenous, airborne inoculum - ascospores). These lesions therefore were not associated to the lesions observed at the beginning of this period. The closer association found between assessments separated by two weeks may reflect the fact that lesions detected at the beginning of this period were also observed at the end of this period. The number of new lesions which appeared during this period (and which were randomly distributed) was small enough, as compared to the number of lesions detected at the beginning of the period (and still present and observed at the end of the period), to detect the association between both assessment dates.
Within-year analyses of the spatiotemporal experiments indicated that phoma black stem intensity and the number of dead leaves were associated over the last three assessments (Table I. 3).
These results conform with recent findings from field experiments where phoma black stem was associated to premature leaf senescence (Quiroz et al. 2014). Our experimental approach did not allow identifying if leaves senescing on plants were the cause, or the consequence, of phoma black stem infections. Specific experiments with inoculation of troughs corresponding to leaves with varying levels of physiological senescence would be necessary to quantify the relative effects of (1) physiological senescence on susceptibility to infection and (2) infection on disease-induced leaf senescence.
Between-year comparison indicates that 2013 was characterized by low rainfall in July and August (i.e., during flowering and grain filling), lower phoma black stem disease, and lower number of dead leaves per plant, compared to 2014. The difference in disease intensity between
28
years may be related to the difference in rainfall patterns: L. lindquistii ascospores release is favoured by rainfall (Délos et al. 1998). Under the assumption that phoma disease is associated to defoliation (this article, Table I. 3; Quiroz et al. 2014), the patterns detected in the spatiotemporal experiments between years (lower disease and higher defoliation in 2013 than in 2014) may seem contradictory. This difference may however be explained by a more important effect of water stress (higher in 2013) on defoliation, than of the association between phoma black stem (higher in 2014) and defoliation.
Our results are suggestive of black stem epidemics being driven by widespread inoculum sources located beyond any given field’s limits. Other diseases, such as Fusarium head blight (FHB) of cereals, exhibit similar epidemiological features. As exemplified in the case of FHB (Savary 2014), adequate disease management strategies may be aiming at (1) inoculum reduction at the landscape scale through a reduction of sunflower in the rotation and cultivation practices; and (2) a reduction of infections through the use of host plant resistance, and fungicide applications when necessary.
1.6. Acknowledgements
We are grateful to Serge Savary (INRA, UMR AGIR) for his review of the manuscript prior to its submission. This work was partly funded by the Brazilian National Council for Scientific and Technological Development (CNPq, Programa Ciência sem Fronteiras). Weather data was accessed at the CLIMATIK website of the AGROCLIM INRA group.
29
2. Effects of plant morphological traits on phoma black stem in sunflower
André Aguiar Schwanck, Serge Savary, Philippe Debaeke, Patrick Vincourt, Laetitia Willocquet
Comment: article published as ‘first online’ version at the ‘European Journal of Plant
Pathology’ journal (Online ISSN: 1573-8469) in January 12, 2016 (DOI: 10.1007/s10658-015-0848-8). Citations in the text appear according to the journal author guidelines.
2.1. Abstract
Despite the importance of Phoma black stem of sunflower in France, no specific management tools are currently deployed to control this disease. The deployment of host plant resistance could be a cost-effective and sustainable way to manage the disease. Relationships between plant morphological traits and disease intensity may provide guidance towards the identification of sunflower morphological ideotypes associated with reduced disease intensity and therefore partial resistance. Such relationships were quantified in field experiments conducted over 2 years with a set of 21 sunflower genotypes, where several morphological attributes and several disease intensity variables were measured. Plant morphology was assessed prior to epidemic onset. Disease intensity was assessed at different scales of crop and plant hierarchy, using a nested sampling design, and implementing the concept of conditional disease intensity. The various analyses performed indicated that experimental plots grouped according to morphological attributes of sunflower at the flowering stage were associated with experimental plots grouped according to disease intensity variables, therefore indicating an association between morphological traits and disease intensity. Low disease intensity was associated with a morphological ideotype with large number of green leaves and tall stature. A sunflower plant morphological ideotype with more leaves and taller stature may represent an operational target in sunflower breeding when considering resistance to Phoma black stem.
Keywords: Helianthus annuus, Leptosphaeria lindquistii, Phoma macdonaldii, Plant
30
2.2. Introduction
Phoma black stem, caused by the fungus Leptosphaeria lindquistii Frezzi (synonym Phoma
macdonaldii Boerema), is an important disease of sunflower in France (Debaeke and Pérès 2003).
The pathogen overwinters as pseudothecia, pycnidia and mycelium produced on infected sunflower stubble residues (Gulya et al. 1997). In France, lesions observed on stems appear to be mainly due to infections from exogenous inoculum consisting of ascospores released from infected sunflower residues (Seassau et al. 2010; Bordat et al. 2011). Furthermore, it is hypothesized that epidemics are monocyclic, because no pycnidia (which may lead to secondary infections) can be observed on lesions on the host during the growing season (Bordat et al. 2011). Symptoms on the stem correspond to black, round to oval lesions enlarging from leaf nodes. Epidemics generally start after flowering and the appearance of symptoms on the stem usually follows acropetal progress (from the lower to upper leaf nodes). L. lindquistii infections can also occur on the collar, where lesions develop and may lead to senescence and death of the plant a few weeks before normal maturity. This is referred to premature death or premature ripening, and can lead to high yield losses (Donald et al. 1987; Debaeke and Pérès 2003; Seassau et al. 2010).
Phoma black stem is influenced by several components of cropping practice. The disease is favoured by increased nitrogen input and irrigation, which are in turn associated with a larger leaf area index (LAI) in the canopy (Debaeke and Pérès 2003). It is also possible that short rotations (sunflower–wheat) and reduced tillage, which were introduced in the 90s in France, may have triggered an increase in inoculum density, leading to the recent increase in importance of the disease in France (Debaeke and Pérès 2003). No complete resistance has been identified for Phoma black stem. Although several QTLs (Quantitative Trait Loci) for resistance to L.
lindquistii have been identified (e.g., Roustaee et al. 2000), no varieties with partial resistance to
Phoma black stem as yet have been deployed to manage the disease.
Measuring disease in plants is a key methodological component in most research, development, and applied activities involving phytopathological aspects (Large 1966; Zadoks and Schein 1979). Applications include plant breeding, where various germplasm, varieties and/or breeding materials are rated through visual assessment (e.g., Poland and Nelson 2011; Xie et al. 2012). Disease assessment involves several components, including keys and diagrams describing the host development and morphology, standard area diagrams for disease severity (e.g., James 1971), and sampling design (Zadoks and Schein 1979). Recent years marked a renewed interest in the development and evaluation of diagrams for disease severity (e.g., Bock et al. 2010; Schwanck and Del Ponte 2014). Disease assessment aims at collecting data pertaining
31
to disease intensity, which can be expressed as incidence, severity, or lesion density (Nutter et al. 1991).
Plant morphology can affect disease intensity, as shown in many pathosystems (e.g., Zadoks and Schein 1979; Savary et al. 1995a; Ando et al. 2007). Plant morphology can in turn vary in response to several factors, including numerous cropping practices (e.g., level of nutrients, pruning), and plant genotype (Poland et al. 2009; Andrivon et al. 2013). The identification of morphological traits associated with reduced disease intensity may therefore represent a useful basis to improve disease management, through breeding of varieties with morphological attributes associated with less disease. In the case of Phoma black stem in sunflower, relationships between morphological traits and disease intensity have not been quantitatively documented, and may provide useful information to improve management of the disease.
The objectives of the work presented here were: (1) to develop a protocol for assessment of Phoma black stem in sunflower (including a sampling design and a scale for severity on the stem), and (2) to apply it to address relationships between sunflower morphological traits and Phoma black stem intensity.
2.3. Materials and methods
2.3.1. Experimental design and general features
Two field experiments were conducted in Auzeville, near Toulouse (Haute-Garonne, South-West France), in 2013 and 2014. Both experiments were planted according to a randomized complete block design with four replications, and 21 sunflower genotypes randomly established in each block. Both experiments were conducted under natural conditions for epidemic development (no inoculation was performed).
The experimental plots were sown at a rate of 7 seeds/m2, on 6 May and 15 April in 2013 and 2014, respectively. Both experiments were grown under rainfed conditions. Nitrogen was applied once in both years at 50 days after sowing, at a rate of 35 and 70 kg/ha in 2013 and 2014, respectively. Each experimental unit (one genotype in a block) consisted of a plot of six rows with a row length of 6 m and an inter-row space of 0.5 m, corresponding to an area of 18 m2 (6 × 3 m). Due to the limited amount of seeds available for several genotypes tested, the two border rows of each plot were sown with a commercial hybrid in both years (NK Kondi). Weather data was collected with a weather station (CE-180, Cimel, France) located less than 400
32
m from the experimental site. 10-day mean temperature and accumulated rainfall were computed from April to September in each experimental year.
2.3.2. Plant material
Plant material consisted of 21 sunflower genotypes (Table II. 1). The inbred lines FU (INRA core collection ID: SF056) and PAZ2 (INRA core collection ID: SF306) were used in this study. FU had shown higher Phoma black stem intensity than PAZ2 in a previous study performed under controlled conditions on seedlings, using inoculation of cotyledon petioles (Bert et al. 2004). Table II. 1. List and description of sunflower genotypes used in the experiments.
Codesa Male linesb Genetic material type
550 (Tub-1709-1)-1-6A Hybrids: FU x line from
INRA core collection
558 SF306 574 97B7 586 SF336 592 SF247 598 SF332 610 FP109 Hybrids: FU x RILc 616 FP111 628 FP146 634 FP176 640 FP043 652 FP056 658 FP072 664 FP102 SF056d Lines SF306e FP055 FP066
Kerbel Commercial hybrids
ES Paulina NK Ferty
a Genotype codes used in this study.
b Male parental lines used to produce hybrids.
c RIL = Recombinant inbred lines, see text for details. d other name: FU.
e other name: PAZ2.
Six hybrids were produced from crosses involving the susceptible inbred line FU as the female tester, and six lines from the INRA Helianthus annuus core collection as the males. One male parental line was PAZ2, while the five other male parental lines were characterized as
33
having a range of levels of field resistance to premature death (Bordat et al. 2012). Eight additional hybrids were produced from crosses between FU and recombinant inbred lines (RILs; F7-F10) obtained by single seed descent from a crossing between FU and PAZ2. The eight RILs had a range of levels of quantitative resistance to premature death (610, 616, 628 and 634 with two alleles of quantitative resistance, and 640, 652, 658, and 664 with two alleles of susceptibility; Bordat et al. 2012). Furthermore, two lines, FP055, characterized as having two alleles for susceptibility, and FP066, with two alleles of quantitative resistance against premature death, were included. Three commercial hybrids currently grown in France, Kerbel (RAGT Semences), ES Paulina (Euralis Semences) and NK Ferti (Syngenta Seeds), were used in order to include genetic material grown in farmers’ fields. Hybrids were used in this study because this represents the main genetic make-up currently used in commercial sunflower fields.
The genotypes tested therefore included: (1) parental lines with varying characteristics of resistance to L. lindquistii, (2) hybrids produced from crosses between a susceptible line (FU) and lines or RILs with a range of levels of resistance to L. lindquistii, and (3) commercial hybrids.
2.3.3. Disease assessments
One disease assessment was conducted in 2013, at 122 days after sowing (DAS; September 5). Two disease assessments were performed in 2014, at 112 DAS (August 5) and 119 DAS (August 12). On each assessment date, 15 plants per plot were randomly selected and classified according to four categories: (A) no disease; (B) symptoms on the stem only; (C) symptoms on the collar only and (D) symptoms on both the stem and collar. Disease incidence on the stem (proportion of plants with at least one Phoma black stem lesion; INCS) and disease incidence on collar (proportion of plants with a lesion on the collar; INCC) were derived from these assessments (Table II. 2).
34
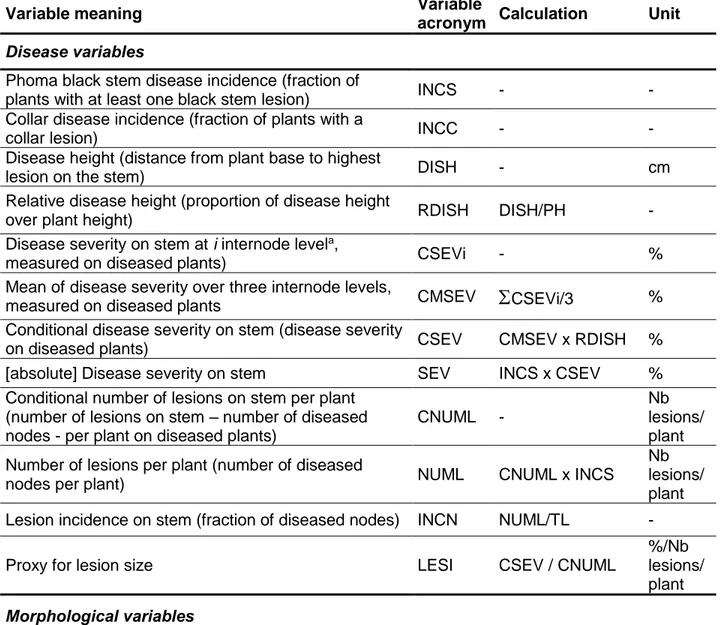
Table II. 2. List of measured or computed variables for Phoma black stem disease intensity or sunflower morphological traits
Variable meaning Variable
acronym Calculation Unit
Disease variables
Phoma black stem disease incidence (fraction of
plants with at least one black stem lesion) INCS - -
Collar disease incidence (fraction of plants with a
collar lesion) INCC - -
Disease height (distance from plant base to highest
lesion on the stem) DISH - cm
Relative disease height (proportion of disease height
over plant height) RDISH DISH/PH -
Disease severity on stem at i internode levela,
measured on diseased plants) CSEVi - %
Mean of disease severity over three internode levels,
measured on diseased plants CMSEV
CSEVi/3 %Conditional disease severity on stem (disease severity
on diseased plants) CSEV CMSEV x RDISH %
[absolute] Disease severity on stem SEV INCS x CSEV %
Conditional number of lesions on stem per plant (number of lesions on stem – number of diseased nodes - per plant on diseased plants)
CNUML -
Nb lesions/ plant Number of lesions per plant (number of diseased
nodes per plant) NUML CNUML x INCS
Nb lesions/ plant
Lesion incidence on stem (fraction of diseased nodes) INCN NUML/TL -
Proxy for lesion size LESI CSEV / CNUML
%/Nb lesions/ plant
Morphological variables
Number of dead leaves per plant DL - Nb
leaves
Number of green leaves per plant GL - Nb
leaves
Total number of leaves per plant TL DL + GL Nb
leaves
Proportion of dead leaves on total nb leaves DLFR 100 x DL / TL %
Plant height PH - cm
Stem diameter SD - mm
Width of insertion point at leaf nodes 3 and 6 (3rd and
6th node from plant base) N3, N6 - mm
Leaf area index LAI - -
35
Among the stem-diseased plants, three plants per plot were randomly selected for additional disease measurements of disease intensity (severity, density, height). The distance between the stem base and the highest lesion on the stem was measured (disease height; DISH). Relative disease height (RDISH) was further computed as the ratio of DISH to plant height. The number of lesions on the stem was counted (CNUML). This number corresponds to a conditional disease measurement (Shaw 1995, 1996; McRoberts et al. 2003), because it is the number of lesions on diseased plants only; that is, conditional on the plant being diseased. CNUML was multiplied by INCS to derive the [absolute] number of lesions on a stem per plant (NUML). Furthermore, disease incidence at the node scale (fraction of diseased nodes per plant, INCN) was derived by dividing NUML by TL, the total number of leaves (nodes) per plant (see below, assessment of morphology). Disease severity on the stem was assessed using a standard area diagram with six grades, ranging from 1 to 70 % (Figure II. 1). The diagram was first designed using digital photos of symptoms on stems displaying a range of severity. The software ASSESS© 2.0 (APS Press, St. Paul, MN, USA) was used to fine tune symptom densities so that they correspond to the six grades with pre-set levels of disease severity.
Figure II. 1. Standard area disease diagram used to assess sunflower Phoma black stem severity. Percentage values represent the percentage of stem area covered by lesions between two nodes.
Disease severity assessments were performed on three internodes located on the lowest part of the stem (where disease develops), i.e.,: closest to soil surface (CSEV1), on the highest diseased internode (CSEV3), and on the internode located at an intermediate height (CSEV2). When the number of diseased internodes was not large enough to fit three measurements, only one or two measurements were taken. Mean severity (CMSEV) over the three internodes was computed. Conditional disease severity on the stem (CSEV) was derived from CMSEV and RDISH, and the [absolute] disease severity on the stem was calculated from CSEV and INCS