Interpreting Lithium Batteries Discharge Curves for Easy Identification of the Origin of Performance Limitations.
Renaud Cornut,a,b David Lepage a and Steen B. Schougaard *a
a Department for Chemistry, Université du Québec à Montréal, 2101 rue
Jeanne-Mance, Montreal (QC) H1X 2J6, Canada, Fax:
514 987 4054; Tel: 514 987 3000, post 3911; E-mail: [email protected]
b Present address : CEA-Saclay, IRAMIS/NIMBE/LICSEN, 91191 Gif sur Yvette, France
Abstract: A simple method is proposed to interpret limited discharge performances of composite positive electrodes in terms of charge transport in the electrolyte vs. charge transport in the active material.
Keywords: Lithium-ion battery, performance limitation, numerical modeling, charge transport, plotting technique.
1. Introduction
A common approach to ensure high energy density and chemical reversibility in rechargeable batteries is to employ solid-state materials amiable to alkali ion insertion reactions [1-3]. The insertion reaction however has several drawbacks, such as, the transport of ions inside the solid is slow compared to transport in liquid electrolytes. To overcome this problem, the electrodes employed in insertion batteries consist of active material in micron to nanometer sized particle form mixed with additives like polymeric binder and carbon. This solid matrix is porous, so that the liquid electrolyte may penetrate deep inside the electrode. Consequently, the electrode has
considerable structural complexity, which makes analyzing performance challenging. E.g. a common problem is to identify if the performance is limited by transport in the liquid electrolyte part of electrode or by transport in the active material particles [4].
The problem of charge transport and electrochemical performance of composite electrodes has previously been examined theoretically. As such, empirical methods based on a careful comparison of the discharge characteristics of several materials have lead to models with analytical solutions [5-7]. They have the advantage of simplicity, with the trade-off of limited validity range. More complex and accurate models, able to reproduce entire discharge curves have also been developed [8-13]. These necessitate an expertise in numerical simulation and more importantly, they require the knowledge of many parameters characterizing the system under study, including electronic and ionic conductivities, size of the particles, porosity etc. Consequently extensive characterization of the electrode and its components is required to employ these models. In the present study the simplicity of the empirical methods and the accuracy of the numerical studies are combined to derive a simple technique for identification of the factor limiting the performances of a positive electrode. In addition, the analysis allows for the evaluation of the associated transport parameters.
2. Experimental
2g of LiFePO4:poly(3,4-ethylenedioxythiophene) composite, pedot-LiFePO4 hereafter, prepared according to ref. [14] was mechanically mixed with 4g of a solution of 3 % (w/w) PVDF (Kynar® KF Polymer W#1100) in N-methylpyrrolidone (Aldrich). The suspension was coated onto carbon coated Al foil (Exopack #2651) with a micrometer adjustable film applicator (MTI corp.). The applicator was adjusted to various thicknesses to yield coatings 1 to 4. The coatings where subsequently dried at 60°C for three hours in ambient air and under vacuum overnight. After this
drying the thickness of the active materials was measured using a micrometric head (Mitutoyo). The electrodes were transferred to an Argon atmosphere glove box (H2O < 1 ppm, O2 < 1 ppm) for coin cell assembly. An 1 M LiPF6 in a 1:1 ethylene carbonate and dimethyl carbonate (Novolyte Technologies) solution served as electrolyte, while the anode and separator consisted of metallic lithium (99.9 % , 0.75 mm thick and 19 mm wide; Alfa Aesar) and Celgard 2500 membranes, respectively. All batteries were cycled between 2.2 and 4 V for five cycles at C/5, for stabilization using an 8 Channels Battery Analyzer (MTI corp. 0.002-1mA), prior to the cycling at different C-Rates (2.2-4V) using a Bio-Logic VMP3 multipotentiostat. Degree of Discharge (DoD) refers to the capacity relative to the maximum capacity at the lowest measured rates. Approximate particle size was determined by examining transmission electron micrographs obtained from a Jeol JEM-2100F TEM operating at 200 kV.
3. Calculations
The partial differential equations systems (see supporting information) were solved numerically using the finite elements method implemented in the commercially available software Comsol version 3.5a. The maximal size of the mesh was set to 0.001 and 0.01 for 1D and 2D domains, respectively, and the relative tolerance was fixed at 10−4. Numerical resolutions lasted few seconds using Quad CPU 2.5 GHz Intel Processor with 8 GB of RAM.
4. Results
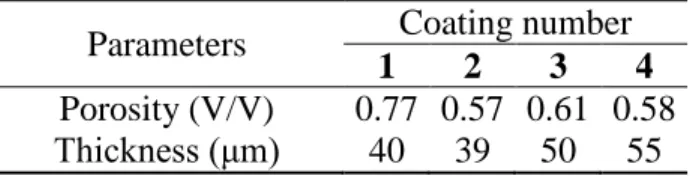
The discharge curves measured for four different electrode coatings based on the same active material, i.e. LiFePO4 with identical chemical composition are presented in Figure 1. They however differ by their porosity and thickness as indicated in Table 1.
Table 1. Composite electrode coating parameters.
Parameters Coating number
1 2 3 4
Porosity (V/V) 0.77 0.57 0.61 0.58 Thickness (μm) 40 39 50 55
The current density is referenced to the C-rate, i.e. the inverse of the discharge time (in h) required to extract the full theoretical capacity of the system. As apparent from Figure 1, for a given C-rate the Degree of Discharge (DoD), i.e. the accessible fraction of the maximal capacity, strongly depends on the coatings physical parameters, e.g. at the 10C-rate the capacity varies from 40 mAh/g for the coating 1 to less than 5 mAh/g for the coating 4. Since the composition is the same for the four coatings, this is a clear indication that the charge transport in the electrode structure, which here includes the electrolyte, strongly influences the performance.
Figure 1
Fig.1 Experimental discharge curves for different C-rates. (For thickness and porosity see Table 1. Chemical composition: 80-85 wt-% LiFePO4, 10-13wt% poly(3,4-ethylenedioxythiophene)
To what extend the electrode structure is limiting compared to the active material is however difficult to identify from the data presented figure 1. In contrast, we have found empirically that plotting 1/DoD as a function of C-rate leads to a linear behavior at low rates for electrodes expected to be limited by the transport in the active particle (high porosity, low thickness) (Figure 2).
Our analysis was extended to insertion battery system data from the recent literature selected at random (see supporting information) [15-17]. Surprisingly, the same linear behavior is found at low C-rates over a wide range of systems, provided that the voltage cut-off window is sufficiently large to provide the sharp decrease of potential at the end of charge, as is the case in Figure 1. To explore this behavior in depth, numerical simulations were employed. Using the same approach as adopted by Newman et al., we considered the electrode as the macro-homogeneous superposition of two media transporting the electronic and ionic charges, in addition to the transport of inserted ions inside the active material particles [18-20]. The corresponding equation system is presented in the supporting information section. Importantly, while it has been shown previously that the microscopic mechanism for lithium uptake and release is remarkably complex for the Li1-xFePO4 system [21-28], we here use a spherical diffusion model to describe lithium transport, as recent data suggests that this yield correct kinetic predictions within the experimental error for the oxidation process [29]. The numerical investigation of a wide range of model parameter combinations, followed by the careful analysis of the resulting discharge curves lead to the conclusion, that two unique sets of circumstances entailed a sharp decrease of potential and that these are depending on very few parameters. For this reason, and despite the complexity of the processes occurring during the discharge, focusing on the sharp decrease of potential at the end of discharge greatly decreases the complexity of the numerical simulation analysis. The two sets
of circumstances that can lead to a sharp decrease of potential are identified as (i) performance limited by the transport of inserted species in the active material particles, and (ii) performance limited by the ionic transport in the electrolyte.
First, the case where transport of the charged species is limited by the transport in the active material was investigated. Previous studies have provided analytical expressions of the degree of discharge as a function of the discharge rate in the case of a pure diffusional process. A formula involving an infinite sum of terms, valid over the entire C-rate range has been found, [30] as well as simple formulas only valid for long or short discharge times [31]. In here we rely on the analysis of the numerical solution of the diffusion problem, which can be reduced to the following approximation:
(2)
where Ds is the apparent solid phase diffusion coefficient (in cm2/s), rp the size of the particles (in
m), and C-rate the C discharge rate (in h-1). Eq. (2) reproduces the exact numerical results within 5 percent. This equation was extracted from a set of numerical simulation results (1/DoD, rp2 C-rate/Ds) through an adjustment the coefficient a1 of the following function: f(a1)=1+a1 rp2C-rate/Ds) in order to obtain the best fit between the function and the numerical simulation. Due to linearity of the equation system a similar behaviour is expected for the charge of the electrode.
Eq. (2) implies that over the entire C-range, the inverse of DoD is linearly dependent on the rate, with a y-axis intercept of 1 and a slope given by 0.23 rp2/Ds. This linear behaviour provides an
easy method to evaluate the transport parameter combination rp2/Ds. Additionally, numerical
investigation was performed in more complex situations than spherical diffusion inside
s p D rate C r DoD _ 2 23 . 0 1 1 ≈ +
monodispersed particles. As detailed in the supporting information (S1-S2), phase change during insertion, distribution of the particles, as well as the presence of cylindrical shape of particles were also tested. Importantly, in all the instances, a linear law similar to Eq. (2) could be obtained, so that the endpoint of lithium release during discharge could be fitted to an apparent solid phase spherical diffusion process [32]. This shows the robustness to the linearity of 1/DoD as a function of the C-rate, with a y-axis intercept of 1, in the case of inserted material transport limitations. Moreover, recent results show that very complex delithiation reaction mechanisms lead to kinetics, which within the experimental error can be approximated to spherical diffusion [29].
The second case considered theoretically is the absence of particle insertion limited transport. In this case, the depletion of electrolyte somewhere inside the electrode lead to a brutal decrease of potential drop as observed in figure 1. The sharp discharge front model provides an approximation of the DoD in this case: [4]
(3)
Where ce0 is the bulk electrolyte concentration, Deeff the effective diffusion coefficient of Li+ ions
inside the electrode, Lcath the thickness of the electrode, csmax the maximal concentration of inserted
species inside the material, ƐLiFePO4 the volumetric fraction of active material inside the cathode, Ɛ the porosity of the electrode, and t+ the cation transport number in the electrolyte. At low C-rates electrolyte diffusion ensures that there is no point in the electrode where the electrolyte is completely depleted (ce<< ce0 ), thus no sharp decrease of potential at the end of discharge can be observed and Eq. (3) therefore leads to unphysical DoD values (DoD>1). However, at C-rates where electrolyte is completely depleted (ce<< ce0 ), easily identified as Eq. (3) predicts a DoD
(
)
3600 1 1 0 4 max 2 rate C D c t c L DoD e eeff LiFePO s cath − − = + ε εsmaller than 1, DoD values comparable to those obtained with the full numerical model are obtained with Eq. (3).
The simple theoretical framework provided by Eq. (2) and Eq. (3) was further used to interpret experimental results reproduced in Figure 2.
Figure 2
Fig.2 Inverse of DoD as a function of the C-rate for different coatings: : coating 1 : coating 2, : coating 3, : coating 4.
At low discharge rates for all the coatings, the linearity of the inverse of the DoD as a function of the discharge rate, together with a y-axis intercept of 1 indicates exclusive limitation by the transport inside the active material particles. The slope associated with this linear behavior provides the apparent diffusion coefficient related to transport in the active material particles. In the present case, this leads to Ds=410-14 cm2/s (considering diffusion inside monodisperse
spherical particles, with rp=210-7m), which is similar to values previously reported in the
literature [32]. The linearity is achieved on the entire C-rate range for coating number 1. As such, the rates where the electrolyte transport becomes limiting is larger than 10C for this coating.
Indeed, in this case, the transport of Li ions through the electrolyte is favored, because this coating has the highest porosity and the smallest thickness amongst the four tested. For the other coatings, a departure from linearity is observed at high C-rates. This is an indication of additional performance limitations, arising from ionic depletion inside the electrolyte. It is then a mixed limitations situation, and neither Eq. (2) nor Eq. (3) directly apply, given that they have been obtained for limit cases exclusively. Importantly, this mixed situation will always lead to lower
DoD than predicted by the limiting cases.
The C-rate where the departure from linearity is observed provides indications of the effective diffusion coefficient of Li ions inside the electrolyte as it corresponds to the lower limit of the
C-rate where the electrolyte is almost depleted in one point inside the electrode (ce<< ce0 ). Numerical simulations using the full model in the case of mixed limitations show that the departure is observed when the right term of Eq. (3) is close to 1. As an illustration, for the coating number 3, the departure is observed for a C-rate equal to 1. Considering Eq. (3), this leads to an effective diffusion coefficient of 4.510-8 cm2/s (with ce0=1M, csmax=2.2104 mol/m3, t+=0.4 ƐLiFePO4=0.3,
and the porosity and thickness reported in Table 1), which reflects the complex pathways that ions have to follow inside the electrode.
From the methodology presented herein, we demonstrate that the electrode performance is exclusively limited by the charge transport inside the electroactive particles when a linear behaviour of 1/DoD vs. C-rate with a y-axis intercept of 1 is obtained. A non-linear behaviour is diagnostic of additional limitations by the electrolyte. This theoretical approach has been validated through experimental data stemming from electrodes with a wide range of electrode thicknesses. These confirm that a decrease in the electrode thickness leads to an increase of the C-rate
threshold, beyond which, the electrode structure contributes to the limitations of the electrode performance (see supporting information).
5. Conclusions
In summary, we propose a simple method to discriminate between solid-state diffusion and electrolyte transport as the performance limiting factors in composite insertion electrodes, by plotting the inverse of the degree of discharge as a function of the C-rate. In addition, the associated transport parameters are easily derived. The method does not require extensive characterization of the material nor expertise in numerical simulation and is therefore useful for the evaluation of the performances of a new active material, as well as, for finding the optimal electrode processing parameters required to meet a given set of specifications. Moreover, it offers a simple tool to identify data, which reflects the intrinsic performance of the active material, rather than a convolution of electrode and active material. As such, it should find use in electroactive battery materials development.
Acknowledgement
This work was supported by Université du Québec à Montréal.
References
[1] A.K. Padhi, K.S. Nanjundaswamy, J.B. Goodenough, Phospho-olivines as positive-electrode materials for rechargeable lithium batteries, J. Electrochem. Soc., 144 (1997) 1188-1194.
[2] P.G. Bruce, B. Scrosati, J.M. Tarascon, Nanomaterials for rechargeable lithium batteries, Angew. Chem., Int. Ed., 47 (2008) 2930-2946.
[4] P.A. Johns, M.R. Roberts, Y. Wakizaka, J.H. Sanders, J.R. Owen, How the electrolyte limits fast discharge in nanostructured batteries and supercapacitors, Electrochem. Commun., 11 (2009) 2089-2092.
[5] M. Gaberscek, R. Dominko, J. Jamnik, Is small particle size more important than carbon coating? An example study on LiFePO4 cathodes, Electrochem. Commun., 9 (2007) 2778-2783. [6] M. Gaberscek, Towards optimized preparation of cathode materials: How can modeling and concepts be used in practice, J. Power Sources, 189 (2009) 22-27.
[7] C. Fongy, A.-C. Gaillot, S. Jouanneau, D. Guyomard, B. Lestriez, Ionic vs Electronic Power Limitations and Analysis of the Fraction of Wired Grains in LiFePO4 Composite Electrodes, J. Electrochem. Soc., 157 (2010) A885-A891.
[8] M. Doyle, J. Newman, A.S. Gozdz, C.N. Schmutz, J.-M. Tarascon, Comparison of Modeling Predictions with Experimental Data from Plastic Lithium Ion Cells, J. Electrochem. Soc., 143 (1996) 1890-1903.
[9] M. Park, X. Zhang, M. Chung, G.B. Less, A.M. Sastry, A review of conduction phenomena in Li-ion batteries, J. Power Sources, 195 (2010) 7904-7929.
[10] Y.H. Chen, C.W. Wang, X. Zhang, A.M. Sastry, Porous cathode optimization for lithium cells: Ionic and electronic conductivity, capacity, and selection of materials, J. Power Sources, 195 (2010) 2851-2862.
[11] G.G. Botte, V.R. Subramanian, R.E. White, Mathematical modeling of secondary lithium batteries, Electrochim. Acta, 45 (2000) 2595-2609.
[12] W. Du, A. Gupta, X. Zhang, A.M. Sastry, W. Shyy, Effect of cycling rate, particle size and transport properties on lithium-ion cathode performance, Int. J. Heat Mass Transfer, 53 (2010) 3552-3561.
[13] S. Dargaville, T.W. Farrell, Predicting Active Material Utilization in LiFePO4 Electrodes Using a Multiscale Mathematical Model, J. Electrochem. Soc., 157 (2010) A830-A840. [14] D. Lepage, C. Michot, G. Liang, M. Gauthier, S.B. Schougaard, A Soft Chemistry
Approach to Coating of LiFePO4 with a Conducting Polymer, Angew. Chem., Int. Ed., 50 (2011) 6884-6887.
[15] J.-H. Ju, S.-W. Cho, S.-G. Hwang, S.-R. Yun, Y. Lee, H.M. Jeong, M.-J. Hwang, K.M. Kim, K.-S. Ryu, Electrochemical performance of Li[Co0.1Ni0.15Li0.2Mn0.55]O2 modified by carbons as cathode materials, Electrochim. Acta, 56 (2011) 8791-8796.
[16] S.-M. Oh, H.-G. Jung, C.S. Yoon, S.-T. Myung, Z. Chen, K. Amine, Y.-K. Sun, Enhanced electrochemical performance of carbon–LiMn1−xFexPO4 nanocomposite cathode for lithium-ion batteries, J. Power Sources, 196 (2011) 6924-6928.
[17] D.Y.W. Yu, K. Donoue, T. Inoue, M. Fujimoto, S. Fujitani, Effect of Electrode Parameters on LiFePO4 Cathodes, J. Electrochem. Soc., 153 (2006) A835-A839.
[18] R. Darling, J. Newman, Modeling a porous intercalation electrode with two characteristic particle sizes, J. Electrochem. Soc., 144 (1997) 4201-4208.
[19] T.F. Fuller, M. Doyle, J. Newman, Simulation and Optimization of the Dual Lithium Ion Insertion Cell, J. Electrochem. Soc., 141 (1994) 1-10.
[20] M. Doyle, T.F. Fuller, J. Newman, Modeling of Galvanostatic Charge and Discharge of the Lithium/Polymer/Insertion Cell, J. Electrochem. Soc., 140 (1993) 1526-1533.
[21] J. Niu, A. Kushima, X. Qian, L. Qi, K. Xiang, Y.-M. Chiang, J. Li, In Situ Observation of Random Solid Solution Zone in LiFePO4 Electrode, Nano Lett., 14 (2014) 4005-4010.
[22] H. Liu, F.C. Strobridge, O.J. Borkiewicz, K.M. Wiaderek, K.W. Chapman, P.J. Chupas, C.P. Grey, Capturing metastable structures during high-rate cycling of LiFePO4 nanoparticle electrodes, Science, 344 (2014) 1252817.
[23] Y. Orikasa, T. Maeda, Y. Koyama, H. Murayama, K. Fukuda, H. Tanida, H. Arai, E. Matsubara, Y. Uchimoto, Z. Ogumi, Direct Observation of a Metastable Crystal Phase of LixFePO4 under Electrochemical Phase Transition, J. Am. Chem. Soc., 135 (2013) 5497-5500. [24] R. Malik, A. Abdellahi, G. Ceder, A Critical Review of the Li Insertion Mechanisms in LiFePO4 Electrodes, J. Electrochem. Soc., 160 (2013) A3179-A3197.
[25] D.A. Cogswell, M.Z. Bazant, Coherency Strain and the Kinetics of Phase Separation in LiFePO4 Nanoparticles, ACS Nano, 6 (2012) 2215-2225.
[26] R. Malik, F. Zhou, G. Ceder, Kinetics of non-equilibrium lithium incorporation in LiFePO4, Nat. Mater., 10 (2011) 587-590.
[27] P. Bai, D.A. Cogswell, M.Z. Bazant, Suppression of phase separation in LiFePO4 nanoparticles during battery discharge, Nano Lett., 11 (2011) 4890-4896.
[28] M. Tang, W.C. Carter, J.F. Belak, Y.M. Chiang, Modeling the competing phase transition pathways in nanoscale olivine electrodes, Electrochim. Acta, 56 (2010) 969-976.
[29] D. Lepage, F. Sobh, C. Kuss, G. Liang, S.B. Schougaard, Delithiation kinetics study of carbon coated and carbon free LiFePO4, J. Power Sources, 256 (2014) 61-65.
[30] H.S. Carslaw, J.C. Jaeger, Conduction of Heat in Solids, Clarendon Press, Oxford, 1959. [31] M. Doyle, J. Newman, Analysis of capacity–rate data for lithium batteries using simplified models of the discharge process, J. Appl. Electrochem., 27 (1997) 846-856.
[32] I.V. Thorat, T. Joshi, K. Zaghib, J.N. Harb, D.R. Wheeler, Understanding Rate-Limiting Mechanisms in LiFePO4 Cathodes for Li-Ion Batteries, J. Electrochem. Soc., 158 (2011) A1185-A1193.