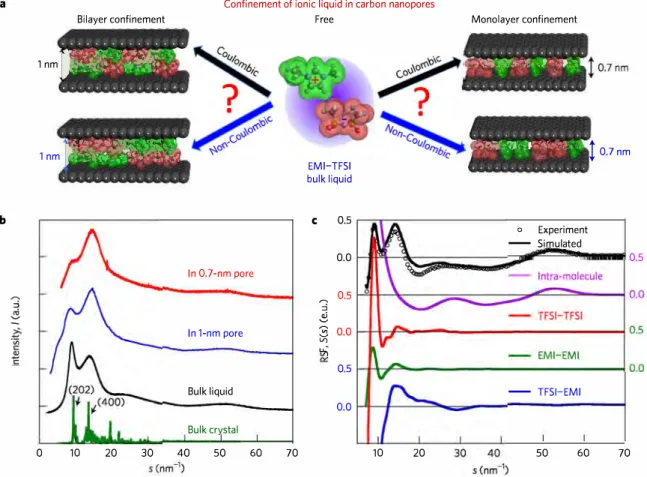
Partial breaking of the Coulombic ordering of ionic liquids confined in carbon nanopores
11
0
0
Texte intégral
Figure

+2
Documents relatifs