HAL Id: hal-01626701
https://hal.archives-ouvertes.fr/hal-01626701
Submitted on 31 Oct 2019
HAL is a multi-disciplinary open access
archive for the deposit and dissemination of
sci-entific research documents, whether they are
pub-lished or not. The documents may come from
teaching and research institutions in France or
abroad, or from public or private research centers.
L’archive ouverte pluridisciplinaire HAL, est
destinée au dépôt et à la diffusion de documents
scientifiques de niveau recherche, publiés ou non,
émanant des établissements d’enseignement et de
recherche français ou étrangers, des laboratoires
publics ou privés.
Mechanical Resistance due to Shearing of Partially Wet
Granular Media
Driss Oulahna, Romain Collet, Alain de Ryck
To cite this version:
Driss Oulahna, Romain Collet, Alain de Ryck. Mechanical Resistance due to Shearing of Partially
Wet Granular Media. kona powder and particle journal, 2013, pp.109-118. �10.14356/kona.2013012�.
�hal-01626701�
ⓒ 2013 Hosokawa Powder Technology Foundation
Abstract
Mixing granular media with a given amount of liquid is an operation conducted and used in-tensively for the preparation of concrete. The power and time required to obtain good homogeneity of the granular paste are known to have a complex relationship with the physical properties of the particles, with the liquid and with the mixer design. In this paper some of these issues are addressed by evaluating the shear resistance of a granular paste. Using model spherical materials (glass beads)
and ground and sieved minerals (calcite CaCO3), we investigate experimentally the impact of the
particle size, liquid amount and morphology of the particles.
From quasi-static experiments in shear cells, different regimes of shear resistance are revealed. In dry conditions, van der Waals’ forces dominate. In wet conditions, a capillary or consolidation re-gime where shear resistance is dominated by capillary forces is strongly impacted by the morphology of the particles and by the formation of texture. These regimes are qualitatively observed in a bowl mixer for which the variation of the current intensity correlates with the shear resistance observed in quasi-static experiments.
Keywords: wet granular mixing, shearing, quasi-static system, powder mechanics
Mechanical Resistance due to Shearing of Partially
Wet Granular Media
†1 Université de Toulouse, Mines Albi, CNRS, Centre RAPSODEE
1. Introduction
In order to understand why the mixing of a com-position requires more or less energy than another composition, we need to classify the different factors (powders and liquid properties, process parameters) and the different forces (capillary, van der Waals, gravitational, frictional and viscous forces) that have an effect on the shear resistance1-3). Usually, power or
intensity consumption measurements are taken dur-ing mixdur-ing to evaluate the different wettdur-ing states4-8).
The use of progressive addition, with a controlled flow, makes it possible to differentiate the various wetting regimes. The consumption intensity profile, represented as a function of mixing time or of the amount of liquid added, may be related to different states of liquid saturation (Fig. 1a, 1b): dry state, pendular state when particles are held together by a
liquid bridge at their contact points, capillary state, occurring when all the voids are filled with the liquid and the surface liquid is drawn back into the pores under capillary action, and funicular state as a transi-tion state between the pendular and capillary state where the voids are not fully saturated with liquid.
In a recent work9-11), we showed that the behaviour
† Accepted: September 7, 2012 1 Campus Jarlard, 81013 Albi, France * Corresponding author: E-mail: oulahna@mines-albi.fr TEL: +33-5-63-49-30-00 FAX: +33-5-63-49-30-25 V IV III I II S p ecif ic Int en si ty (A /Kg )
Liquid/Solid volume ratio "VR"
0 0.5 1 1.5 2 2.5 3 3.5 0 0.1 0.2 0.3 0.4 0.5 0.6 0.7 0.8 0.9
Fig. 1a Intensity consumption of the calcite 1 mixed
with a progressive water addition (40 ml/min; 120 rpm) and schematic wetting regime states (pendular II, funicular III, capillary IV)
of the granular medium during mixing (planetary mixer) is greatly affected by the granular properties, by the mixer process parameters and by the liquid addition method. We also studied the interparticulate porosity of granular samples removed during mixing, and the effects of particle size. Measurements of cal-cite granular porosities during mixing (with water) showed that the porosity is not constant from the dry to the capillary state9-11), the capillary state being
denser then the funicular state.
The mixing energy consumption depends on the particle interaction forces, their density and how the shear deformation occurs in the mixer. To distinguish these contributions, an alternative method is to study particulate interactions in a quasi-static shear tester, for which the shear deformation is well controlled. Generally, quasi-static tests are used with dry pow-ders to study cohesive flow behaviour. The flow data obtained can then be used to design silos and hop-pers that provide gravitational flow12, 18). We used such
a device to obtain information about cohesive (capil-lary or van der Waals forces) and frictional forces acting in wet granular media. The low velocity used leads to negligible viscous forces when compared to capillary forces. The second advantage of using a shear cell is that it simplifies definition of the shear-ing zone, which is reduced to a known surface plane. The simplicity of the shear area allows the shear stress to be calculated.
Section II of this paper presents the shear test, a short description of the Schulze annular shear cell and the materials used. Section III summarises the results obtained for the quasi-static shear cell experi-ments, taking into account the influence of the con-solidated normal load, the amount of liquid, the mean diameter, and the shape of the particles. Finally, the last section presents a comparative evaluation be-tween quasi-static and shear mixing experiments.
Table 1 Solids properties
dV10 (µm)(µm)dV50 (µm)dV90 dv90− dv10 dv50 True density ρS (g/cm3) Bulk density ρ (g/cm3) Porosity ε (%) (dry state) Contact angle (water)θ iV10 Sphericity index iV50 iV90 Glass beads 1 18 30 48 1.00 2.48 1.44 42 0 0.45 0.91 0.95 Glass beads 2 45 63 88 0.68 2.51 1.43 43 0 - - -Glass beads 3 64 88 122 0.66 2.51 1.49 41 0 0.47 0.96 0.98 Glass beads 4 78 108 149 0.66 - - - 0 - - -Glass beads 5 117 160 219 0.64 2.52 1.49 41 0 0.68 0.96 0.99 Glass beads 6 164 218 295 0.60 - - - 0 - - -Glass beads 7 194 261 353 0.61 2.52 1.46 42 0 0.60 0.94 0.99 Glass beads 8 244 332 455 0.64 2.49 1.49 40 0 - - -Calcites 1 3 29 68 2.24 2.73 1.32 51 51 0.35 0.71 0.90 Calcites 2 55 86 142 1.01 0.73 1.31 52 51 0.49 0.77 0.92 Calcites 3 102 156 225 0.79 0.73 1.36 50 51 0.51 0.73 0.89 Calcites 4 181 258 354 0.67 0.73 1.38 49 51 0.45 0.71 0.88
Fig. 1b Intensity consumption of the calcite (left) or glass beads (right) mixed with a progressive water addition (40 ml/
2. Materials, Experimental Set-up and Methods The materials used (Table 1) were spherical glass
beads supplied by SOVITEC® and calcites supplied
by OMYA®. The volume size distributions were
obtained by a MALVERN® Mastersizer 2000. The
wetting angles with water θ were obtained from
capillary rise experiments, using the methodology
of Galet13). The average volume roundness index
iV50 (ratio of the smaller and higher diameters of the
particle) came from a volumetric roundness
distribu-tion obtained with the MALVERN® PharmaVision
830 (PVS) automated optical device (2D). The true
density of the solids ρS was obtained using a helium
pycnometer (Accupyc 1330-MICROMERITIC®), and
the dry porosities ε (or the compacity C) by using
the values of the true ρS and bulk ρ densities:
ε = 1 − ρρ
s = 1 − C (1)
The liquid used for all the tests was water.
Every quasi-static shear test was carried out with a dr y or wet granular medium previously mixed
in a planetar y mixer from the CAD® Company
(Mlx60)9-11). This mixer can be used to make a paste,
and it allows the power consumption to be recorded at a frequency of 10 points per second. The available rotation velocity is between 0 and 300 rpm and the volume of the bowl is 4 litres. A preliminary study al-lowed the process parameters to be set at the follow-ing values: an impeller speed of 120 rpm, a droplet-by-droplet liquid flow rate of 40 ml/min, and an initial
bulk volume of 1250 cm3, corresponding to a 32%
filling rate of the bowl mixer.
To study the interaction forces that take place
dur-ing the sheardur-ing, we used an annular shear cell allow-ing a sheared interface of known constant area. The
shear velocity was given by the rotational speed (ω
= 3.5 10-3 rad/s, ranges from 100 to 200 µm/s from
the inner (6 cm) to the outer (12 cm) diameter of the cell). These velocities give very low capillary num-bers (of the order 10-5), allowing the viscous forces to
be neglected in these quasi-static experiments. An experimental standard method developed by
Jenike14, 18) was used. This method consists of
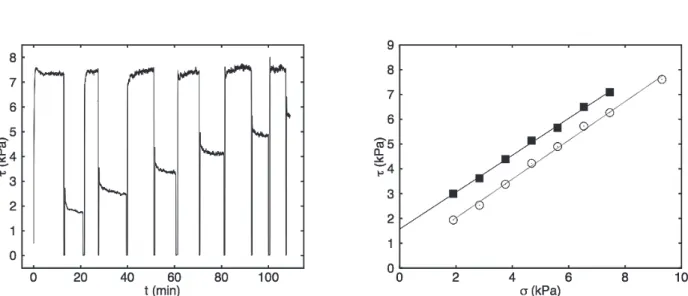
mea-suring a yield locus, i.e. the tangential stress neces-sary to shear a granular medium for a given normal stress and a powder sample previously prepared by a consolidation process. It is a two-step measurement. During the first step, the shear under a normal stress σc consolidates the granular sample to a critical state
where there are no further variations in volume. The resulting consolidated shearing stress τc is constant.
The sample is then sheared under a normal load
σ, which is lower than σc. This second step allows
the yield shear stress τy to be obtained at the peak,
and the steady-state shear stress τD to be measured
when a plateau is reached again in the shear stress versus deformation curve or time. These two stages are repeated several times with a constant
consoli-dated normal stress σc and an increasing normal
stress15-16) (see Fig. 2).
The curves representing the yield and the
steady-state shear stress (τS or τD) versus the normal
stress σ are called the yield17-19) and the dynamic
lo-cus, respectively. In the present study, they are both well fitted by a linear Coulombic law:
τx = µxσ + cx (2)
Fig. 2 Shear test (left) and corresponding yield (squares) and dynamic (circles) locii for the 50-125 µm sieved calcite with
It was observed experimentally that the dynamic co-hesion is close to zero and the dynamic behaviour is only characterised by the dynamic friction coefficient (µD) linked to the frictional forces between particles.
The cohesion c (= cy), coming from the yield locus
built with peak stresses is directly linked to the cohe-sive forces (capillary and van der Waals forces). Since the cohesion appears to increase with the consolidation, this procedure is repeated for at least three normal consolidation stresses. Finally, follow-ing the Jenike methodology, rather than usfollow-ing the pair (c, σc), we compute the unconfined yield stress
fc and the maximal principal stress σI. These
quanti-ties are obtained from the yield locus using the Mohr circles representative of the stress state of an uncon-fined material at failure, and the maximal stress state for this consolidation (the left and right circles in Fig. 3, respectively). fc is the minimal stress necessary
to shear an unconfined consolidated material and σI
the maximal stress that this consolidated material has experienced previously. It is observed that the greater the consolidation, the greater the unconfined yield stress. The one-point Flow Function as defined by Schultze18) is the ratio (σ
I/fc). In this paper, we
investigate the evolution of the ratio (fc/σI): inverse
ratio of the definition of Schulze. Changes in the ra-tio is an increasing funcra-tion whose slope is limited.
Indeed, the yield stress τy remains lower than the
shear stress at consolidation (τC = μD σC), which
gives the yield locus in Fig. 3 a positive slope. As a consequence, the diameter of the left Mohr circle is, at most, equal to the diameter of the right Mohr circle, giving the following:
σfC I
2µD
1 + µD (3)
3. Quasi-Static Results and Discussion 3.1 Consolidation and liquid amount effect The effects of consolidation and liquid amount on cohesive and frictional interactions were studied with both glass beads and calcites at different particle size
distributions (Table 1). They were sheared in dry
conditions and wet states with a volume-liquid ratio (VR: ratio of liquid volume by solid volume) up to 0.6.
From each yield locus, the cohesion is linearly
ex-trapolated and Fig. 4-left gives the results obtained
for the calcite sieved between 50 and 125 µm. The cohesion, which has a non-zero value at the dry state due to the van der Waals forces, increases when add-ing the liquid to reach a plateau value when the liquid amount attains 10% in volume. This plateau is main-tained until 60% in volume.
Three consolidation normal stresses were used (0.25, 0.5 and 1 kPa). It was observed that the cohe-sion increases proportionally to the consolidation normal stress. As a consequence, for reasons of clar-ity, the results will be presented using the ratio fc/σI.
This ratio is independent of the consolidation, in the range of liquid content between 10 to 60%. The Flow Function (the relationship between the unconfined yield stress fc and the maximal principal stress σI) is
therefore fully characterised by their ratio.
To conclude this section, the cohesion for wetted
Fig. 3 Yield locus construction from shear experiment
data. Mohr circles for the determination of fc and σI. 0 0.5 1 1.5 2 2.5 3 0 0.1 0.2 0.3 0.4 0.5 0.6 0.7
Liquid/Solid volume ratio "VR"
C oh es io n "c "( K P a) 0,25 KPa 0,5 KPa 1 KPa 0,25 KPa 0,5 KPa 1 KPa Dynamicfrictioncoefficient " µ D "
Liquid/Solid volume ratio "VR"
0.4 0.5 0.6 0.7 0.8 0.9 1 0 0.1 0.2 0.3 0.4 0.5 0.6 0.7
Fig. 4 Cohesion (left) and dynamic friction coefficient (right) of the calcite 50-125 µm as a function of liquid amount, for
granular media is linked both to the liquid and to the compacity (caused by the consolidation procedure in a shearing test). Strengthening by the addition of liquid is considerable from the dry state to a liquid/ solid volume ratio equal to 0.1. For higher liquid amounts, the cohesion remains constant, and the strength is only dependent on the consolidation. These results are in accordance with the fact that the capillary force does not vary very much with the volume of the liquid bridge20, 21). As a consequence, in
the following section, we shall restrict discussion to only two cases: the dry state and the funicular state. The latter is chosen at a mean value for a liquid ratio between 30 to 40%, for which the quasi-static results and energy consumption for mixing presented in section IV are mainly independent of the liquid ratio. Finally, the presence of liquid also modifies the dy-namic friction behaviour of the granular medium. 3. 2 Particle size effect
For both glass beads and calcites, the evolutions of the dynamic coefficient of friction µD and the ratio (fc/
σI) were studied while varying the mean size of the
quasi-monodisperse granular materials.
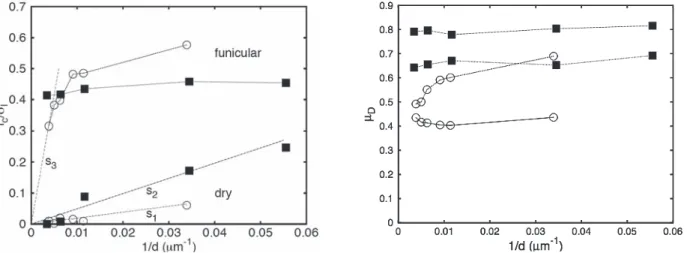
Glass beads and calcites with different sizes (be-tween 30 and 330 µm) were used to perform shear experiments in the dry and funicular wet state. The ratio (fc/σI) and dynamic friction coefficient data from
yield and dynamic loci are displayed as a function of the inverse of particle diameter in Fig. 5.
For the unconfined yield stress normalised by the principal maximal consolidation stress, Fig. 5-left dis-plays the behaviour at dry and funicular conditions. Dry case, calcites and glass beads: The evolution of (fc/σI) for the dry case is close to being
inversely proportional to the particle size, as may be
inferred by the Rumpf relation22). Rumpf writes the
tensional resistance T of a cohesive granular material as:
T = 2
π f
d2(1 − ε) κ , (4)
where f is the interparticulate force, d the particle di-ameter, ε the porosity and κ the coordination num-ber. For dry particles, the interparticulate forces are van der Waals forces, which for spheres are given by:
fvdW≈ Ad
h2 , (5)
where A is the Hamaker constant and h the interdis-tance between particles. They are proportional to the particle size and therefore the tensional or shear re-sistance of the dry powder is expected and observed in Fig. 5-left to be proportional to the inverse of the particle size (Eq. 5 in Eq. 4).
It is possible to obtain the constant of proportional-ity between the Flow Function and the particle size for the calcites and the glass beads by measuring the slopes s1 and s2 in Fig. 5-left. Their difference when
changing the material is due to several factors: the Hamaker constant A is different, the roughness and sphericity of both materials are different and finally, the texture of the particle assembly, i.e. the poros-ity and coordination number may be different. For ε and κ, which are geometric numbers, we expect equivalent values for both materials since they are close to monodispersity.
We find that the ratio of the slopes of the linear fits of (fc/σI) versus (d-1) in the dry conditions for the
Fig. 5 Inverse of the one-point Flow Function of calcites and glass beads (left) or coefficient of dynamic friction (right) as
calcite and glass beads gives a factor of 2.4, which is similar to the ratio of the Hamaker constants of the two materials (Aglass = 6.5 10-20 J, Acalcite = 10.1 10-20 J).
This result is quite satisfying and indicates that the particle roughness and the morphology of the calcite, compared to the glass beads, have a low impact on the magnitude of the van der Waals forces.
Wet case, glass beads: In the funicular state, the dominant interparticulate force is the capillary force, which can be written as:
fcapillary≈ γd , (6)
in the case of wetted spheres (Fig. 6-left) where γ
is the surface tension of the liquid employed. Here again, the interparticulate force is proportional to the particle size, and we therefore expected shear resis-tance to increase proportionally with d-1, with a
con-stant of proportionality greater than in the dry case. However, this is not what was observed. Although we noticed an increase in the shear resistance when
decreasing the size (Fig. 5-left, upper data points),
the proportionality with d-1 was only perceptible for
the glass beads at particle sizes greater than 100 µm. The linear fit between (fc/σI) and (d-1) in this range
gives a slope s3 (Fig. 5-left) 500 times greater than
the slope in the dry case (slope s1 in Fig. 5-left). The ratio of capillary and van der Waals forces is then of the order (fcapillary/fVdW) ~
γh2
A ~ 500, leading to a van
der Waals interdistance (roughness) hglass-beads ≈ 20
nm, a reasonable value giving some confidence in the interpretation of the quasi-static shear resistance for glass beads of a size greater than 100 µm.
For the smaller sizes of glass beads, the shear strength becomes lower than that extrapolated from
the behaviour of (d-1). This is due to the fact that
the ratio fc/σI is bound to a value around 0.8 for the
glass beads (Eq. 3). We then observe the transition between a capillary regime for large particles (larger than 100 µm) where the shear resistance decreases as the inverse of the particle size when increasing the size, and a consolidation regime for the small sizes (smaller than 100 µm) where the shear resistance cannot increase proportionally with the inverse of the particle size, but is limited by the consolidation. In this small size regime, the Rumpf relation (Eq.
4) suggests that a formation of texture takes place and that the porosity and/or coordination number decreases when the particle size decreases. This ob-servation is corroborated by the obob-servation of the dynamic coefficient of friction (Fig. 5-right).
For glass beads at high particle sizes, the differ-ence in behaviour for the funicular and dry states tends towards zero, which is expected if the capillary interparticle forces become negligible compared to the particle weight, together with a similar textura-tion of the powder bed.
Wet case, calcites: For the wet calcites, in the range of sizes used (30 to 250 µm), the shear strength is quasi-constant (fc/σI ≈ 0.42 ± 0.2). In particular, we
do not observe the regime at high particle size ap-proaching the dry case, as for the glass beads. This difference of behaviour between the glass beads and the calcites is interpreted as follows: the tensional or shear resistance is scaled by fcapillary/d2, where the
capillary force scales like the product of the Laplace pressure multiplied by the area of the meniscii. For wetted particles, the area of the meniscii scales like d2 and therefore we have:
fcapillary≈ γ
rd2, (7)
where r is the radius of curvature of the meniscii. If the particles are smooth spheres like the glass beads, r ~ d and T ~γ/d. If the particles are rough with some flatness, r is close to the roughness, and then T ~ γ/r is independent of the particle size (see Fig. 6-right). The independency of the strength and the particle size for the calcites suggests that this morphology effect takes place. For grains of irregular shapes with flattened surface areas, the curvature of the meniscii is then controlled by the local roughness of these areas, leading to a constant shear resistance. Nevertheless, this argument supposes that the local roughness is independent of the particle size for the range of particle sizes studied here. This point merits further investigation.
This size independency is also observed in dynam-ic conditions for the corresponding µD in dry and
fu-nicular conditions (Fig. 5-right). In particular, there is no convergence of the wet dynamic coefficient of friction towards the dry one when the particle size is increased, indicating that the capillary forces remain greater than the weight of the particles for all the sizes of calcites used.
Conclusion on the particle size effect in
quasi-static experiments: The use of a shear cell allowed us to measure quantitatively the Flow Func-tion of spherical and non-spherical particles in dry
Fig. 6 Liquid bridge of wetted spheres and (left) radius
r of curvature of the meniscii for particle with some flatness (right).
and wet conditions. From the results obtained, we ex-tracted different shear resistance mechanisms. When the particles are dry, the shear resistance is induced by van der Waals interparticle forces (Eq. 4), which leads to a shear resistance inversely proportional to the mean size of the particles. This shear resistance remains weak enough to remain below the saturation due to consolidation, and we observe only this van der Waals-dominated regime for all the range of par-ticle sizes for both calcites and glass beads.
When they are wetted by 10 to 60% v/v by water, the shear resistance is induced by the capillar y forces, which are of higher magnitude than the van der Waals forces. Depending on the morphology of the particles, this capillary force is given by Eqs. (5) or (6), leading to a shear resistance inversely propor-tional to the mean particle size for the glass beads and a constant shear resistance for the non-spherical calcites. This capillary regime may be dominated by a consolidation regime where the shear resistance is limited by the consolidation (Eq. 3).
These quantitative measurements allow us to discrim-inate between different regimes of shear resistance. We shall now investigate whether these different regimes can be qualitatively observed in a planetary mixer, for which neither the surface of the sheared area nor the stresses acting upon it can be obtained, and only the torque on the impeller is measurable. 4. Comparison Between Quasi-Static and
Shear-Mixing Experiments
In order to compare the quasi-static shear
experi-ments with the shear-mixing experiexperi-ments, we record-ed the current intensity requirrecord-ed to mix at constant velocity in dry and funicular conditions obtained by reading the actual current intensity minus the cur-rent intensity when the bowl is empty. The rotational velocity of the impeller was also recorded in order to check that it remained constant and thus provided a proportionality between this current intensity and the torque on the impeller or the power consumed. For these experiments, the mass was adjusted to obtain the same bulk volume in the mixer (leading to Mglass = 1830 ± 30 g and Mcalcite = 1650 ± 150
g). We should then expect that the surface sheared remained approximately the same for all the experi-ments. Fig. 7 reports the ratio Im = I/M obtained for
the calcites and glass beads.
This mixing intensity was expected to be propor-tional to a mean force acting on the bowl, which may be heuristically written as:
I ∝ S (c + µDσ) , (8)
where S is the mean sheared surface in the mixer, which is not properly defined, as in the quasi-static experiments of section III.c, and σ the mean cohe-sion and normal stress exerted by the powder on this shear plane. The normal stress was again not measured, but for a half-filled bowl, we expected that the main contribution would be the weight of the particles themselves. σ is then expected to be pro-portional to the mass M, introduced as: (σ = βM),
where β is a geometrical proportionality constant.
The powder in the mixer to be consolidated by this normal stress, and therefore the cohesion, writes
Fig. 7 Left: specific intensity at dry or funicular state versus the inverse of the mean diameter. Right: scaled specific
intensity at funicular state (Eq. 6) versus the inverse of the one-point Flow Function. Squares: calcites, circles: glass beads.
as: c = λ(fc/σI)σ, where λ is a coefficient of order
unity. We then have: Im=S β(λ fc
σI + µD) (9)
In the latter expression, (Sβ) is unknown. In order to eliminate this unknown parameter, we can only compare two experiments with the same geometry. In dry conditions and for particle sizes greater than 100 µm, the mechanical behaviour of the powders used are those of a non-cohesive powder. As a conse-quence, we have:
I∗
m=S βµ∗D, (10)
where the asterisk indicates the dry non-cohesive conditions. From Eqs. (9) and (10), we can now relate the measured intensities and quasi-static character-izations of the powders with the following expression: µ∗D Im I∗ m − µD∝ fc σI, (11)
where the coefficients of order unity are taken to unity. This relation was checked by plotting the left
member of Eq. (11) versus the right member in Fig.
7-right.
We observe in this figure that the calcites present a weak variation in both coordinates: in quasi-static and dynamic experiments, the mechanical resistance is mainly constant. The data points representing the calcite collapse, along with those obtained for the glass beads. For the glass beads, the variations for both coordinates are in correct linear correlation. These correlations remain qualitative and although it would be of interest to add more experimental data for different materials and equipments, they never-theless give some credence to the assertion that the shear resistance in the mixer at funicular state may be described by the quasi-static resistance of a pow-der consolidated and submitted to its own weight. The correlations indicate that the variation of the shear resistance with the mean size of the particles is similar in both quasi-static shear cell and mixer for dry and funicular conditions as directly observed in Fig. 8, where the results of Fig. 7 are plotted versus d-1 for direct comparison with Fig. 5-left (two upper
curves).
Finally, for the glass beads of 100 µm mean diam-eter, we checked that the viscous forces remain neg-ligible in the mixer under the operating conditions or the rotational velocity used. To do this we performed a series of experiments with water-glycerol mixtures of different viscosities. The results obtained are
dis-played in Fig. 9, which shows the intensity versus
the viscosity, both scaled with the values obtained for pure water. It is particularly noticeable that the exper-iments with water are on a plateau: I does not depend on the viscosity, indicating that the viscous forces are negligible compared to friction and capillary forces in our experiments with water.
5. Concluding Remarks
A quasi-static system was used to obtain the cohe-sion (due to capillary or van der Waals forces) and frictional forces acting in sheared granular media. They present a rich phenomenology, depending on the dominant forces in action and on the texturation
Fig. 8 Results of Fig. 7-right versus the inverse of the
mean diameter. Squares: calcites, circles: glass beads.
Fig. 9 Intensity consumption at funicular state for
wa-ter-glycerol, scaled by the intensity using water, versus the corresponding scaled viscosity for 100 µm glass beads.
taken by the paste.
This quasi-static behaviour is shown to explain qualitatively the behaviour of the same granular media sheared in a planetary mixer at the funicular state. The agreement between the two types of exper-iments suggests that the consolidation process in the bowl mixer is identical for all the samples explored and close to a consolidation due to the weight of the particles themselves.
This correlation between quasi-static experiments and planetary mixer experiments indicates that the strengthening of the granular material is similar in the funicular state in both cases. The shear resistance regimes investigated quantitatively in the quasi-static shear cell (van der Waals, capillary particle morphol-ogy and texturation regimes) all apply.
Acknowledgements
It is a pleasure to thank M. Martin and P.-H. Jézéquel from Société Lafarge for their support and contribution to this research field, and the referee for the remarks that led to improvements in the article. List of symbols
A Hamaker constant
C Compacity (%)
c Cohesion (Pa)
d=dv50 Mean particle diameter (µm)=dp
fC Unconfined yield stress (Pa), (another
com-mon designation is σC)
fcapillary Capillary force
fvdW van der Waals force
h Interdistance between solid paticles
iv50 Mean volume roundness index (-), sphericity
index
I Intensity (A)
Im Specific intensity (A/Kg), = I/MS
k Coordination number
ms Solid mass (g)
Ms Solid mass (kg)
r Radius of curvature of meniscii.
S Mean sheared surface
T Tensional resistance of a cohesive granular
materials
t Time (s)
(σI/fc) One-point Flow Function (-)
VP Porous volume (cm3)
Vs Volume of dry solid (cm3)
VL Volume of liquid (cm3)
VR Ratio of liquid volume by solid volume (-)
VT Total volume (cm3) = (VP + VS)
Greek symbols
ε Interparticulate porosity of dry granular
me-dium
γ=γL Liquid surface tension (mN.m-1)
θ Liquid-solid contact angle (°), by capillary
rise experiments
ρS Solid true density (g.cm-3)
ρ Solid bulk density (g.cm-3)
ω Angular shear velocity (rad.s-1)
σ Normal stress (Pa)
σC Consolidation normal stress (Pa)
τS Yield shear stress (Pa)
τD Steady-state shear stress (Pa)
τC Consolidation shear stress (Pa)
µD Dynamic friction coefficient (-)
σI Major principal stress (Pa),
ηwater Water viscosity (Pa.s)
ηW-G Water-glycerol viscosity (Pa.s)
β Coefficient: geometrical proportionality
con-stant (Eq.9)
λ Coefficient of order unity (Eq.9)
References
1) Feng, J. Q., Hays, D. A. (2003): Relative importance of electrostatic forces on powder particles, Powder Tech-nology, Vol.135, pp.65-75.
2) Iveson, S. M., Beathe, J. A. and Page, N.W. (2002): The dynamic strength of partially saturated powder com-pacts: The effect of liquid properties, Powder Technol-ogy, Vol.127, pp.149-161
3) Seville, J. P. K., Willett, C. D. and Knight, P. C. (2000): Inter-particle forces in fluidisation: A review, Powder Technology, Vol.113, pp.261-268.
4) Betz, G., Bürgin, P. J. and Leuenberger, H.,(2003): Power consumption profile analysis and tensile strength measurements during moist agglomeration, International Journal of Pharmaceutics, Vol.252, pp.11-25.
5) Betz, G., Bürgin, P. J., and Leuenberger, H. (2004): Power consumption measurement and temperature recording during granulation, International Journal of Pharmaceutics, Vol.272, pp.137-149.
6) Cazacliu, B., and Legrand J, (2008): Characterization of the granular-to-fluid state process during mixing by power evolution in a planetary concrete mixer, Chemi-cal Engineering Science, Vol.63, pp.4617-4630. 7) Goldszal, A., and Bousquet, J. (2001): Wet
agglomera-tion of powders: From physics toward process optimi-zation, Powder Technology, Vol.117, pp.221-231. 8) Newitt, D. M., Conway-Jones, J. M. (1958): A
Transac-tions of the Institution of chemical Engineers, Vol.36, pp.422-442.
9) Collet, R., Oulahna, D., De Ryck, A., Jézéquel, P. H. and Martin, M. (2010): Mixing of a wet granular me-dium: Effect of the Particle size, the liquid and the granular compacity on the intensity consumption, Chemical Engineering Journal, Vol.164, pp.299-304. 10) Collet, R., Oulahna, D., De Ryck, A., Jezequel, P. H.
and Martin, M. (2011): Mixing of a wet granular me-dium: Influence of the liquid addition method, Powder Technology, Vol.208, pp.367-371.
11) Collet, R. (2010): “Critères de malaxabilité des mé-langes granulaires humides”, Ph.D. Thesis, Université de Toulouse, France.
12) Rhodes, M. (1990): “Principles of powder technology”, John Wiley & Sons.
13) Galet, L., Patry, S. and Dodds, J. (2010): Determination of the wetability of powders by the Washburn capil-lary rise method with bed preparation by a centrifugal packing technique, Journal of Colloid and Interface Science, Vol.346, pp.470-475.
14) The institution of chemical engineers (1989), Standard shear testing techniquefor particulate solids using the shear cell, IchemE.
15) Carson, J. W., Wilms, H. (2006): Development of an international standard for shear testing, Powder Tech-nology, Vol.167, pp.1-9.
16) Schwedes, J. (1996): Measurement of flow properties of bulk solids, Powder Technology, Vol.88, pp.285-290. 17) Johanson, K., Rabinovich, Y., Moudgil, B., Breece,
K.and Taylor, H. (2003): Relationship between par-ticle scale capillary forces and bulk unconfined yield strength, Powder Technology, Vol.138, pp.13-17. 18) Schulze, D. (2008): “Behaviour, characterization,
stor-age and flow”, Powders and bulk solids, Springer. 19) Bocquet, L., Charlaix, E. and Restagno, F. (2002):
Physics of humid granular media, Comptes Rendus Physique, Vol.3, pp.207-215.
20) Pierrat, P. and Caram, H. S. (1997): Tensile strength of wet granular materials, Powder Technology, Vol.91, pp.83-93.
21) Pietsch, W. (1991): “Size enlargement by agglomera-tion”, John Willey & Sons, New Jersey.
22) Rumpf, H. (1962): “The strength of granules and ag-glomerates”, In William A. Knepper, editor, Agglom-eration, Interscience publishers, New York.
Author’s short biography
Driss Oulahna
Driss Oulahna received his chemical engineering degree in 1988 and his PhD in chemical and process engineering in 1992 from École des Mines de Saint-Etienne, France. After a post-doctoral position, he joined the Process Engineering Labora-tory of Rapsodee Center-CNRS 5302, École des Mines d Albi (France) as assistant professor in 1996. His research is in the field of powder technology (agglomeration, granulation, compaction) and particle characterisation methods such as solids-liquids interactions and their role in chemical engineering processes.
Romain Collet
Romain Collet obtained a master s degree in “Applied physico-chemistry of Materi-als” in 2006 from Montpellier II university. After a PhD at École des Mines d Albi where he studied “Criteria of blending wet granular mixtures”, he joined Parex-Group (R&D center, Saint Quentin Fallavier, France). He is currently an R&D engi-neer and works on the formulation of ready-to-use mortars for floors (tile adhesive, grout and floor covering).
Alain De Ryck
Alain de Ryck is a graduate of the École polytechnique (1990), has a MSc in solid physics (Université Paris-Sud) and a PhD in physics (UPMC, Paris 1994). After a post-doctoral position in fluid mechanics at the Instituto Pluridisciplinar-Universi-dad Complutense, Madrid, he joined the Rapsodee Center-CNRS 5302, Ecole des Mines d Albi in 1996. Professor and former director, he currently works on granu-lar friction and flows of cohesive bulk materials, gas-solid interactions.