HAL Id: hal-03117583
https://hal.archives-ouvertes.fr/hal-03117583
Submitted on 21 Jan 2021
HAL is a multi-disciplinary open access
archive for the deposit and dissemination of
sci-entific research documents, whether they are
pub-lished or not. The documents may come from
teaching and research institutions in France or
abroad, or from public or private research centers.
L’archive ouverte pluridisciplinaire HAL, est
destinée au dépôt et à la diffusion de documents
scientifiques de niveau recherche, publiés ou non,
émanant des établissements d’enseignement et de
recherche français ou étrangers, des laboratoires
publics ou privés.
in the Mediterranean Basin
Nora Zannoni, Valerie Gros, Roland Sarda Esteve, Cerise Kalogridis, Vincent
Michoud, Sebastien Dusanter, Stephane Sauvage, Nadine Locoge, Aurelie
Colomb, Bernard Bonsang
To cite this version:
Nora Zannoni, Valerie Gros, Roland Sarda Esteve, Cerise Kalogridis, Vincent Michoud, et al..
Sum-mertime OH reactivity from a receptor coastal site in the Mediterranean Basin. Atmospheric
Chem-istry and Physics, European Geosciences Union, 2017, 17 (20), pp.12645-12658.
�10.5194/acp-17-12645-2017�. �hal-03117583�
https://doi.org/10.5194/acp-17-12645-2017 © Author(s) 2017. This work is distributed under the Creative Commons Attribution 3.0 License.
Summertime OH reactivity from a receptor coastal site
in the Mediterranean Basin
Nora Zannoni1,a, Valerie Gros1, Roland Sarda Esteve1, Cerise Kalogridis1,2, Vincent Michoud3,4, Sebastien Dusanter3, Stephane Sauvage3, Nadine Locoge3, Aurelie Colomb5, and Bernard Bonsang1
1LSCE, Laboratorie Scientifique du Climat et de l’Environnement, CNRS-CEA-UVSQ, IPSL, Université Paris-Saclay,
91191 Gif sur Yvette, France
2Institute of Nuclear Technology and Radiation Protection, National Centre of Scientific Research “Demokritos”,
15310 Ag. Paraskevi, Attiki, Greece
3IMT Lille Douai, Univ. Lille, SAGE – Département Sciences de l’Atmosphère et Génie de l’Environnement,
59000 Lille, France
4Laboratoire Interuniversitaire des Systèmes Atmosphériques (LISA), CNRS – UMR7583, Université Paris-Est-Créteil et
Université Paris Diderot, Institut Pierre Simon Laplace, Créteil, France
5LAMP, Campus universitaire des Cezeaux, 4 Avenue Blaise Pascal, 63178 Aubiere, France anow at: Air chemistry department, Max Planck Institute for Chemistry, Mainz, Germany
Correspondence to:Nora Zannoni (nora.zannoni@mpic.de) and Valerie Gros (valerie.gros@lsce.ipsl.fr)
Received: 28 July 2016 – Discussion started: 4 October 2016
Revised: 3 September 2017 – Accepted: 5 September 2017 – Published: 25 October 2017
Abstract. Total hydroxyl radical (OH) reactivity, the total loss frequency of the hydroxyl radical in ambient air, pro-vides the total loading of OH reactants in air. We mea-sured the total OH reactivity for the first time during sum-mertime at a coastal receptor site located in the western Mediterranean Basin. Measurements were performed at a temporary field site located in the northern cape of Corsica (France), during summer 2013 for the project CARBOSOR (CARBOn within continental pollution plumes: SOurces and Reactivity)–ChArMEx (Chemistry and Aerosols Mediter-ranean Experiment). Here, we compare the measured total OH reactivity with the OH reactivity calculated from the measured reactive gases. The difference between these two parameters is termed missing OH reactivity, i.e., the fraction of OH reactivity not explained by the measured compounds. The total OH reactivity at the site varied between the instru-mental LoD (limit of detection = 3 s−1) to a maximum of 17 ± 6 s−1 (35 % uncertainty) and was 5 ± 4 s−1 (1σ SD – standard deviation) on average. It varied with air tempera-ture exhibiting a diurnal profile comparable to the reactivity calculated from the concentration of the biogenic volatile or-ganic compounds measured at the site. For part of the cam-paign, 56 % of OH reactivity was unexplained by the
mea-sured OH reactants (missing reactivity). We suggest that ox-idation products of biogenic gas precursors were among the contributors to missing OH reactivity.
1 Introduction
Atmospheric photo-oxidation reactions are initiated by three main oxidants: the hydroxyl radical (OH), ozone (O3) and the
nitrate radical (NO3). Among those, the OH radical is by far
the most important, capable of reacting with the vast majority of chemical species in the troposphere (Levy, 1971). Photo-oxidation reactions are the most efficient cleansing processes occurring in the atmosphere, and they constitute an impor-tant sink for reactive gases including volatile organic com-pounds (VOCs).
Total OH reactivity is the first-order total loss rate of the hydroxyl radical in the atmosphere due to reactive molecules. It is the total sink of OH, therefore representing a top-down measure of OH reactants present in ambient air.
Measurements of the total loss of OH and OH reactive gases are often coupled. The total reactivity of the latter is determined by summing each gas individual reactivity as the
product of their atmospheric concentration and their reaction rate coefficient with OH. Here, this is referred to as calcu-lated OH reactivity, and comparisons between the calcucalcu-lated and the measured OH reactivity have showed that discrep-ancies in various environments exist (Di Carlo et al., 2004; Nölscher et al., 2016). The missing OH reactivity, namely the fraction of OH reactivity not explained by simultaneous measurements of reactive gases, has been associated with un-measured compounds either primary emitted, secondary gen-erated, or both (e.g., Sinha et al., 2010; Nölscher et al., 2012a, 2013; Edwards et al., 2013; Hansen et al., 2014; Kaiser et al., 2016).
The Mediterranean Basin comprises countries from three different continents and a population of 450 million inhabi-tants. Its climate is characterized by humid-cool winters to hot-dry summers, when the area is usually exposed to in-tense solar radiation and high temperatures. Forests, wood-lands and shrubs occupy large areas of the region, which has rich biodiversity and is the habitat to a high number of iden-tified species (Cuttelod et al., 2008). The dominant airflow in summertime is driven from north to south; therefore, the basin is exposed to air masses coming from European cities and industrialized areas. Transported pollution and the in-tense local anthropogenic and biogenic activity result in high loadings of atmospheric gases, particles and complex chem-istry (Lelieveld, 2002).
Climate model predictions indicate that the Mediterranean area will face unique impacts of climate change. Predictions show that this region will suffer higher temperatures and ex-tended drought periods, thus affecting the strength and type of emissions which will further impact air quality and climate (Giorgi and Lionello, 2008). Finally, additional observations are useful for better predicting the future state of this region (Mellouki and Ravishankara, 2007).
In this study, we address the following scientific questions:
1. What proportion of the total reactive gases emitted and formed over the area do we know and can we detect?
2. Which species mostly influence the OH reactivity over this site within the basin?
To answer these questions, we measured the total OH reac-tivity at a receptor coastal site in the western Mediterranean Basin during summer 2013. Measurements were part of an intensive fieldwork campaign aimed at investigating sources and sinks of gaseous constituents in the area (CARBOSOR, CARBOn within continental pollution plumes: Sources and Reactivity, within the ChArMEx project, Chemistry and Aerosols in a Mediterranean Experiment; ChArMex, 2017, website: http://charmex.lsce.ipsl.fr/). We measured the total OH reactivity with the comparative reactivity method in-strument (CRM) (Sinha et al., 2008) during 16 July–5 Au-gust 2013 at the monitoring station of Ersa, France. The field site was chosen for being (i) far from anthropogenic sources and (ii) exposed to aged air masses of different
ori-gins, including air masses enriched in oxidation products transported from continental industrialized areas. Total OH reactivity here served to evaluate whether the ambient re-active gases were all identified or not. Specifically, it was useful to determine what kind of pollution event could be better captured through the instrumentation deployed at the site, assuming that a group of reactive gases traces a spe-cific type of event (primary anthropogenic or biogenic emis-sions, secondary formation). Due to the high number of ex-isting VOCs, OH reactivity also makes a powerful means for investigating VOC emissions and reactions. The follow-ing sections will describe the field site under study (Sect. 2), the methodologies used (Sect. 3), our results of OH reactiv-ity (Sect. 4) and insights into the unmeasured reactive gases (Sect. 4.4).
2 Field site
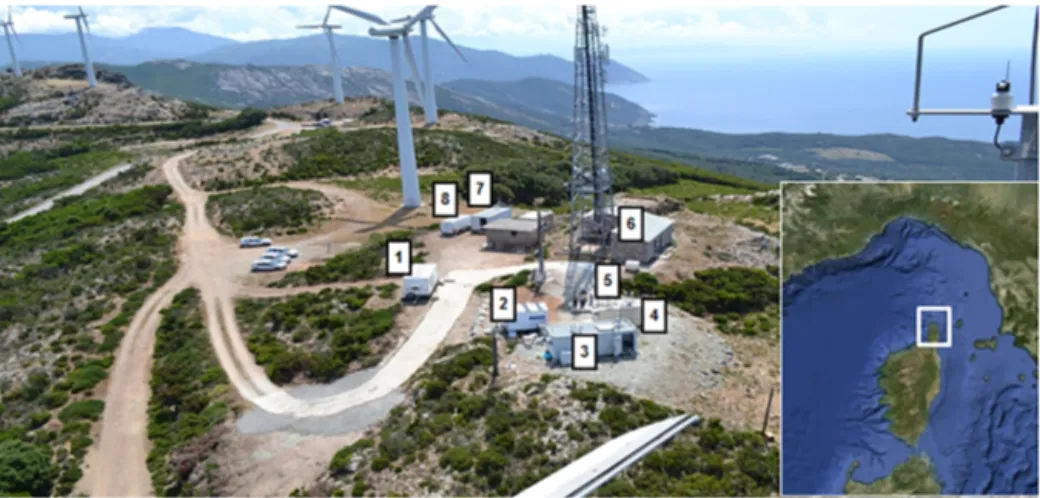
The Ersa windfarm (42.97◦N, 9.38◦E, altitude 533 m) is lo-cated in the northern cape of Corsica (France), in the west-ern Mediterranean Basin (Fig. 1). It is 2.5 km away from the nearest coast (west side) and 50 km away from the largest closest city and harbor Bastia (south side). It is located on a hill (533 m a.s.l.) and it is surrounded by the Mediter-ranean Sea on the west, north and east sides. The site is ex-posed to air masses from continental areas especially France and northern Italy, with the harbors of Marseille and Genoa about 300 km away, and the industrialized areas of Milan and the Po Valley 400 km away. Furthermore, the ranean maquis, a shrubland biome typical of the Mediter-ranean region, densely surrounds the measurement station. The ground station consists of a long-term meteorology, trace gas concentrations, aerosol size and composition monitor-ing laboratory (measurements collected from 2012 to 2014), and temporary measurements of gases and aerosol properties over a total surface area of ∼ 100 m2where instruments are distributed. Measurements of total OH reactivity and trace gases reported in this study were all performed within this area (see Fig. 1 for details).
We measured the OH reactivity during two main periods: an intercomparison exercise for OH reactivity between two CRM instruments during 8–13 July 2013 (see Zannoni et al., 2015), and the intensive ambient monitoring campaign, CARBOSOR during 16 July–5 August 2013. Within the same project, instruments for measuring radicals, inorganic and organic compounds, aerosol chemical composition and physical properties, and meteorology were simultaneously deployed. The next section will provide an overview of the methods selected for this study.
Figure 1. Field site top view, Corsica, France (42.97◦N, 9.38◦E; altitude 533 m). Measurements performed: (1) VOCs through PTR-MS and online and offline chromatography; (2) OH reactivity; (3) NOx, O3, aerosol composition and black carbon; (4) weather, and particle
microphysics; (5) HCHO, trace gases and radicals; (6) CO, CO2, CH4; (7) trace gases and particle filters; and (8) particle physics. The photo was taken during the installation of the instruments.
3 Methods
3.1 Comparative reactivity method
We carried out measurements of total OH reactivity us-ing a comparative reactivity method instrument assembled in our laboratory (CRM-LSCE from Laboratoire des Sci-ences du Climat et de l’Environnement; see Zannoni et al., 2015). In brief, the comparative reactivity method is based on the concept of producing a competition for in situ-generated OH radicals, between a reactive reference compound, in our case pyrrole (C4H5N), and ambient
re-active gases (Sinha et al., 2008). This is achieved by in-troducing a known amount of pyrrole diluted in zero air and N2 in a flow reactor coupled to a proton transfer
re-action mass spectrometer (PTR-MS; see Lindinger and Jor-dan, 1998; De Gouw and Warneke, 2007). Pyrrole is cho-sen as a reference compound for its well-characterized kinet-ics (Atkinson et al., 1984; Dillon et al., 2012), for not being present in the atmosphere at normal conditions, and for be-ing easily detectable at the protonated m/z 68 (C4H5NH+)
through PTR-MS without any interference. The PTR-MS run at standard conditions (Pdrift=2.2 mbar, E/N = 130 Td
(1 Td = 10−17V cm−1), Tinlet=60◦C) is the detector of
choice for its real-time measurement capabilities and robust-ness over time (see also Nölscher et al., 2012b).
The usual CRM experimental procedure includes the fol-lowing stages: monitoring of C0wet/dry, followed by C1dry
or wet, C2wet, and C3ambient, with C0, C1, C2, and C3
be-ing the concentration of pyrrole detected with the PTR-MS, in order: after injection (C0), after photolysis of pyrrole (C1),
after reaction with OH (C2), and when ambient air is injected
and the competition for OH radicals starts (C3). Switches
be-tween C2(background pyrrole in zero air) and C3 (pyrrole
in ambient air) result in modulations of the pyrrole signal,
which are used to derive total OH reactivity values from the following equation:
Rair=
(C3−C2)
(C1−C3)
·kpyrrole+OH·C1, (1)
with kpyrrole+OH being the rate constant of
reac-tion between pyrrole and OH = (1.20 ± 0.16) × 10−10 cm3molecule−1s−1 (Atkinson et al., 1984; Dillon et al., 2012).
During the whole campaign, we ran systematic quality check controls on the instrument (see Supplement).
Sampling was performed through a 3 m long, 1/8 in. OD perfluoroalkoxy alkane (PFA) sampling line at a flow rate of 0.25 sL min−1with a residence time of the sample of 3 s. The sampling line was covered and kept at ambient temperature and installed at about 1.5 m above the trailer were the CRM was installed. A polytetrafluoroethylene (PFTE) filter was placed at the inlet of the sampling line to avoid sampling par-ticles. Some highly reactive chemical species (i.e., sesquiter-penes) may have been lost before reaching the reactor due to wall losses in the sampling line and/or filter surface.
We recorded PTR-MS data using a dwell time of 20 s for pyrrole, with a full cycle of measurements every 30 s. We switched between C2and C3every 5 min, resulting in a data
point of reactivity every 10 min. Each data point of reac-tivity obtained from Eq. (1) was corrected for: (i) humidity changes between C2and C3, (ii) deviation from the
assump-tion of pseudo-first-order kinetics between pyrrole and OH, and (iii) dilution of ambient air reactivity inside the reactor. A detailed description on how the correction factors were ob-tained and how the raw data were processed can be found in the publication of Zannoni et al. (2015). We did not ac-count for OH recycling in our reactor due to nitrogen oxides (NO + NO2) since ambient nitrogen monoxide (NO) was
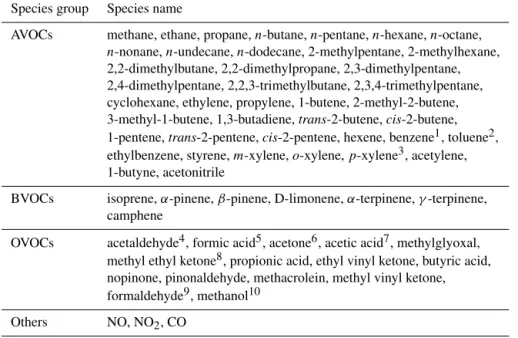
Table 1. Measured compounds (whose concentration was above the instrumental detection limits) and their adopted classification in the paper for calculating the OH reactivity. Anthropogenic VOCs, BVOCs and OVOCs stand respectively for anthropogenic, biogenic and oxygenated volatile organic compounds.
Species group Species name
AVOCs methane, ethane, propane, n-butane, n-pentane, n-hexane, n-octane, n-nonane, n-undecane, n-dodecane, 2-methylpentane, 2-methylhexane, 2,2-dimethylbutane, 2,2-dimethylpropane, 2,3-dimethylpentane, 2,4-dimethylpentane, 2,2,3-trimethylbutane, 2,3,4-trimethylpentane, cyclohexane, ethylene, propylene, 1-butene, 2-methyl-2-butene, 3-methyl-1-butene, 1,3-butadiene, trans-2-butene, cis-2-butene, 1-pentene, trans-2-pentene, cis-2-pentene, hexene, benzene1, toluene2, ethylbenzene, styrene, m-xylene, o-xylene, p-xylene3, acetylene, 1-butyne, acetonitrile
BVOCs isoprene, α-pinene, β-pinene, D-limonene, α-terpinene, γ -terpinene, camphene
OVOCs acetaldehyde4, formic acid5, acetone6, acetic acid7, methylglyoxal, methyl ethyl ketone8, propionic acid, ethyl vinyl ketone, butyric acid, nopinone, pinonaldehyde, methacrolein, methyl vinyl ketone, formaldehyde9, methanol10
Others NO, NO2, CO
Compounds with anthropogenic and biogenic origin.1,2,3Misztal et al. (2015);4Millet et al. (2010);5,7Paulot et al. (2011);6Jacob et al. (2002);8Yáñez-Serrano et al. (2016) and Cappelin et al. (2017);9Fortems-Cheiney et al. (2012);10Jacob et al. (2005).
low for interfering with the system. Tests performed in the laboratory after the campaign have demonstrated that the in-strument is not subject to ozone interference. The impact on CRM measurements of OH recycling reactions observed dur-ing the oxidation of some ambient species (e.g., methyl vinyl ketone and methacrolein – MVK + MACR; isoprene hydrox-yhydroperoxides – ISOPOOHs; aldehydes) was determined to be negligible due to the low concentrations of these species and the high HO2concentration in the CRM reactor, which
disfavor unimolecular reactions.
The limit of detection (LoD) of CRM-LSCE was esti-mated to be ∼ 3 s−1 (3σ ) and the systematic uncertainty ∼35 % (1σ ), including uncertainties on the rate coefficient between pyrrole and OH (8 %), detector sensitivity changes and pyrrole standard concentration (22 %), correction fac-tor for kinetics regime (26 %) and flows fluctuations (2 %); see also Michoud et al. (2015). An intercomparison exercise with another CRM instrument carried out before the cam-paign demonstrated that the measured reactivities were in good agreement (linear least squares fit with a slope of 1 and R2value of 0.75). An intercomparison study carried out with other instruments based on the CRM technique and on the laser-induced fluorescence-based technique showed that the measured OH reactivities agree with each other (Fuchs et al., 2017). The same study showed the following limitations of CRM instruments compared to laser-based techniques: (i) higher limit of detection (2 s−1vs. < 1 s−1), lower time reso-lution (10–15 min vs. 30 s to a few minutes), lower accuracy
due to the required corrections to determine the final OH re-activity value (pseudo-first-order deviation and OH recycling for environments exposed to high NOxconcentrations).
Ad-ditionally, CRM instruments underestimated the measured OH reactivity of known terpenes mixture; therefore, if any missing reactivity is reported from terpenes-dominated envi-ronment this has to be seen as a lower limit of missing reac-tivity present.
3.2 Complementary measurements at the field site
Trace gases were measured using a broad set of techniques available at the site, including proton transfer reaction-mass spectrometry (PTR time-of-flight MS, Kore Technology Ltd., UK), online and offline gas chromatography (GC-FID/FID and GC-FID/MS, Perkin Elmer), liquid chromatography (HPLC-UV, high-performance liquid chromatography–UV light detector), the Hantzsch reaction method (Aero-Laser GmbH, Germany) and wavelength-scanned cavity ring-down spectrometer (WS-CRDS, G2401, Picarro, USA). The mea-sured concentration and the reaction rate coefficients of each measured compound with OH were used to calculate the OH reactivity with Eq. (2):
R =X
i
ki+OH·Xi, (2)
with i being any measured compound listed in Table 1 and Xits concentration.
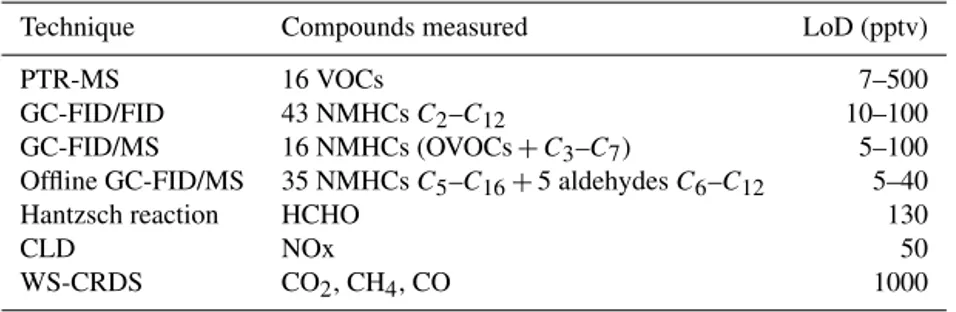
Table 2. Summary of the experimental methods deployed during the field campaign and needed for calculating the OH reactivity. The number of measured compounds includes the compounds below the instrumental detection limit (LoD).
Technique Compounds measured LoD (pptv)
PTR-MS 16 VOCs 7–500
GC-FID/FID 43 NMHCs C2–C12 10–100
GC-FID/MS 16 NMHCs (OVOCs + C3–C7) 5–100
Offline GC-FID/MS 35 NMHCs C5–C16+5 aldehydes C6–C12 5–40
Hantzsch reaction HCHO 130
CLD NOx 50
WS-CRDS CO2, CH4, CO 1000
Most of the chemical species whose reactivity was summed to determine the calculated reactivity were mea-sured through PTR-MS and GC.
The sampling system for the PTR-MS consisted of a 5 m PFA sampling line, installed above the PTR-MS trailer (see Fig. 1). The residence time in the sampling line was 4 s. We operated the PTR-MS at 1.33 mbar pressure and 40◦C tem-perature in the drift tube for an E/N of 135 Td. The PTR-MS was calibrated every 3 days using certified mixtures of different VOCs: 15 VOCs (Restek, France), 9 VOCs (Prax-air, USA), and 9 oxygenated VOCs (Prax(Prax-air, USA). More details on the calibration standards are available in Michoud et al. (2017). For this campaign, we only reported the masses that we clearly identified and for which we had a calibra-tion standard. Some other masses, possibly corresponding to oxidation products of terpenes, were also extracted from the mass spectra and tentatively quantified (e.g., m/z 99, 111, 113, 155). A visual inspection of the full mass spectra did not reveal any other abundant species that we did not con-sider. The GCs were calibrated twice at the beginning and at the end of the field campaign with certified gas mixtures: one including 29 VOCs (Praxair, USA) and another including 29 non-methane hydrocarbons (NMHCs) and three terpenes (NPL, UK). Total uncertainties from measurements (includ-ing precision and calibration procedure) were in the range 5–23 % for compounds measured by PTR-MS and GC-FID, and in the range 5–14 % for GC-MS.
Isoprene was measured by both PTR-MS and GC and the results correlated within the measurement uncertainty (slope and R2of the regression for 415 data points are 0.93 ± 0.03 and 0.77, respectively; see Supplement). A small offset in the scatter plot (approximately 100 pptv) may indicate a small interference at m/z 69 for the PTR-MS measurements; there-fore, we used data from GC to calculate the OH reactiv-ity. We sampled individual monoterpenes with GC-FID, and on adsorbent tubes for the analysis with GC-MS, while we measured the total monoterpenes fraction by PTR-MS since the instrument cannot distinguish between structural isomers. Concentrations obtained from GC techniques were used to calculate the summed OH reactivity. As recently reported by Rivera-Rios et al. (2014), the m/z 71 measured by PTR-MS
might also include the ISOPOOHs which could have formed at the site and fragmented inside the PTR-MS. However, it is important for the reader to know that we did not separate the different components of the m/z 71; therefore the presence of ISOPOOHs on m/z 71 is assumed based on the recent litera-ture.
We refer the reader to the paper of Michoud et al. (2017) for a detailed description of the PTR-MS and online GC and offline sampling on adsorbent cartridges on GC-FID/MS de-ployed at the site. The formaldehyde, NOx, and O3analyzers
and WS-CRDS are briefly introduced in the following sec-tions. Table 2 provides a summary of all techniques.
3.2.1 Hantzsch method for measuring formaldehyde
Formaldehyde (HCHO) was measured with a commercial instrument based on the Hantzsch reaction (model 4001, Aero-Laser GmbH, Germany). Gaseous HCHO is stripped into a slightly acidic solution, followed by reaction with the Hantzsch reagent, i.e., a diluted mixture of acetyl acetone acetic acid and ammonium acetate. This reaction produces a fluorescent compound, which absorbs photons at 510 nm. More details are given in Dasgupta et al. (1988), Junker-mann (2009) and Preunkert et al. (2013).
Sampling was conducted through a 5 m long PTFE 1/4 in. OD line, with a 47 mm PFA in-line filter installed at the inlet and a flow rate of 1 L min−1.
The liquid reagents (stripping solution and Hantzsch reagent) were prepared from analytical-grade chemicals and ultrapure water according to the composition given by Nash (1953), and stored at 4◦C on the field. The instrumen-tal background was measured twice a day (using an external hopcalite catalyst consisting of manganese and copper ox-ides) and calibrated three to four times a week using a liquid standard at 1.10−6mol L−1, i.e., volume mixing ratio in the gaseous phase of about 16 ppbv. The calibration points were interpolated linearly in order to correct for sensitivity fluctu-ations of the instrument. The limit of detection was 130 pptv (2σ ). The coefficient of variation, i.e., the ratio of the stan-dard deviation to the mean background value, was estimated to be 0.4 %. Measurements of HCHO ran smoothly from the beginning of the campaign until 11:00 LT (local time) of
20 18 16 14 12 10 8 6 4 2 0 OH reactivity (s -1) 07/19/2013 07/26/2013 08/02/2013 35 30 25 20 15 10 5 0 Temperature (°C)
WEST (SEA) EAST (ITALY) WEST SOUTH WEST EAST (ITALY), NORTH (FRANCE) WEST Air masses' origin
Temperature OH reactivity_measured Summed OH reactivity BVOCs AVOCs Others OVOCs
Figure 2. Three-hour averaged data of total OH reactivity measured and calculated from the measured gases. Summed OH reactivity is represented with the blue thick line and grouped as biogenic VOCs in green, anthropogenic VOCs in blue, oxygenated VOCs in orange and others in red. Others refer to carbon monoxide (CO) and nitrogen oxides (NOx).
28 July 2013. At this time, an instrument failure occurred and measurements were interrupted.
3.2.2 Chemiluminescence for measuring NOx
A CRANOX instrument (Ecophysics, Switzerland) based on ozone chemiluminescence was used to measure nitro-gen oxides (NOx=NO + NO2). Nitric oxide is quantified
directly by the instrument, while NO2 is quantified
indi-rectly after being photolytically converted to NO (conver-sion efficiency = 86 %). The instrument consists of high-performance two-channel CLDs (chemiluminescence detec-tors) with pre-chamber background compensation, an inte-grated pump, a photolytic converter, an ozone generator and a calibrator. Control software handles and manages the dif-ferent tasks. The detection limit is 50 pptv (3σ ), and the time resolution is 5 min.
3.2.3 Wavelength-scanned cavity ring-down spectrometry (WS-CRDS) for measuring greenhouse gases
In situ measurements of CO2, CH4, and CO molar fractions
at Ersa are part of the French monitoring network of green-house gases, integrated in the European Research Infrastruc-ture ICOS (Integrated Carbon Observation System). The air is sampled at the top of a 40 m high telecommunication tower (573 m) and is analyzed with a wavelength-scanned cavity ring-down spectrometer (WS-CRDS, G2401, Picarro, USA). The analyzer is calibrated every 3 weeks with a suite of four reference standard gases, whose molar fractions are linked to the WMO (World Meteorological Organization) scales through the LSCE (Laboratoire des Sciences du Climat et de l’Environnement) reference scale. Measurements were cor-rected for an empirical correction that takes into account the dilution effect and pressure broadening effect. A humidify-ing bench was developed to humidify a certified
concentra-tion of a gas stream at different humidity levels (see Rella et al., 2013).
3.3 Air masses back-trajectories
The back-trajectories of the air masses were modeled with Hysplit (HYbrid Single-Particle Lagrangian Integrated Tra-jectory), developed by the National Oceanic and Atmosphere Administration (NOAA) Air Resources Laboratory (ARL) (Draxler and Hess, 1998; Stein et al., 2015), for 48 h every 6 h.
The back-trajectories were grouped according to their origin, altitude and wind speed, such as (1) northeast, (2) west, (3) south, (4) northwest and (5) calm, low-wind-speed/stagnant conditions. More details on the air masses ori-gin and their photochemical age are available in Michoud et al. (2017).
4 Results
4.1 Total measured OH reactivity
The black line in Fig. 2 represents the 3 h averaged mea-sured OH reactivity. Here we report all data acquired during 16 July–5 August 2013, missing data points are due to mi-nor instrumental issues and instrumental controls. Figure 2 also shows the temperature profile of ambient air (gray line, right axis). The OH reactivity varied between the instrumen-tal LoD (3 s−1) and 17 ± 6 s−1(3 h averaged maximum value ±35 % uncertainty). From the 10 min time resolution data the highest value of OH reactivity was 22 s−1, reached on 28 July 2013 during the afternoon, when the air tempera-ture at the site was also exhibiting its maximum. During the whole field campaign, the average measured OH reactivity was 5 ± 4 s−1(1σ ). This value agrees with averaged values of OH reactivity collected during autumn 2011 in the south of Spain for southerly marine-enriched air masses (Sinha et
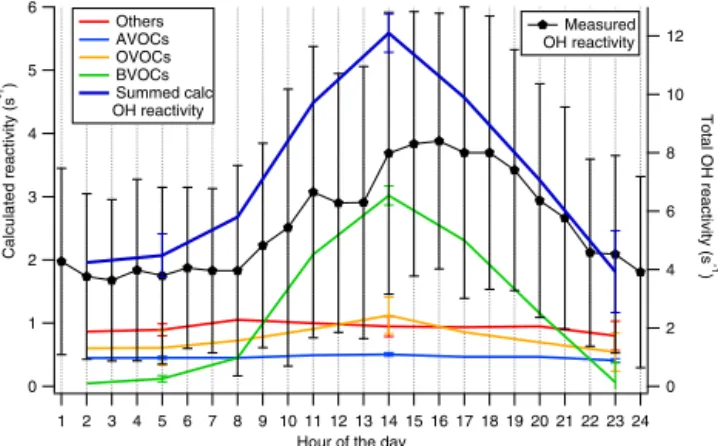
6 5 4 3 2 1 0 Calculated reactivity (s -1) 24 23 22 21 20 19 18 17 16 15 14 13 12 11 10 9 8 7 6 5 4 3 2 1
Hour of the day
12 10 8 6 4 2 0 Total OH reactivity (s -1 ) Others AVOCs OVOCs BVOCs Summed calc OH reactivity Measured OH reactivity
Figure 3. Diurnal patterns of measured (value with ±1σ , right axis) and calculated OH reactivity (left axis). Others, AVOCs, OVOCs, and BVOCs are the contribution of CO and NOx (others),
anthro-pogenic volatiles, oxygenated volatiles and biogenic volatiles to the summed calculated OH reactivity.
al., 2012). In contrast, higher OH reactivity was measured during spring 2014 in a Mediterranean forest of downy oaks, where the average campaign value was 26 ± 19 s−1and the maximum value was 69 s−1(Zannoni et al., 2016).
The OH reactivity and air temperature at the site in Cor-sica co-varied during the whole campaign, with highest val-ues reached during daytime in the periods between 26 and 28 July and between 2 and 3 August. In Fig. 2 the origin of the air masses reaching the field site is also reported. The dominant origin of the sampled air masses was west, indi-cating air masses that had traveled over the sea being pos-sibly more aged. It is not evident that the variability of the OH reactivity is affected by the origin of the air masses; in contrast, air temperature seems to have played a major role. The diurnal pattern of OH reactivity for the whole campaign is reported in Fig. 3. Here it is evident that the background value was about 4 s−1during nighttime and that it increased at 08:00 LT, peaked at 11:00 LT, reached a second maximum at 16:00 LT and finally decreased at 19:00 LT, reaching its background value at 22:00 LT (local time GMT/UTC+2 h). It is worth noting that the large amplitude of standard devia-tion bars (1σ ) highlights the large diel variability.
4.2 Calculated OH reactivity and BVOC influence
Table 1 provides the number and type of chemical species measured simultaneously with the OH reactivity. We deter-mined the calculated OH reactivity from the concentrations and reaction rate coefficients with OH of the species reported in Table 1 using Eq. (2). Please refer to Table 2 in the Sup-plement for the reaction rate coefficients of the selected com-pounds with OH. A broad set of comcom-pounds were monitored at the site, herein classified as anthropogenic volatile organic compounds (AVOCs, 41 compounds measured), biogenic volatile organic compounds (BVOCs, 7), oxygenated volatile
Table 3. Relative contributions of individually detected biogenic volatile organic compounds (BVOCs) to the total calculated OH re-activity BVOC fraction. Daytime BVOC OH rere-activity accounted for a maximum value of 9 s−1, with an average of 2 ± 2 s−1. Night-time BVOC OH reactivity fraction accounted for a maximum value of 0.5 s−1, with an average of 0.1 s−1.
BVOCs Day (%) Night (%) α-Pinene 7.7 20.7 β-Pinene 16.5 16.1 Limonene 12 11.4 Camphene 1.5 3.1 α-Terpinene 31.1 31.3 γ-Terpinene 1.3 5 Isoprene 30 12.5
organic compounds (OVOCs, 15) and others (3 species: CO, NO and NO2). Please note that we adopted this classification
to simplify the discussion throughout the paper; for more de-tails concerning the different sources of these compounds the reader can refer to the notes of Table 1. Figure 2 shows the time series of the summed calculated OH reactivity (thick blue line) and the contributions of each class of chemicals. The maximum of the summed calculated OH reactivity was 11 s−1, and the 24 h averaged value was 3 ± 2 s−1 (1σ ). As shown in Fig. 3, the class of the biogenic compounds played an important role in the daytime OH reactivity. Here, the shape of the diurnal pattern of the measured reactivity is slightly shifted to the BVOCs’ OH reactivity, which sug-gests a possible influence from the oxidation products of bio-genic molecules. The mean percentage contribution of each class of compounds to the summed calculated reactivity is determined for daytime (from 07:30 to 19:30 LT) and night-time data (from 19:30 to 04:30 LT) in Fig. 4. During day-time BVOCs contributed the largest fraction of OH reactivity (45 %), followed by inorganic species (24 %), OVOCs (19 %) and AVOCs (12 %). Only 7 BVOCs had a higher impact than 41 AVOCs. This is explained by (i) the relatively high con-centration of BVOCs (maximum values for isoprene and sum of monoterpenes is 1 and 1.5 ppbv, respectively), (ii) the gen-erally large BVOC reaction rate coefficients with OH (Atkin-son and Arey, 2003) and (iii) the relatively low concentra-tion of AVOCs measured during the campaign. BVOCs ac-counted only for 5 % of the total VOCs concentration, fol-lowed by AVOCs (15 %) and OVOCs (79 %) (mean cam-paign values; see also Michoud et al., 2017), which high-lights the reactive nature of the measured BVOCs. Dur-ing nighttime, BVOC concentrations decreased (see Figs. 2 and 3); CO and NOxhad the largest influence on OH
reactiv-ity (43 %), followed by OVOCs (27 %), AVOCs (23 %) and BVOCs (7 %). Particularly, CO and long-lived OVOCs and AVOCs constituted a background reactivity of ∼ 2–3 s−1, as also shown by the diurnal profiles reported in Fig. 3.
12 % 45 % 19 % 24 % BVOCs AVOCs Others OVOCs (a) 23 % 7 % 27 % 43 % BVOCs AVOCs Others OVOCs (b)
Figure 4. Daytime (a) and nighttime (b) contributions of the mea-sured compounds to the calculated OH reactivity. Daytime data were collected between 07:30 and 19:30 LT, while nighttime data were between 19:30 and 07:30 LT. Summed OH reactivity during daytime was maximum 11 s−1, on average 4 ± 2 s−1, while dur-ing nighttime it was maximum 3 s−1, on average 2 ± 0.4 s−1. Bio-genic VOCs (green), AVOCs (blue), OVOCs (orange) and others (red) stand for biogenic, anthropogenic, oxygenated volatile or-ganic compounds, and carbon monoxide and nitrogen oxides, re-spectively. During daytime, BVOCs, AVOCs, OVOCs and others contributions were 45, 12, 19, 24 %, respectively, while they were 7, 23, 27, 43 %, respectively during nighttime.
Within the BVOC class, the total fraction of monoter-penes contributed more than isoprene to the OH reactivity (Fig. 5). During daytime, OH reactivity due to monoterpenes was between 1.4 and 7.4 s−1 and varied with air tempera-ture, while isoprene reactivity with OH varied between 0.3 and 2.3 s−1(minimum and maximum values on 29 July and 3 August 2013, respectively). In contrast with monoterpenes OH reactivity, the reactivity of isoprene towards OH varied with both air temperature and solar irradiance. Overall, both monoterpenes and isoprene OH reactivities had the charac-teristic diurnal profile observed for their atmospheric concen-trations. High concentrations depended on air temperature, solar radiation and calm, low-wind-speed conditions. These results indicate a large impact of BVOC oxidation on the lo-cal photochemistry.
The very reactive monoterpene α-terpinene had the largest contribution on OH reactivity among the measured BVOCs (31 %), followed by isoprene (30 %), β-pinene (17 %), limonene (12 %), αpinene (8 %), camphene (2 %) and γ -terpinene (1 %), over a total averaged daytime reactivity due to BVOCs of 2 ± 2 s−1(1σ ) (see Table 3). During the night, monoterpenes had a larger impact than isoprene due to their known temperature dependency (Kesselmeier and Staudt, 1999). α-Terpinene was the most reactive-to-OH BVOC also during nighttime; see Table 3. In terms of absolute values, α-terpinene had a maximum reactivity of 5.3 s−1 on 2 Au-gust at 14:00 LT, which is also when the maximum OH re-activity reported for the whole class of BVOCs occurred. The mean concentration of this compound made it the fourth most abundant BVOC measured, with isoprene being the first (35 %), followed by β-pinene (22 %), pinene (15 %), α-terpinene (13 %), limonene (9 %) and γ -α-terpinene (1 %). The α-terpinene volume mixing ratio was maximum 594 pptv,
Figure 5. Absolute OH reactivity calculated for the measured bio-genic compounds. Individual compounds’ reactivities were calcu-lated from GC measurements; “all monoterpenes” refers to the summed reactivities of the individual terpenes.
with an average value between 10:00 and 17:00 LT during the field campaign of 131 ± 110 pptv. Its short lifetime is due to the high reaction rate coefficient towards OH (as re-ported in the literature, i.e., 3.6 × 10⁻¹⁰cm3molecule−1s−1; see Atkinson, 1986, and Lee et al., 2006), which is more than 3-fold higher than the one of iso-prene (kisoprene+OH=1 × 10⁻¹⁰cm3molecule−1s−1;
Atkin-son, 1986). Very little is reported in the literature regarding its emission rates and ambient levels in the Mediterranean region. Owen et al. (2001) measured α-terpinene from a few Mediterranean tree species, including Juniperus phoenicea, Juniperus oxycedrus, Spartium junceum L., and Quercus ilex. Ormeno et al. (2007) published the α-terpinene content as 34.9 ± 2.3 µg gDM−1in the leaves of Rosmarinus officinalis; shrubs of rosemary were present in large quantities around our field site in Corsica.
4.3 Missing reactivity and air mass fingerprint
Figure 2 reports the time series of the total measured OH reactivity and calculated OH reactivity with their associated errors (35 and 20 %, respectively). The largest significant dis-crepancy between reactivities occurred during 23–30 July (56 % of missing reactivity, calculated as the difference in percentage between measured and calculated reactivity). We combined air mass back-trajectories and atmospheric mix-ing ratios of some common atmospheric tracers to determine the chemical fingerprint of the sampled air and to investigate the origin of the missing reactivity. We chose isoprene and pinenes for air masses influenced by biogenic activity, while propane and CO were used for those enriched in anthro-pogenic pollutants (see Supplement). Maximum concentra-tions of anthropogenic pollutants were measured when the air masses originated from the northeast sector: between 21 and 23 July and between 31 July and 3 August, indicating weak pollution events coming from the industrialized areas of the Po Valley and Milan (Italy). The OH reactivity during these events was at most 9 s−1; no significant missing reactivity
0.20 0.15 0.10 0.05 0.00 VMR (ppbv) 07/16/2013 07/21/2013 07/26/2013 07/31/2013 08/05/2013 30 20 10 Temp (°C) w in d s p e e d ( m s ) 600 400 200 0 Solar irradiance (W) 1.6 1.2 0.8 0.4 0.0 10 8 6 4 OH reactivity (s -1 ) m/z111 m/z113 m/z139 m/z151 Missing OH reactivity T WS m/z69 m/z137 m/z71 SI -1
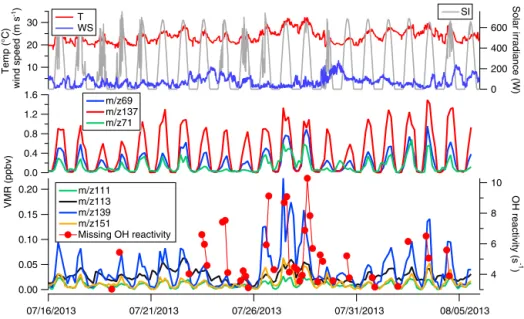
Figure 6. Volume mixing ratios (ppbv) of primary emitted and secondary produced biogenic volatile organic compounds (BVOCs) mea-sured by PTR-MS. Primary emitted BVOCs include isoprene (m/z 69) and monoterpenes (m/z 137) (middle panel); oxidation products in-clude methyl vinyl ketone, methacrolein, possibly isoprene hydroperoxides MVK + MACR + ISOPOOH (m/z 71) (middle panel), nopinone (m/z 139), and pinonaldehyde (m/z 151, 111 and 113) (lowest panel). Top panel provides data of temperature, wind speed and solar irradiance. The lowest panel shows the variability of the missing OH reactivity, calculated as the difference between measured and calculated reactivity.
occurred, mainly because of the weakness of the events, and the deployment of instruments that were able to characterize a large number of AVOCs. On the other hand, biogenic activ-ity was independent of the wind sector and showed a larger variability linked to local drivers, such as air temperature, so-lar irradiance and wind speed (Fig. 6). Biogenic VOCs and their oxidation products had a large influence on the mea-sured OH reactivity and potentially on the missing reactivity (Figs. 2–5); however, periods characterized by a large contri-bution of BVOCs to the measured OH reactivity (27–29 July and 2–4 August) present some differences in missing reac-tivity, which will be discussed in the next section. There is not a clear trend between the measured and missing OH re-activities with the origin of air masses (Fig. 2). Nevertheless, when VOCs were imported from the western sector, the air masses traveled over the sea with an average transport time of up to 48 h, which could have favored the enrichment in oxygenated compounds through the atmospheric oxidation of primary VOCs initially present in these air masses before they left continents (Michoud et al., 2017).
4.4 Insights into the missing OH reactivity
The missing OH reactivity, obtained as the absolute differ-ence between measured and calculated reactivity values, is reported in Fig. 6. Only values higher than the detection limit of 3 s−1are displayed in this figure. Significant miss-ing reactivity (2.8 ± 2.2 s−1on average over the whole cam-paign) can be observed from 23 to 29 July and more spo-radically before 23 July (3 data points from a total of 41) and after 29 July (10 data points). To determine the causes
of the reported missing OH reactivity we first investigated whether the VOC instruments deployed on the measure-ment site did not selectively detect some of the emitted BVOCs. We compared the total monoterpene concentration observed by PTR-MS to the summed monoterpenes con-centration from GCs and calculated a concon-centration differ-ence ranging from 0.2 to 0.6 ppbv (see Supplement), the PTR-MS measurements being higher than the sum of speci-ated monoterpenes. Assuming a reaction rate coefficient with OH of 1.56 × 10⁻¹⁰cm3molecule−1s−1(weighted value es-timated from monoterpenes emitted by the plants present at the site; see Bracho-Nunez et al., 2011) we can roughly es-timate a value of 0.8–2.3 s−1of missing OH reactivity due to these unspeciated monoterpenes, which represents 30 % of the reported missing reactivity on average. Therefore, un-measured monoterpenes account for a significant fraction of the missing OH reactivity but do not fully explain the total missing reactivity.
The missing OH reactivity temperature dependency was used in previous studies (Di Carlo et al., 2004; Mao et al., 2012; Hansen et al., 2014) to determine whether terpenes (Di Carlo et al., 2004) or their oxidation products (Mao et al., 2012) could explain the missing OH reactivity. Terpene emissions depend on temperature following the expression, E(T ) = E(T s)exp[β(T − T s)], where E(T s) is the emis-sion rate at temperature T s, β a temperature sensitivity fac-tor, and T the ambient temperature. Di Carlo et al. (2004) found that the missing OH reactivity reported from a ate forest in northern Michigan followed the same temper-ature dependency as terpene emissions, with β = 0.11 K−1.
Similarly, Mao et al. (2012) reported a β factor of 0.168 K−1 from a temperate forest in California. Since this value is higher than the upper limit of 0.144 usually observed for ter-pene emissions, the authors attributed the missing OH reac-tivity to unmeasured oxidation products of BVOCs, which was supported by box model simulations.
In the present study, we investigated the temperature de-pendency of the missing OH reactivity to determine whether BVOC oxidation products caused the missing reactivity for 23–26 and 27–29 July periods. We found a clear depen-dence (β = 0.158 K−1 and R2=0.643) between the miss-ing OH reactivity and temperature for some days of the campaign (27–29), while no correlation (β = 0.007 K−1and R2=0.001) was found during 23–26 July (see Fig. 7). The lack of a clear temperature dependency and the influence of long-range transport on air masses imported from the west-ern sector, as demonstrated by Michoud et al. (2017), for the same data set suggest that the local oxidation of BVOCs was not the main cause of the missing reactivity observed during 23–26 July. In contrast, the similar temperature dependen-cies observed in the study of Mao et al. (2012) and during 27–29 July suggest that oxidation products of locally emit-ted BVOCs was the main cause of missing reactivity for this period. This interpretation is further confirmed by a signifi-cant increase in the concentrations of some BVOC oxidation products during 27–29 July (Fig. 6) and the accumulation of these secondary species vs. the primary biogenic compounds during nighttime (Fig. S4 in the Supplement).
Figure 6 shows the missing OH reactivity and volume mixing ratios of BVOCs and their oxidation products to-gether with meteorological parameters, such as tempera-ture, wind speed and solar irradiance. Compounds are re-ported using their protonated mass measured by PTR-MS, such as m/z 69 (isoprene) and m/z 137 (monoterpenes) for primary emissions, m/z 71 – isoprene first-generation oxida-tion products: methyl vinyl ketone (MVK) + methacrolein (MACR) + possibly fragments of isoprene hydroxyperox-ides (ISOPOOHs) – m/z 139 (nopinone, β-pinene first gen-eration oxidation product) and m/z 151 (fragment of pinon-aldehyde, α-pinene first-generation oxidation product) for the BVOC oxidation products. It is worth noting that m/z 111 and 113 are also reported since these masses have been at-tributed to oxidation products of several terpenes. The frag-ments at m/z 111, 113 and 151 were observed in chamber and field studies (Lee et al., 2006; Holzinger et al., 2005) as they are formed from the photo-oxidation of different ter-penes; highest yields were attributed to terpenes also com-mon to the Mediterranean ecosystem, such as myrcene, ter-pinolene, linalool, methyl chavicol and 3-carene (Lee et al., 2006, Bracho-Nunez et al., 2011). We note that all the above-mentioned masses (with the exception of m/z 111 and 113, for which no rate coefficient was found for the reaction of the unprotonated molecule with OH) have been taken into account in the calculated OH reactivity. The reported time se-ries show that both primary BVOCs and most of the OVOCs
y = 3E-20e0.158x R² = 0.6433 y = 42.919e-0.007x R² = 0.0007 0 2 4 6 8 10 12 292 293 294 295 296 297 298 299 300 M is si ng O H r ea ct iv ity ( s -1) Temperature (K)
Figure 7. The temperature dependency of the difference between measured and calculated reactivity (missing OH reactivity) during 23–26 July (red data points) and 27–29 July (black data points). The missing reactivity is fitted to E(T ) = E(293)exp(β(T − 293)). The exponential curve fits the black markers, while the close-to-straight line fits the red markers.
resulting from their oxidation had a clear diurnal profile with highest values during midday, similar to that observed for the missing reactivity.
Most of the nights were associated with low mixing ra-tios of BVOCs (29 pptv on average for isoprene) and their oxidation products (40 pptv on average for m/z 71) and cor-responded to very low or no missing reactivity. Nevertheless, we note that during some nights (26 to 27, 27 to 28, 29 to 30 July), some compounds (m/z 71, 113) were also present in low amounts and a missing reactivity of about 4 s−1was noticed. These nights were associated with low wind speed and high temperatures, indicating a stagnant episode that could have favored the accumulation of unmeasured oxida-tion products during 26–29 July (ratios of m/z 71 to m/z 69 and nopinone to β-pinene were maximum 13.9 and 7.7, re-spectively; see Supplement) as was already observed by night in an oak-forest canopy (Zannoni et al., 2016). The mix-ing ratios of the first-oxidation products of isoprene and monoterpenes (m/z 71, 139) strongly increased after 26 July, when the wind speed was lower, and increased again after 27 July, when air temperature increased. In contrast, dur-ing another period of BVOC influence, 2–5 August, slightly lower air temperature was experienced, and less accumula-tion of oxidaaccumula-tion products (Fig. S4) and lower concentraaccumula-tions of secondary species (m/z 139, 151) were reported (Fig. 6). These pieces of evidence also suggest that unmeasured, lo-cally generated BVOC oxidation products contribute signifi-cantly to the missing OH reactivity during 27–29 July.
5 Conclusions
The total OH reactivity was used in this study to evaluate the completeness of the measurements of reactive trace gases at a coastal receptor site in the western Mediterranean Basin during 3 weeks in summer 2013 (16 July–5 August 2013).
The OH reactivity had a clear diurnal profile and varied with air temperature, suggesting that biogenic compounds were significantly affecting the local atmospheric chemistry. Ancillary trace gas measurements confirmed that most of the daytime reactivity was due to biogenic VOCs, including relevant contributions from oxygenated VOCs, while during nighttime inorganic species and oxygenated VOCs exhibited the largest contribution. The OH reactivity was on average 5 ± 4 s−1 (1σ ) with a maximum value of 17 ± 6 s−1 (35 % uncertainty). The observed maximum is comparable to val-ues of OH reactivity measured at forested locations in north-ern latitudes (temperate and boreal forests as reported by Di Carlo et al., 2004; Ren et al., 2006; Sinha et al., 2010; Noelscher et al., 2013; Kumar and Sinha, 2014; Nakashima et al., 2014). This finding highlights the importance of pri-mary emitted biogenic VOCs on the OH reactivity, espe-cially where air temperature and solar radiation are high, even though our site was specifically selected for a focused study on mixed and aged continental air masses reaching the basin.
A comparison between the measured OH reactivity and the summed reactivity calculated from the measured species showed that on average 56 % of the measured OH reac-tivity was not explained by the gas measurements during 23–29 July. During this period, the air masses came from the west (23–27 July) and the south (27–29 July); a lack of pollution events, calm wind conditions and peaks of air temperature were registered at the field site (28 July). Specifically, during 27–29 July we also detected an in-crease in oxygenated VOC concentrations originating from the photo-oxidation of primary emitted BVOCs, presum-ably due to an accumulation favored by stagnant atmo-spheric conditions. Highest yields of these oxidation prod-ucts (m/z 111, 113, 151) have been attributed to terpenes, which are strongly emitted by Mediterranean ecosystems (Lee et al., 2006; Bracho-Nunez et al., 2011). We found that the missing reactivity was temperature dependent for the same period and such dependency suggests that unmeasured oxidation products of BVOCs, as similarly reported by the study of Mao et al. (2012), caused the missing reactivity.
The impact of biogenic VOCs and their oxidation prod-ucts is weaker during 23–26 July, since the site received air masses from the west and therefore from the marine sector that is less exposed to biogenic emissions. However, large values of missing OH reactivity were also observed, similar to those observed on 27–29 July. The lack of a temperature dependence of the missing reactivity for 23–26 suggests that species other than BVOC oxidation products locally formed were also contributing to the missing OH reactivity.
Mediterranean plants are known to emit large quanti-ties of reactive BVOCs, including sesquiterpenes and oxy-genated terpenes (Owen et al., 2001), which were not in-vestigated during our fieldwork. It could be possible that these molecules, as well as their oxidation products, have
also played an important role in the missing OH reactivity detected during the campaign.
Further studies with chemical and transport models to identify the important chemical functions of these oxy-genated molecules, as well as the effects of long-range trans-port, would be beneficial to provide further insights.
Finally, as the Mediterranean Basin differs from side to side (air mass reception as well as type of ecosystems), more intensive studies at different key spots, e.g., western vs. east-ern basin and remote vs. peri-urban ecosystems, would be helpful for a better understanding of the atmospheric pro-cesses linked to the reactive gases over the Mediterranean Basin.
Data availability. The data of OH reactivity and trace gases presented in this manuscript have been deposited on the Charmex database. The data are available through specific request at http://mistrals.sedoo.fr/ChArMEx/ and http://mistrals.sedoo.fr/ ?editDatsId=1420&datsId=1420&project_name=ChArMEx.
The Supplement related to this article is available online at https://doi.org/10.5194/acp-17-12645-2017-supplement.
Competing interests. The authors declare that they have no conflict of interest.
Special issue statement. This article is part of the special issue “CHemistry and AeRosols Mediterranean EXperi-ments (ChArMEx) (ACP/AMT inter-journal SI)”. It is not associated with a conference.
Acknowledgements. This study was supported by European Commission’s 7th Framework Programmes under grant agreement number 287382 “PIMMS” and 293897 “DEFIVOC”, as well as the programme ChArMEx, PRIMEQUAL CARBOSOR, CEA, CNRS and CAPA-LABEX. We would like to thank the ICOS team from LSCE for the data of CO, W. Junkermann from KIT/IMK-IFU for kindly lending the Aero-Laser instrument and Thierry Leonardis for helping with the gas measurements. A. Borbon from LISA and F. Dulac and E. Hamonou from LSCE are acknowledged for managing the CARBOSOR and ChArMEx projects. We thank the anonymous reviewers for revising the manuscript and Sabina Assan for helping with the English revision.
Edited by: William Lahoz
References
Atkinson, R.: Kinetics and mechanisms of the gas-phase re-actions of the hydroxyl radical with organic compounds under atmospheric conditions, Chem. Rev., 86, 69–201, https://doi.org/10.1021/cr00071a004, 1986.
Atkinson, R. and Arey, J.: Gas-phase tropospheric chemistry of bio-genic volatile organic compounds: a review, Atmos. Environ., 37, 197–219, https://doi.org/10.1016/S1352-2310(03)00391-1, 2003.
Atkinson, R., Aschmann, S. M., Winer, A. M., and Carter, W. P. L.: Rate constants for the gas phase reactions of OH radicals and O3 with pyrrole at 295 ± 1 K and atmospheric pressure,
Atmos. Environ., 18, 2105–2107, https://doi.org/10.1016/0004-6981(84)90196-3, 1984.
Bracho-Nunez, A., Welter, S., Staudt, M., and Kesselmeier, J.: Plant-specific volatile organic compound emission rates from young and mature leaves of Mediterranean vegetation, J. Geophys. Res.-Atmos., 116, D16304, https://doi.org/10.1029/2010JD015521, 2011.
Cappellin, L., Algarra Alarcon, A., Herdlinger-Blatt, I., Sanchez, J., Biasioli, F., Martin, S. T., Loreto, F., and McKinney, K. A.: Field observations of volatile organic compound (VOC) exchange in red oaks, Atmos. Chem. Phys., 17, 4189–4207, https://doi.org/10.5194/acp-17-4189-2017, 2017.
ChArMEx project website: http://charmex.lsce.ipsl.fr/, last access: 13 September 2017.
Cuttelod, A., García, N., Abdul Malak, D., Temple, H., and Katariya, V.: The Mediterranean: a biodiversity hotspot under threat, in: The 2008 Review of The IUCN Red List of Threat-ened Species, edited by: Vié, J.-C., Hilton-Taylor, C., and Stuart, S. N., IUCN Gland, Switzerland, 2008.
Dasgupta, P. K., Dong, S., Hwang, H., Yang, H.-C., and Genfa, Z.: Continuous liquid-phase fluorometry coupled to a diffu-sion scrubber for the real-time determination of atmospheric formaldehyde, hydrogen peroxide and sulfur dioxide, Atmos. Environ., 22, 949–963, 1988.
De Gouw, J. and Warneke, C.: Measurements of volatile organic compounds in the earth’s atmosphere using proton-transfer-reaction mass spectrometry, Mass Spectrom. Rev., 26, 223–257, https://doi.org/10.1002/mas.20119, 2007.
Di Carlo, P., Brune, W. H., Martinez, M., Harder, H., Lesher, R., Ren, X., Thornberry, T., Carroll, M. A., Young, V., Shepson, P. B., Riemer, D., Apel, E., and Campbell, C.: Missing OH Reactivity in a Forest: Evidence for Un-known Reactive Biogenic VOCs, Science, 304, 722–725, https://doi.org/10.1126/science.1094392, 2004.
Dillon, T. J., Tucceri, M. E., Dulitz, K., Horowitz, A., Vereecken, L., and Crowley, J. N.: Reaction of Hydroxyl Radicals with C4H5N (Pyrrole): Temperature and Pressure Depen-dent Rate Coefficients, J. Phys. Chem. A, 116, 6051–6058, https://doi.org/10.1021/jp211241x, 2012.
Draxler, R. R. and Hess, G. D.: An overview of the HYSPLIT_4 modeling system of trajectories, dispersion, and deposition, Aust. Meteorol. Mag., 47, 295–308, 1998.
Edwards, P. M., Evans, M. J., Furneaux, K. L., Hopkins, J., Ingham, T., Jones, C., Lee, J. D., Lewis, A. C., Moller, S. J., Stone, D., Whalley, L. K., and Heard, D. E.: OH reactivity in a South East Asian tropical rainforest during the Oxidant and Particle
Pho-tochemical Processes (OP3) project, Atmos. Chem. Phys., 13, 9497–9514, https://doi.org/10.5194/acp-13-9497-2013, 2013. Fortems-Cheiney, A., Chevallier, F., Pison, I., Bousquet, P., Saunois,
M., Szopa, S., Cressot, C., Kurosu, T. P., Chance, K., and Fried, A.: The formaldehyde budget as seen by a global-scale multi-constraint and multi-species inversion system, At-mos. Chem. Phys., 12, 6699–6721, https://doi.org/10.5194/acp-12-6699-2012, 2012.
Fuchs, H., Novelli, A., Rolletter, M., Hofzumahaus, A., Pfannerstill, E. Y., Kessel, S., Edtbauer, A., Williams, J., Michoud, V., Du-santer, S., Locoge, N., Zannoni, N., Gros, V., Truong, F., Sarda-Esteve, R., Cryer, D. R., Brumby, C. A., Whalley, L. K., Stone, D., Seakins, P. W., Heard, D. E., Schoemaecker, C., Blocquet, M., Coudert, S., Batut, S., Fittschen, C., Thames, A. B., Brune, W. H., Ernest, C., Harder, H., Muller, J. B. A., Elste, T., Kubistin, D., Andres, S., Bohn, B., Hohaus, T., Holland, F., Li, X., Rohrer, F., Kiendler-Scharr, A., Tillmann, R., Wegener, R., Yu, Z., Zou, Q., and Wahner, A.: Comparison of OH reactivity measurements in the atmospheric simulation chamber SAPHIR, Atmos. Meas. Tech. Discuss., https://doi.org/10.5194/amt-2017-231, in review, 2017.
Giorgi, F. and Lionello, P.: Climate change projections for the Mediterranean region, Global Planet. Change, 63, 90–104, https://doi.org/10.1016/j.gloplacha.2007.09.005, 2008.
Hansen, R. F., Griffith, S. M., Dusanter, S., Rickly, P. S., Stevens, P. S., Bertman, S. B., Carroll, M. A., Erickson, M. H., Flynn, J. H., Grossberg, N., Jobson, B. T., Lefer, B. L., and Wal-lace, H. W.: Measurements of total hydroxyl radical reactiv-ity during CABINEX 2009 – Part 1: field measurements, At-mos. Chem. Phys., 14, 2923–2937, https://doi.org/10.5194/acp-14-2923-2014, 2014.
Holzinger, R., Lee, A., Paw, K. T., and Goldstein, U. A. H.: Ob-servations of oxidation products above a forest imply biogenic emissions of very reactive compounds, Atmos. Chem. Phys., 5, 67–75, https://doi.org/10.5194/acp-5-67-2005, 2005.
Jacob, D. J., Field, B. D., Jin, E. M., Bey, I., Li, Q., Logan, J. A., Yantosca, R. M., and Singh, H. B.: Atmospheric budget of ace-tone, J. Geophys. Res.-Atmos., 107, ACH 5-1–ACH 5-17, 2002. Jacob, D. J., Field, B. D., Li, Q., Blake, D. R., de Gouw, J., Warneke, C., Hansel, A., Wisthaler, A., Singh, H. B., and Guenther, A.: Global budget of methanol: Constraints from atmospheric observations, J. Geophys. Res., 110, D08303, https://doi.org/10.1029/2004JD005172, 2005.
Junkermann, W.: On the distribution of formaldehyde in the west-ern Po-Valley, Italy, during FORMAT 2002/2003, Atmos. Chem. Phys., 9, 9187–9196, https://doi.org/10.5194/acp-9-9187-2009, 2009.
Kaiser, J., Skog, K. M., Baumann, K., Bertman, S. B., Brown, S. B., Brune, W. H., Crounse, J. D., de Gouw, J. A., Edger-ton, E. S., Feiner, P. A., Goldstein, A. H., Koss, A., Misz-tal, P. K., Nguyen, T. B., Olson, K. F., St. Clair, J. M., Teng, A. P., Toma, S., Wennberg, P. O., Wild, R. J., Zhang, L., and Keutsch, F. N.: Speciation of OH reactivity above the canopy of an isoprene-dominated forest, Atmos. Chem. Phys., 16, 9349– 9359, https://doi.org/10.5194/acp-16-9349-2016, 2016. Kesselmeier, J. and Staudt, M.: Biogenic Volatile
Or-ganic Compounds (VOC): An Overview on Emission, Physiology and Ecology, J. Atmos. Chem., 33, 23–88, https://doi.org/10.1023/A:1006127516791, 1999.
Kumar, V. and Sinha, V.: VOC–OHM: A new technique for rapid measurements of ambient total OH reactivity and volatile organic compounds using a single proton transfer reaction mass spec-trometer, Int. J. Mass Spectrom., 374, 55–63, 2014.
Lee, A., Goldstein, A. H., Kroll, J. H., Ng, N. L., Varut-bangkul, V., Flagan, R. C., and Seinfeld, J. H.: Gas-phase products and secondary aerosol yields from the photooxida-tion of 16 different terpenes, J. Geophys. Res., 111, D17305, https://doi.org/10.1029/2006JD007050, 2006.
Lelieveld, J.: Global Air Pollution Crossroads over the Mediterranean, Science, 298, 794–799, https://doi.org/10.1126/science.1075457, 2002.
Levy II, H.: Normal atmosphere: Large radical and formaldehyde concentrations predicted, Science, 173, 141–143, 1971. Lindinger, W. and Jordan, A.: Proton-transfer-reaction mass
spec-trometry (PTR–MS): on-line monitoring of volatile organic compounds at pptv levels, Chem. Soc. Rev., 27, 347–375, https://doi.org/10.1039/A827347Z, 1998.
Mao, J., Ren, X., Zhang, L., Van Duin, D. M., Cohen, R. C., Park, J.-H., Goldstein, A. H., Paulot, F., Beaver, M. R., Crounse, J. D., Wennberg, P. O., DiGangi, J. P., Henry, S. B., Keutsch, F. N., Park, C., Schade, G. W., Wolfe, G. M., Thornton, J. A., and Brune, W. H.: Insights into hydroxyl measurements and atmo-spheric oxidation in a California forest, Atmos. Chem. Phys., 12, 8009–8020, https://doi.org/10.5194/acp-12-8009-2012, 2012. Mellouki, A. and Ravishankara, A. R.: Regional Climate
Variabil-ity and its Impacts in the Mediterranean Area, Springer Sci-ence & Business Media, Springer Netherlands, 2007.
Michoud, V., Hansen, R. F., Locoge, N., Stevens, P. S., and Du-santer, S.: Detailed characterizations of the new Mines Douai comparative reactivity method instrument via laboratory ex-periments and modeling, Atmos. Meas. Tech., 8, 3537–3553, https://doi.org/10.5194/amt-8-3537-2015, 2015.
Michoud, V., Sciare, J., Sauvage, S., Dusanter, S., Léonardis, T., Gros, V., Kalogridis, C., Zannoni, N., Féron, A., Petit, J.-E., Crenn, V., Baisnée, D., Sarda-Estève, R., Bonnaire, N., Marc-hand, N., DeWitt, H. L., Pey, J., Colomb, A., Gheusi, F., Szi-dat, S., Stavroulas, I., Borbon, A., and Locoge, N.: Organic car-bon at a remote site of the western Mediterranean Basin: sources and chemistry during the ChArMEx SOP2 field experiment, At-mos. Chem. Phys., 17, 8837–8865, https://doi.org/10.5194/acp-17-8837-2017, 2017.
Millet, D. B., Guenther, A., Siegel, D. A., Nelson, N. B., Singh, H. B., de Gouw, J. A., Warneke, C., Williams, J., Eerdekens, G., Sinha, V., Karl, T., Flocke, F., Apel, E., Riemer, D. D., Palmer, P. I., and Barkley, M.: Global atmospheric budget of acetaldehyde: 3-D model analysis and constraints from in-situ and satellite observations, Atmos. Chem. Phys., 10, 3405–3425, https://doi.org/10.5194/acp-10-3405-2010, 2010.
Misztal, P. K., Hewitt, C. N., Wildt J., Blande, J. D., Eller, A. S. D., Fares, S., Gentner, D. R., Gilman, J. B., Graus, M., Greenberg, J., Guenther, A. B., Hansel, A., Harley, P., Huang, M., Jardine, K., Karl, T., Kaser, L., Keutsch, F. N., Kiendler-Scharr, A., Kleist, E., Lerner, B. M., Li, T., Mak, J., Nölscher, A. C., Schnitzhofer, R., Sinha, V., Thornton, B., Warneke, C., Wegener, F., Werner, C., Williams, J., Worton, D. R., Yassaa, N., and Goldstein, A. H.: Atmospheric benzenoid emissions from plants rival those from fossil fuels, Scient. Rep., 5, 12064, https://doi.org/10.1038/srep12064, 2015.
Nakashima, Y., Kato, S., Greenberg, J., Harley, P., Karl, T., Turnipseed, A., Apel, E., Guenther, A., Smith, J., and Kajii, Y.: Total OH reactivity measurements in ambient air in a south-ern Rocky mountain ponderosa pine forest during BEACHON-SRM08 summer campaign, Atmos. Environ., 85, 1–8, 2014. Nash, T.: The colorimetric estimation of formaldehyde by means of
the Hantzsch reaction, Biochem. J., 55, 416–421, 1953. Nölscher, A. C., Williams, J., Sinha, V., Custer, T., Song, W.,
John-son, A. M., Axinte, R., Bozem, H., Fischer, H., Pouvesle, N., Phillips, G., Crowley, J. N., Rantala, P., Rinne, J., Kulmala, M., Gonzales, D., Valverde-Canossa, J., Vogel, A., Hoffmann, T., Ouwersloot, H. G., Vilà-Guerau de Arellano, J., and Lelieveld, J.: Summertime total OH reactivity measurements from boreal forest during HUMPPA-COPEC 2010, Atmos. Chem. Phys., 12, 8257–8270, https://doi.org/10.5194/acp-12-8257-2012, 2012a. Nölscher, A. C., Sinha, V., Bockisch, S., Klüpfel, T., and Williams,
J.: Total OH reactivity measurements using a new fast Gas Chro-matographic Photo-Ionization Detector (GC-PID), Atmos. Meas. Tech., 5, 2981–2992, https://doi.org/10.5194/amt-5-2981-2012, 2012b.
Nölscher, A. C., Bourtsoukidis, E., Bonn, B., Kesselmeier, J., Lelieveld, J., and Williams, J.: Seasonal measurements of to-tal OH reactivity emission rates from Norway spruce in 2011, Biogeosciences, 10, 4241–4257, https://doi.org/10.5194/bg-10-4241-2013, 2013.
Nölscher, A. C., Yañez-Serrano, A. M., Wolff, S., Carioca de Araujo, A., Lavriˇc, J. V., Kesselmeier, J., and Williams J.: Unexpected seasonality in quantity and composition of Amazon rainforest air reactivity, Nat. Commun., 7, 10383, https://doi.org/10.1038/ncomms10383, 2016.
Ormeno, E., Fernandez, C., and Mevy, J. P.: Plant coexistence alters terpene emission and content of Mediterranean species, Phyto-chemistry, 68, 840–852, 2007.
Owen, S. M., Boissard, C., and Hewitt, C. N.: Volatile or-ganic compounds (VOCs) emitted from 40 Mediterranean plant species: VOC speciation and extrapolation to habitat scale, At-mos. Environ., 35, 5393–5409, https://doi.org/10.1016/S1352-2310(01)00302-8, 2001.
Paulot, F., Wunch, D., Crounse, J. D., Toon, G. C., Millet, D. B., DeCarlo, P. F., Vigouroux, C., Deutscher, N. M., González Abad, G., Notholt, J., Warneke, T., Hannigan, J. W., Warneke, C., de Gouw, J. A., Dunlea, E. J., De Mazière, M., Griffith, D. W. T., Bernath, P., Jimenez, J. L., and Wennberg, P. O.: Im-portance of secondary sources in the atmospheric budgets of formic and acetic acids, Atmos. Chem. Phys., 11, 1989–2013, https://doi.org/10.5194/acp-11-1989-2011, 2011.
Preunkert, S., Legrand, M., Pépy, G., Gallée, H., Jones, A., and Jourdain, B.: The atmospheric HCHO budget at Dumont d’Urville (East Antarctica): Contribution of photochemical gas-phase production versus snow emissions, J. Geophys. Res.-Atmos., 118, 13319–13337, 2013.
Rella, C. W., Chen, H., Andrews, A. E., Filges, A., Gerbig, C., Hatakka, J., Karion, A., Miles, N. L., Richardson, S. J., Stein-bacher, M., Sweeney, C., Wastine, B., and Zellweger, C.: High accuracy measurements of dry mole fractions of carbon diox-ide and methane in humid air, Atmos. Meas. Tech., 6, 837–860, https://doi.org/10.5194/amt-6-837-2013, 2013.
Ren, X., Brune, W. H., Oliger, A., Metcalf, A. R., Simpas, J. B., Shirley, T., Schwab, J. J., Bai, C., Roychowdhury, U., Li,
Y., Cai, C., Demerjian, K. L., He, Y., Zhou, X., Gao, H., and Hou, J.: OH, HO2, and OH reactivity during the PMTACS–
NY Whiteface Mountain 2002 campaign: Observations and model comparison, J. Geophys. Res.-Atmos., 111, D10S03, https://doi.org/10.1029/2005JD006126, 2006.
Rivera-Rios, J. C., Nguyen, T. B., Crounse, J. D., Jud, W., St. Clair, J. M., Mikoviny, T., Gilman, J. B., Lerner, B. M., Kaiser, J. B., de Gouw, J., Wisthaler, A., Hansel, A., Wennberg, P. O., Sein-feld, J. H., and Keutsch, F. N.: Conversion of hydroperoxides to carbonyls in field and laboratory instrumentation: Observational bias in diagnosing pristine versus anthropogenically controlled atmospheric chemistry, Geophys. Res. Lett., 41, GL061919, https://doi.org/10.1002/2014GL061919, 2014.
Sinha, V., Williams, J., Crowley, J. N., and Lelieveld, J.: The Com-parative Reactivity Method – a new tool to measure total OH Reactivity in ambient air, Atmos. Chem. Phys., 8, 2213–2227, https://doi.org/10.5194/acp-8-2213-2008, 2008.
Sinha, V., Williams, J., Lelieveld, J., Ruuskanen, T. M., Kajos, M. K., Patokoski, J., Hellen, H., Hakola, H., Mogensen, D., Boy, M., Rinne, J., and Kulmala, M.: OH Reactivity Mea-surements within a Boreal Forest: Evidence for Unknown Reactive Emissions, Environ. Sci. Technol., 44, 6614–6620, https://doi.org/10.1021/es101780b, 2010.
Sinha, V., Williams, J., Diesch, J. M., Drewnick, F., Martinez, M., Harder, H., Regelin, E., Kubistin, D., Bozem, H., Hosaynali-Beygi, Z., Fischer, H., Andres-Hernandez, M. D., Kartal, D., Adame, J. A., and Lelieveld, J.: Constraints on instanta-neous ozone production rates and regimes during DOMINO derived using in-situ OH reactivity measurements, Atmos. Chem. Phys., 12, 7269–7283, https://doi.org/10.5194/acp-12-7269-2012, 2012.
Stein, A. F., Draxler, R. R., Rolph, G. D., Stunder, B. J. B., Cohen, M. D., and Ngan, F.: NOAA’s HYSPLIT atmospheric transport and dispersion modeling system, B. Ame. Meteo-rol. Soc., 96, 2059–2077, https://doi.org/10.1175/BAMS-D-14-00110.1, 2015.
Yáñez-Serrano, A. M., Nölscher, A. C., Bourtsoukidis, E., Der-stroff, B., Zannoni, N., Gros, V., Lanza, M., Brito, J., Noe, S. M., House, E., Hewitt, C. N., Langford, B., Nemitz, E., Behrendt, T., Williams, J., Artaxo, P., Andreae, M. O., and Kesselmeier, J.: Atmospheric mixing ratios of methyl ethyl ketone (2-butanone) in tropical, boreal, temperate and marine environments, Atmos. Chem. Phys., 16, 10965–10984, https://doi.org/10.5194/acp-16-10965-2016, 2016.
Zannoni, N., Dusanter, S., Gros, V., Sarda Esteve, R., Michoud, V., Sinha, V., Locoge, N., and Bonsang, B.: Intercomparison of two comparative reactivity method instruments inf the Mediterranean basin during summer 2013, Atmos. Meas. Tech., 8, 3851–3865, https://doi.org/10.5194/amt-8-3851-2015, 2015.
Zannoni, N., Gros, V., Lanza, M., Sarda, R., Bonsang, B., Kalo-gridis, C., Preunkert, S., Legrand, M., Jambert, C., Boissard, C., and Lathiere, J.: OH reactivity and concentrations of bio-genic volatile organic compounds in a Mediterranean forest of downy oak trees, Atmos. Chem. Phys., 16, 1619–1636, https://doi.org/10.5194/acp-16-1619-2016, 2016.