Published by Canadian Center of Science and Education
Effect of Coke Granulometry on the Properties of Carbon Anodes
based on Experimental Study and ANN Analysis
Arunima Sarkar1, Duygu Kocaefe1, Yasar Kocaefe1, Dipankar Bhattacharyay1, Brigitte Morais1 & Patrick Coulombe2
1 Department of Applied Sciences, University of Quebec at Chicoutimi, Québec, Canada
2 Aluminerie Alouette Inc., 400, Chemin de la Pointe-Noire, C.P. 1650, Sept-Îles, Québec, Canada
Correspondence: Duygu Kocaefe, Department of Applied Sciences, University of Quebec at Chicoutimi, Québec, Canada. Tel: 418-545-5011 Ext: 5215. E-mail: Duygu_Kocaefe@uqac.ca
Received: August 26, 2016 Accepted: September 7, 2016 Online Published: September 20, 2016 doi:10.5539/jmsr.v5n4p63 URL: http://dx.doi.org/10.5539/jmsr.v5n4p63
Abstract
The available anode-quality petroleum coke is not sufficient to cover the need created by the increase in the world aluminum production. Understanding the consequences of varying calcined coke quality is necessary to possibly compensate for the reduction in coke quality and adjust the anode paste recipe in the subsequent use of coke in order to obtain economically viable production of aluminum. Different fractions of coke particles were mixed to optimize the anode recipe; however, it was laborious to find experimentally the suitable percentage of each fraction in anode paste which would give good anode properties. In this study, Artificial Neural Network (ANN) model was developed for adjusting the granulometry of the raw materials for anode production. Tapped bulk density of dry aggregates was used to predict the anode paste recipe using the ANN method. A new anode recipe (by adjusting the medium fraction in the paste) was proposed based on the predictions of an ANN model, which resulted in improved anode properties.
Keywords: carbon anodes, coke, pitch, ANN, paste recipe 1. Introduction
During the anode fabrication, calcined petroleum coke, recycled material (butts, green and baked rejects), which is also called dry aggregate, and coal tar pitch are blended in certain percentages and mixed in kneader. The composition of this mixture is known as “anode recipe” or the “anode paste recipe”. Considering the differences in raw material quality in different shipments, adjusting the anode recipe becomes a very important task for every manufacturer to ensure good anode quality. In order to facilitate selection of anode recipe, an Artificial Neural Network (ANN) model was developed to meet the specific needs of the aluminum production industry. The bulk density of dry aggregates is a good indicator of particle packing and volume occupied by dry aggregate fractions for different recipes. Particle size distribution not only affects the anode density but it also influences the mechanical strength, pore size distribution, electrical resistivity, air permeability, reactivity and even chemical composition of anodes (Farr-Wharton, 1980; Smith, 1991; Hulse, 2000; Adams, 2004; Figueiredo, 2005). In this study, tapped bulk density of dry aggregates was used to predict the anode paste recipes using ANN.
Fractions of different size particles are usually used in a recipe designed to give a dense mix where the voids between the coarse particles are filled with medium size particles and voids between these are filled by small size particles. An optimal quantity of coarse, medium and finer fractions is required for anode formulation to obtain good anode quality (Bowers, 2008). But, it is difficult to study experimentally the effect of an individual fraction sizes on a specific anode property since the change in one fraction is followed simultaneously by variations in other fractions. Also, an experimental study is laborious, time consuming, costly and involves extensive handing to find the appropriate percentage of each fraction to be used in anode paste recipe which would give good quality anode. For such cases, a trained and validated ANN model has proven to be a highly efficient tool, which can handle multiple-input conditions. ANN can give a fast response and can be upgraded continuously as more data become available. Artificial neural network is used for predicting the values of dependent parameters for which no mathematical relation is available (Parthiban, 2007) or even though some mathematical relationship is available, it is hard to find the numerical parameters (Milewski, 2009).
ANN models are widely used in various research fields including quality control (Bahlmann, 1999; Pang, 2004; Fruhwirth, 2007; Parthiban, 2007; Saengrung, 2007; Shang, 2008; Piuleac, 2010; Bhagavatula, 2012), prediction of compositions and properties of metallic and nonmetallic compounds (Wang, 2008; Asadi-Eydivand, 2014; Mohanty, 2014), aluminum reduction cell (Meghlaoui, 1998; Biedler, 2002; Boadu, 2010). However, there are only a few studies available (Berezin, 2002; Bhattacharyay, 2013; Bhattacharyay, 2015) in literature, which are directly related to carbon anodes used for the production of primary aluminum.
2. Method
2.1 Materials
Two different petroleum cokes from different suppliers and one coal tar pitch were used for laboratory scale anode production. Table 1 and Table 2 illustrate the properties of cokes and pitch.
Table 1. Physical and chemical properties of coke
Properties RDC 1 RDC 2 Bulk Density* (g/cc) 0.89 0.901 Real Density(g/cc) 2.06 2.072 CO2 Reactivity (%) 9 8 Ash Content*** (%) 0.2 0.15 Moisture Content (%) 0.1 0.19 Na (wt%) 0.007 0.0059 Si (wt%) 0.01 0.0095 P (wt%) 0.0006 - S (wt%) 2.75 0.73 Ca (wt%) 0.01 0.004 V (wt%) 0.031 0.024 Fe (wt%) 0.02 0.01 Ni (wt%) 0.02 0.019
*Measured by ASTM D4292-10,**Measured by ISO 1014:1985, ***Measured by dry basis.
Table 2. Physical and chemical properties of pitch
Properties Pitch Ash at 900°C (%m/m) 0.12 β Resin (%m/m) 22.2 Density at 20°C (g/ml) 1.320 Quinoline insoluble (%m/m) 6.9 Toluene insoluble (%m/m) 29.1 Coking Value (%m/m) 59.1 Softening Point (°C) 119.6
Dynamic Viscosity 170°C (mPa.s) 1390
Surface Tensiona (dyne/cm) at 170°C 39.33
2.2 Methodology
Anode production is a challenging task to perform and includes various complex production steps and circumstances. A set of 19 anodes were prepared at the pilot-scale anode production laboratory of the University of Quebec at Chicoutimi (UQAC). Sieved coke fractions, recycled anode butt, ball mill product (BMP) and filter dust (FD) were weighed according to ANN specified recipe and blended in an intensive mixer together with coal tar pitch. The paste temperature was maintained at 170°C during mixing. Green anodes were formed in a vibrocompactor using predetermined conditions. Then, these anodes were baked under the conditions similar to those used in industry. When the maximum baking temperature was reached, anodes were subjected to soaking for 8 h at this temperature.
2.3 Characterizations of Anodes
The anode properties were measured to ensure that they conform to general specifications, especially to produce high density, low resistivity and low reactivity anodes. The following tests and measurements were carried out:
air/CO2 reactivity using the thermogravimetric (TGA) analysis (ASTM D6559 - 00a (2010) and ASTM D6558 - 00a (2010), density and electrical resistivity of whole anode using the device/method developed at UQAC, density and electrical resistivity of cylindrical anode cores using ASTM D6120-97(resistivity) and ASTM D5502-00 (density) standards. The compressive and flexural strengths were measured by ASTM C695-91 (2005) and ISO CD 12986, respectively.
3. Results
3.1 Development of ANN Model
Two customized feed-forward artificial neural network (ANN) models with back-propagation training were developed using Matlab 2014. For networks, one input layer, two hidden layers connected in series, and one output layer were selected. Various transfer functions such as logsig, tansig, purelin are associated with the hidden layers. The logsig function can be represented as logsig(n) = 1/(1 + exp(-n)). Similarly, tansig function can be represented as tansig(n) = 2/(1+exp(-2*n))-1. Purelin is a linear function represented as purelin(n) = n. The transfer functions process the input to a layer such that the output can be easily classified into groups of similar data, which is important for an efficient prediction. The networks were trained based on the measurement of error in prediction. The errors were measured in terms of mean squared error (mse) and mean average error (mae). All the densities are normalized by using following equation.
Normalized value = Value to be Normalized - Minimum Value
Maximum Value - Minimum Value (1)
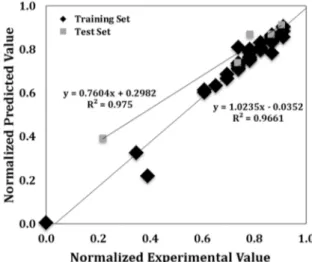
In the first model, measured tapped bulk density of each fraction and the corresponding granulometry of different dry aggregate recipes were fed to model as input to predict tapped bulk density of the specific recipe. For this model, 46 sets of aggregate bulk density data were used to train the network and five random data, which were not used in training, were used for validation. 14 laboratory anodes were produced using different recipes. These recipes were chosen using the predictions of the first ANN model which indicated the percentage of each fraction to be used in order to obtain high aggregate density. To see if the high aggregate density will result in high quality anodes, the green densities of these anodes were measured. In the second model, tapped bulk density of an anode recipe and granulometry were used as input to predict the ratio of dry aggregate to green anode density. Ten of the fourteen data were utilized to train the database and four random recipes were chosen for validation. Afterwards, two models were combined to predict the green anode density for a chosen recipe. In order to minimize the errors in training and testing calculations, the values predicted by ANN were plotted against the experimental results for numerous test data sets. The coefficient of determination for linear regression was used as the criteria for the quality of the network predictions. The closer the value of the coefficient of determination to unity is, the better the model’s ability for prediction is. It can be seen from the Figure 1 that the R2 value for training and test sets were found as 0.966 and 0.975, respectively, for dry aggregate density (first model).
Figure 2 shows the predicted vs experimental ratios of green anode density to dry aggregate density for the second model. The model had R2 value of 0.982 for training data set. The accuracy of the prediction is further indicated by the R2 (0.986) value of the test set.
Figure 2. Normalized predicted and experimental values of the ratio of green anode density to dry aggregate density using the second ANN model
The ANN model developed could be utilized to determine the granulometry required to obtain a desired tapped density of an aggregate and green anode density which is produced using this aggregate recipe. It was possible to vary the percentages of all the different size fractions which could yield a desired range of dry aggregate or green anode density. However, this might lead to a large number of combinations with different size fractions.
As it was discussed earlier, each fraction has an effect on anode properties. The model was used to demonstrate the effect of medium fractions and recycled anode butt on dry aggregate density and green anode density. To demonstrate the application of the model here, only the percentages of two particle sizes (described as coarse and medium in decreasing order in size) of fresh coke were varied keeping all other parameters constant (Figure 3). Then, the aggregate densities and anode densities corresponding to the granulometry used were predicted. This model was trained for one type of coke only. Also the pitch percentage was kept constant at 15%. The percentages of all fractions are normalized based on the Equation 1. Effect of medium particles on dry aggregate density and green anode density is illustrated in Figure 3. The results show that an optimum percentage of medium fractions were required to obtain high green anode density. High green anode density did not necessarily correspond to high dry aggregate density, rather usually low value of dry aggregate density resulted in high values of green anode density. It can be noted that when the coarse fractions were in the lower end of the range and when medium fraction percentage decreased, dry aggregate density increased. The green anode density reached an optimum at a certain medium fraction percentage (Figure 3 (a)). When the coarse fractions were in medium range, it can be seen from Figure 3 (b) that there was an optimum composition for maximum green anode density, even if the variation in dry aggregate density was not very large. For the anode with a high amount of coarse fraction, the green anode density increased with decreasing medium fraction percentage whereas dry aggregate density showed the completely opposite trend (Figure 3 (c)). The results also showed that, at a higher level of medium fraction percentage and at a certain point, the dry aggregate and green anode densities were the same and showed opposite trend on both sides of this point.
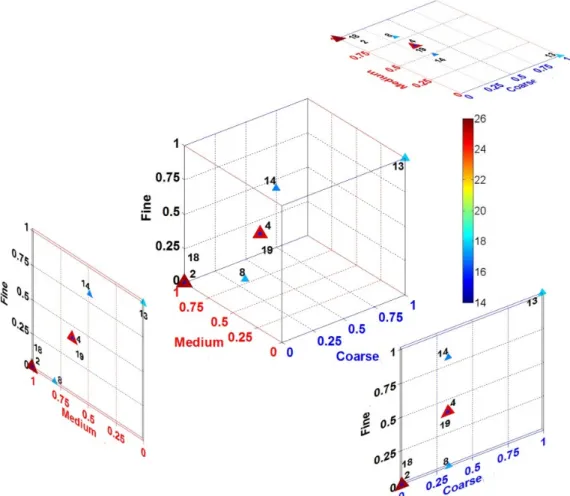
Similar approach was taken to analyze the effect of recycled anode butt percentage on dry aggregate and green anode density. It could be seen from Figure 4 that predicted dry aggregate density and green anode density increased with increasing butt content up to certain level. Afterwards, it decreased. These results indicate that it is important to select an optimum range for each fraction to improve the anode density.
Figure 3. Effect of medium fractions on normalized dry aggregate density and normalized green anode density (a) low amount of coarse fraction (b) medium amount of coarse fraction (c) high amount of coarse fraction
Figure 4. Effect of normalized recycled butt on normalized dry aggregate density and normalized green anode density
3.2 Effect of Particle Size Distribution on Anode Properties
To establish the impact of particle size distribution on anode density, two sets of experiments were carried out. Several recipes were prepared using various combinations of recycled anode butt as well as the coarse, medium, and fine fractions of fresh coke. Characterization of anodes produced from different recipes is discussed in this section. All recipes with their corresponding anode numbers are presented in Table 3.
(b) (a)
Table 3. Anode recipes and their corresponding anode number and properties
Anode No
Butt(%) Coarse* Medium* Fine* Type of coke Green Anode Density(g/cc) Green Elec.Res. (µΩm) Baked Anode Density(g/cc) Baked Elec.Res. (µΩm) 1**1 25 0.0 1.0 0.0 CPC 1 1.587 5566 1.543 59.04 2** 25 0.0 1.0 0.0 CPC 1 1.586 6357 1.528 59.86 31 25 0.3 0.6 0.3 CPC 1 1.638 3837 1.572 54.88 4 25 0.3 0.6 0.3 CPC 1 1.629 3951 1.561 54.29 5 25 0.3 0.6 0.3 CPC 1 1.632 3933 1.563 54.22 6*** 25 0.3 0.6 0.3 CPC 1 1.585 6647 1.535 57.93 7 25 0.6 0.0 1.0 CPC 1 1.568 5868 1.478 65.05 8 25 0.3 0.8 0.0 CPC 1 1.603 4539 1.546 60.02 9 25 0.3 0.6 0.4 CPC 1 1.587 6349 NA NA 10 25 0.3 0.4 0.6 CPC 1 1.593 5090 1.512 65.35 11 25 0.7 0.2 0.6 CPC 1 1.590 4256 NA NA 12 0 1.0 0.0 0.6 CPC 1 1.574 5840 NA NA 13 25 1.0 0.0 0.6 CPC 1 1.623 4043 1.546 57.23 14 25 0.3 0.5 0.5 CPC 1 1.625 4487 1.552 58.11 15 0 0.0 1.0 0.0 CPC 1 1.576 4505 1.511 54.01 16 15 0.0 1.0 0.0 CPC 1 1.577 6357 1.506 59.09 17 35 0.0 1.0 0.0 CPC 1 1.568 6409 1.496 59.74 18** 25 0.0 1.0 0.0 CPC 2 1.594 5909 1.546 60.41 19 25 0.3 0.6 0.3 CPC 2 1.626 4258 1.571 55.05
1 The anodes 1 and 3 were produced earlier, and the vibro speed was not measured. *All the coke fractions are normalized by column wise using Equation 1. ** Standard recipe
***14% pitch was used where the other anodes were made with 15% pitch CPC 1: Calcined petroleum coke 1, CPC 2: Calcined petroleum coke 2.
3.2.1 Green and Baked Density of Anodes
To establish the effect of fraction sizing on green anode density, a total of 19 pilot-scale anodes were prepared from two different sources of petroleum coke using different recipes including a standard recipe (Anode 1 and 2, Table 3. Aggregate size distributions, specially medium and coarse fractions, were varied. The anode making conditions were kept the same for all the anodes.
The recipes with different recycled butt contents showed consistently that the green and baked densities are higher at 25% butt content compared to those at lower and higher butt contents (Table 3). In all recipes, 15% pitch was used except for anode 6. This result is in accordance with the results given in literature (Fischer, 1991). For anode 17, the butt content was increased to 35%, which slightly reduced the anode density. In general, recycled anode butt is more wettable compared to petroleum coke (Adams, 2004. Adams, 2004). However, it also has lower surface porosity. It is possible that the anode was overpitched due to presence of excess butt, hence, pitch layer around the butt particles (as it has less porosity) was thicker compared to that of the petroleum coke. This resulted in an increase in anode volume which in turn decreased the density. In addition, the shape of the recycled butt particles is completely different than that of petroleum coke (Bhattacharyay, 2014). It is possible that this might have affected the packing behavior of the aggregate causing a decrease in green anode density. It is also possible that higher butt content changes the binder demand (Prouix, 1993) which, in turn, affects density if the binder content is not adjusted accordingly.
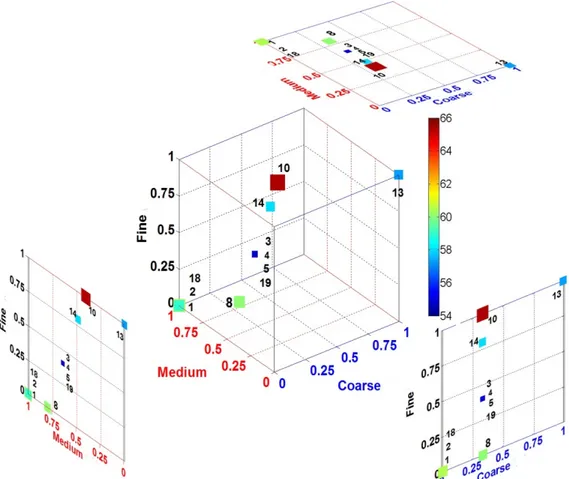
Green and baked densities of anodes produced from different recipes with constant butt and pitch contents are illustrated in Table 3 and in 3-D plots in Figures 5, respectively. In 3-D plots, symbol sizes increases and color code changes with increasing density values. The axes represents the normalized coarse, medium, and fine fractions used in the recipe. Anode 1 and 2 represent the typical standard recipe. Aiming to improve the anode density, trials were carried out to adjust the medium and coarse fractions in the recipe based on ANN results. Decrease of medium fraction around 40% compared to that of the standard recipe (Table 3 and Figure 5) improved the green and baked anode densities when 25% butt was maintained in the recipe. It is a well-known fact that an increase in fine fractions increases the anode density but it can also affect the anode mechanical properties and
binder demand. In this study, the ultra-fine fractions (BMP and FD) were kept similar to that of the standard recipe. Finally, an improved anode recipe (anodes 3, 4, and 5) was found to result in higher green and baked anode densities compared to those of the standard recipe. Green density of anode increased from 1.586 g/cc to 1.638 g/cc and baked density increased from 1.543 g/cc to 1.572 g/cc. Two repetitive measurements were done to confirm the improvement of the anode properties. An increase in density was observed for an anode produced using a different coke with similar recipe (see anode 19 in Table 3 and Figure 5). Recipe corresponding to anode 14 also revealed a promising trend. The results showed that lower amount of the medium fractions in the paste recipe gave comparatively better green anode density. Hulse (Hulse 2000) also found similar trend and mentioned in her thesis that lower intermediate fraction could improve the dry aggregate density yielding higher anode density. The results also showed that complete removal of medium fraction sharply reduced the anode quality (anodes 7 and 12) except for anode 13. It can be seen that for anode 7, density was reduced even though it contained high amount of fines. It was possible that density was reduced because inter-particle spaces were not well filled as the medium fraction was completely missing. Also it was possible that higher amount of fines increased the binder demand and coke particles were not wetted sufficiently by pitch due to under-pitching. As it can be seen, the recipe of anode 12 and 13 were similar with exception of their butt content. The density of anode 12 was lower as this anode did not contain any recycled anode butt. This result was in good agreement with the previous findings of the present study (Sarkar 2015). This showed that suitable amount of recycled anode butt, medium, coarse, and fines fractions were required to have good packing and good anode properties. Thus, it is evident that the presence of lower medium fractions with optimal recycled butt, coarse, and fine particles can improve the anode density. As it can be seen in Table 3, the pitch level had pronounced influence on the green and baked density (anodes 3 and 6). As noted, the anode containing 14% pitch (anode 6) had inferior quality than that with 15% (anode 3) pitch. The baked anode densities also followed same trend as that of the green anode densities.
3.2.2 Electrical Resistivity of Green and Baked Anodes
The electrical resistivity (ER) measurement is essential to determine the anode quality. The ER gives an indication of the structural integrity through the current conducting properties of the anode. Electrical resistivity of anode is closely related to anode density. Generally higher density anodes should yield lower ER as dense anode contains lower porosity. However, this is not always the case as highly dense anodes can have more crack formation during baking which results in higher ER.
Several physico-chemical transitions occur in anodes at different stages of heat treatment. The principal chemical reaction is dehydrogenative polymerization of aromatic compounds. Initially, monomeric PAHs undergo addition reaction to produce biaryls and oligo-aryls. Afterwards, bi- and oligo-aryls go through intramolecular dehydrocyclization reactions to form pericondenzed aromatic systems which continue to grow larger by cross linking (Zande, 1997; Engvoll, 2001). At this stage, evolution of mesophase occurs and these spherical molecules go through polymerization reactions which generate long chains of molecules, consequently, reduce specific electrical resistivity of anodes (Brooks, 1968; Engvoll, 2001). On the contrary, production of bigger mesophase spheres in higher quantity could hinder the pitch penetration into pores. In addition, bigger molecules could generate more cracks. Also, this kind of polymerization reactions are reversible in nature and upon reaching to their decomposition temperature, the reversible transition begins. This might lead to an increase in the anode electrical resistivity (ER). Therefore, it is hard to find a clear-cut relation with baked density and ER. The ER of the green and baked anodes was measured using custom made equipment developed at UQAC and results are presented in Table 3 and Figure 6.
The results showed that anode produced without butt had the lowest electrical resistivity. ER increased if butt was added to the aggregate recipe. However, it slightly changed with further increase in butt content. This result is in contrast with the work reported by Belitkus (Belitskus, 1981). Anode 17 exhibited lowest density that resulted highest value of ER. Anode 2 had somewhat higher ER compared to anode 1 (both were made from the same recipe and butt content). Highest green and baked density of anode 1 (standard recipe) gave lowest ER among all the recipes studied with different butt content. The decrease in baked anode resistivity observed for anode 15 compared to that of the standard anode could be attributed to the absence of butt particles. Since the mechanical properties of butts and fresh coke are different, the stress created at the positions where butt is present might cause new cracks to form.
Table 3 gives the ER of the anodes for pitch contents. The ER was reduced with increased pitch level to 15% from 14%. This result was in good agreement with the findings of Figueiredo et al. (2005). Previous investigation demonstrated that for higher pitch content, density was higher which was directly reflected on electrical resistivity results. Of course this is only true if the anodes are not overpitched.
The ER values of the green and baked anodes produced from different paste recipes are in Table 3 and Figure 6 respectively. The changes in ER of anodes with different recipes generally followed the opposite of the trend found for the density. In most cases, highly dense green and baked anodes displayed lower ER. For some baked anodes, this trend was not followed. This can be explained with the mesosphere formation which was described earlier. Decrease in medium fraction with adjusted coarse, fine and butt contents led to a general decrease in ER of green anodes. The best recipe (anodes 3, 4, and 5) found among the recipes tried during this study resulted in highest green and baked anode densities (table 3 and Figure 6) as well as lowest ER for both green and baked anodes. The 3-D plot (Figure 6) showed that anode electrical resistivity of baked anodes produced from the best recipe (anodes 3, 4 and 5) reduced significantly from 59 µΩm to 54 µΩm compared to standard recipe (anodes 1 and 2). Anode produced from CPC2 also displayed similar tendency and anode ER of baked anodes formed from the best recipe (anode 19) reduced from 60 µΩm to 55 µΩm compared to standard recipe (anode 18) (Figure 6). Anodes 12 and 13 were produced from similar recipe but green ER of anode 12 was higher (Table 3). Since the recipe of anode 13 resulted in much higher density, its resistivity was lower. Anode 14, which had a higher density value, exhibited lower ER in green stage; but, after baking, the ER value was just slightly lower than the standard recipe. Similar trend was observed for anode 13. Alternatively, anode 7 and 10 which had comparatively lower ER before baking gave higher ER after baking compared to the standard recipe (Table 3). Thermochemical changes and formation of mesophase during baking could be the probable reason behind this behavior as described in different literatures (Brooks 1968, Zande 1997, Engvoll 2001). Also, cracks forming during baking can affect ER. Maximum values of ER were measured for anodes 2 and 9 before baking (Table 3). Similarly, anode 10 had the maximum value of ER after baking (Figure 6).
Figure 6. Electrical resistivity of baked anodes produced from different recipes (symbol size increases with increasing electrical resistivity)
3.2.3 Air Reactivity
During the electrolysis, although the anodes are covered with a mixture of alumina and crushed bath material for protection, air can still penetrate through the cover material and react with the anodes leading to dusting. The air reactivity and dusting data obtained using ASTM D6559-00 a method are given in Table 4; Figures 7 illustrates the trends observed for air reactivity of anodes, made with two different types of coke and with different recipes including different butt and pitch contents. In this section, only the air reactivities of high density baked anodes compared to that of the standard recipe with the objective of finding out how the reactivity was affected when the anode quality was improved (high density, low ER) using ANN. It can be seen from Table 4 and Figure 7 that there were differences in reactivities of the anodes produced from the same recipe such as anodes 1 and 2 (both produced from the standard recipe) as well as anodes 3 and 4 (both produced from the best recipe).
Table 4 shows the effect of butt content on anode total air reactivity and dusting. The results corresponded well with those reported by Belitskus (Belitskus, 1981). The recycled butt additions seemed to increase the overall anode air reactivity due to its sodium content and the presence of other impurities such as potassium, calcium, aluminum, iron, sulfur, nickel, silicon, fluoride etc. (Schmidt-Hatting, 1991; Suriyapraphadilok, 2005, Fischer, 2013). The reactivity was minimum when anode did not contain any butt. The air reactivity was more affected by butt content than the CO2 reactivity, which will be presented in the next section. The results also showed that at 35% butt content, reactivity suddenly dropped, but dusting increased continuously with increasing butt content. This could be correlated with density of the anodes. Air could react with impurities, aromatic and aliphatic carbon on the surface of the anode. Higher density represents a higher amount of carbon on the surface which in turn increases the air reactivity. As it was previously shown, anode containing 25% of butt exhibited highest green and baked density. Therefore, this could be the possible reason for higher air reactivity.
Table 4. Air reactivity and dusting data of the anodes produced from different recipes
Anode No Butt (%) Coarse Medium Fine Pitch (%) Total Rate (mg/cm2h)
Dusting Rate (mg/cm2h)
%/min Sample Baked Density (g/cc) (core 3) 1 25 0.0 1.0 0.0 15 66.46 5.83 0.088 1.541 2 25 0.0 1.0 0.0 15 97.69 5.81 0.135 1.525 3 25 0.3 0.6 0.3 15 73.70 5.60 0.095 1.543 4 25 0.3 0.6 0.3 15 108.09 3.06 0.142 1.555 6 25 0.3 0.6 0.3 14 62.32 3.38 0.082 1.541 7 25 0.0 0.6 0.0 15 56.53 6.86 0.078 1.502 8 25 0.3 0.8 0.0 15 108.85 4.52 0.146 1.537 13 25 1.0 0.0 0.6 15 70.74 4.47 0.094 1.550 14 25 0.3 0.5 0.5 15 116.28 5.66 0.152 1.553 15 0.0 0.0 1.0 0.0 15 43.44 2.52 0.059 1.517 16 15 0.0 1.0 0.0 15 74.50 4.74 0.100 1.522 17 35 0.0 1.0 0.0 15 77.87 7.56 0.103 1.524 18 25 0.0 1.0 0.0 15 127.33 3.57 0.165 1.553 19 25 0.3 0.6 0.3 15 121.50 3.46 0.157 1.565
The air reactivity of the anodes seemed to be strongly affected by the anode recipe including different pitch level (Table 4). The anode (anode 6) with lower pitch content (14%) had a lower overall air reactivity and dusting compared with the anode containing higher amount of pitch (15%) (anode 2). Table 4 shows that the amount of dust produced due to air reactivity from the anode was sensitive to the binder pitch level. The higher air reactivity was probably caused by the mechanisms of selective oxidation although the oxidation of coke was also very fast. Binder matrix is more reactive than coke causing selective air burn of the binder matrix (Lhuissier, 2007, Lhuissier 2009, Sulaiman 2012). The higher amount of pitch resulted in increased amount of dust and air reactivity.
Figure 7. Total air reactivity of anodes prepared with different recipes (symbol size increases with increasing air reactivity)
Table 4 and Figure 7 present the total air reactivity measurements and dusting during air reactivity for different anode paste recipes. The 3-D plot (Figure 7) indicates that anode air reactivity increased with decreasing medium particles content (anode 4, 8, 14, 19). This is again due to the increase in the anode density with decreasing medium fractions in the anode paste recipe. As discussed earlier, highly dense anodes led to higher air reactivity due to increased contact surface. The best recipe (anode 4) of this study had higher air reactivity but lower dusting compared to the standard recipe (anode 2). In most of the recipes studied, highly dense anodes (anode 14) had higher overall air reactivity and dusting. Figure 7 shows that anode 13, which did not contain any medium fraction, had lowest air reactivity. Figure 7 also illustrates that anode prepared from CPC 2 coke (anode 18 and 19) had higher air reactivity compared to anode produced from CPC 1 coke (anode 2 and 4) for the same recipe due to higher sodium content and higher real density for CPC 2 coke (see Table 1). It can be also noted from the Table 4 that dusting did not follow any trend with the air reactivity. Anode 4 showed the lowest and anode 14 indicated the highest dusting values within the range of study.
3.2.4 CO2 Reactivity
Carbon dioxide is produced during the alumina reduction which can react with the anode carbon to produce carbon monoxide. Similar to air reactivity, CO2 reactivity also leads to dusting due to the partial disintegration of the anodes. In order to investigate the effect of anode paste recipe on the CO2 reactivity and dusting, anode samples were tested using ASTM D6558 - 00a (2010) method.
Table 5. CO2 reactivity data of the anodes produced from different recipes
Anode No
Butt (%)
Coarse Medium Fine Pitch
(%) Total Rate (mg/cm2h) Dusting Rate (mg/cm2h) %/min Sample Baked Density (g/cc) (core 1) 1 25 0.0 1.0 0.0 15 20.25 2.24 0.027 1.535 2 25 0.0 1.0 0.0 15 15.10 1.66 0.021 1.521 3 25 0.3 0.6 0.3 15 20.62 1.48 0.026 1.545 4 25 0.3 0.6 0.3 15 15.72 0.59 0.021 1.549 6 25 0.3 0.6 0.3 14 17.95 1.48 0.023 1.536 7 25 0.0 0.6 0.0 15 23.49 3.48 0.031 1.518 8 25 0.3 0.8 0.0 15 17.43 1.23 0.023 1.530 13 25 1.0 0.0 0.6 15 17.75 1.47 0.023 1.539 14 25 0.3 0.5 0.5 15 16.89 0.98 0.022 1.554 15 0.0 0.0 1.0 0.0 15 15.31 0.88 0.021 1.514 16 15 0.0 1.0 0.0 15 16.27 1.22 0.022 1.524 17 35 0.0 1.0 0.0 15 25.13 4.11 0.033 1.517 18 25 0.0 1.0 0.0 15 25.44 4.50 0.035 1.556 19 25 0.3 0.6 0.3 15 24.76 3.22 0.032 1.569
The effect of butt content on anode CO2 reactivity can be seen in Table 5. Recycled anode butt contains many impurities. These include sodium, potassium, calcium, aluminum, iron, sulfur, nickel, silicon, fluoride and others (Schmidt-Hatting 1991, Suriyapraphadilok 2005, Fischer 2013). As expected, anode CO2 reactivity increased with increasing butt content due to the presence of impurities which can catalyze the reaction. However, anode CO2 reactivity is not only dependent on the level of impurities but also on anode density. All anodes with different butt levels displayed a similar trend with respect to density. Higher density of anodes exhibited lower CO2 reactivity. Though anode 2 has 25% butt content, it exhibited lower CO2 reactivity due to its higher density. CO2 reactivity is controlled by diffusion where it is solely determined by the ability of this gas to penetrate though the open pores and react with the carbon body of the anodes. Higher density corresponds to lower porosity which in turn helps reduce the CO2 reactivity. Table 5 presents that anode dust formation, which increased with increasing butt content due to increased impurity content.
In addition to anode density and impurity content, CO2 reactivity of anodes depends on several other factors such as the type and proportion of raw materials in the anode recipe (amount of pitch, coke and butt) and graphitization level (Lavigne 1993, Hume 1999, Tkac 2007). CO2 reactivity and dust also decreased as the level of pitch was increased (anode 4 and 6; Table 4). The CO2 reactivity and dusting results for other recipes are presented in Figures
8 and Table 5. Figure 8 shows that anode CO2 reactivity reduces with the reduction in medium fractions in the paste recipe compared to that of the standard recipe (anode 2). This result is directly related to the anode density. A trend was previously observed that a reduction (anodes 4, 8) or complete elimination (anode 13) of medium fractions from recipe with adjusted amounts of coarse, fine and butt improved the anode density (Figures 8 and Table 3). It can be also seen from Figures 8 and Table 5 that total CO2 reactivity of anode 4 (best recipe) was similar to anode 2 (standard recipe), but the dust rate was much lower for anode 4 (best recipe) due to higher density of anode 4 compared to anode 2, which helped reduce the CO2 gas diffusion into anode. Another recipe (anode 14) also exhibited significantly lower dusting compared to that of the standard recipe due to its higher density. Anode produced from CPC 2 coke (anodes 18 and 19, Figures 8 and Table 5), had comparatively higher rate of reactivity and dusting due to lower concentration of sulfur. It was found in literature that sulfur inhibited the catalytic activity of metal impurities (Hume, 1999; Tran, 2009; Hume, 2013).
Figure 8. Total CO2 reactivity of anodes prepared with different recipes (symbol size increases with higher values) The carbon anodes are consumed during the electrolysis process and have to be replaced every 2-4 weeks depending on the size and density of the anode and the operating conditions of the electrolytic cell. Therefore, 7 h standard CO2 reactivity test does not represent the actual reactivity and dusting in the electrolysis cell as anodes are exposed to the bath for longer times. For a better understanding, a 21-hour CO2 reactivity test was carried out for standard (anodes 2 and 18) and best recipes (anodes 4 and 19) for both cokes. Anodes 2 and 4 were produced from CPC 1 coke and anodes 18 and 19 were produced from CPC 2 coke. The results of the 21-hour CO2 test are shown in Figure 9. Results demonstrate that for best recipe (anodes 4 and 19), total CO2 rates were reduced and compared to those of the standard recipe (anodes 2 and 18). It could be also seen from Figure 9 (a) that the final rate was significantly reduced for best recipe (anodes 4 and 19) for both cokes. Dusting rate was always better for adjusted best recipe regardless of the type of coke (anodes 4 and 19). The reason for this behavior could be higher density of the best recipe compared to that of the standard recipe. Also, anode produced from CPC 2 coke exhibited higher CO2 reactivity and dusting due to lower sulfur content of this coke.
Figure 9. (a) Total CO2 reactivity (21 h) and (b) CO2 dust (21 h) of standard and best recipes
3.2.5 Uniaxial Compressive Strength
The compressive strength, carried out at room temperature, indicates the capacity of a material to withstand axially directed compressive forces. When the limit of the compressive strength is reached, the materials are crushed. The effect of the recipe on physical properties and reactivity was studied and the results are presented in the previous sections. However, the granulometry also affects the mechanical properties. Therefore, the compressive strength of baked anodes was measured according to ASTM C695-91 (2005) standard. The modulus of elasticity (Young’s modulus) was determined experimentally from the slope of the stress-strain curve obtained during compression tests. A low Young’s modulus means a small slope and therefore represents a material with high elasticity. The measurement of mechanical properties was carried out to ensure that the recipe proposed in this study was mechanically feasible. The compressive strength and Young modulus of the samples are tabulated in Table 6. All the Young modulus data are presented in dimensionless form by dividing the actual value by the highest value. Table 6. Compressive strength of anode sample
Sample No (Anode)
Compressive Strength (MPa)
Young Modulusa Specification
1 36.7 0.86 Std-CPC1 3 30.5 0.82 Best-CPC1 2 35.7 0.92 Std-CPC1 4 32.6 0.69 Best-CPC1 5 42.5 1.00 Best-CPC1 5 40.0 - Best-CPC1 18 37.6 0.93 Std-CPC2 19 37.4 0.91 Best-CPC2 a Dimensionless value.
The compressive strength values were found to be within an acceptable range. Anodes 3 and 4 had slightly lower compressive strength compared to that of the standard but anode 5 exhibited higher value. Anode 19 produced from coke CPC 2 showed similar compressive strength with standard recipe, anode 18. Similar trend was observed with the Young modulus. Anodes 3 and 4 had marginally lower Young modulus compared to the standard. Anode 19 produced from coke CPC 2 displayed similar Young modulus with standard recipe (anode 18). A probable cause of this lower value of compressive strength for anode 3 was micro cracks. These results indicated that it was possible to produce anodes using the best recipe found during this study with a compressive strength within an acceptable range of 30-65 MPa (Perruchoud 2004).
3.2.6 Flexural Strength (Bending)
The flexural strengths of baked anodes produced from best and standard recipes were compared (Table 7) in order to carry out final screening. The test results showed that the anode from best recipe had similar flexural strength to that of standard recipe and varied within the range of 9-11 MPa. The flexural strength values of best recipe lied within in the practical range of industrially accepted anode flexural strength of 4–14 MPa (Perruchoud 2004).
(b) (a)
Table 7. Flexural strength (Bending) of anodes
Anode No. Bending stress (MPa) Specification
1 11.3 Std-CPC1 3 8.7 Best-CPC1 2 10.7 Std-CPC1 4 11.0 Best-CPC1 18 10.7 Std-CPC2 19 9.8 Best-CPC2 4. Conclusions
Extensive pilot scale work on determining the effect of coke properties, particle size distribution, butt content and binder level on anode properties was done. A new recipe was developed which led to better anode properties compared to those of the standard recipe. The results showed that reducing the medium fraction to with adjusted amount of coarse, fine and recycled butt can improve the overall anode quality. This might make their application possible in industry. Information obtained from the ANN analysis might be useful for plants since controlling the recipe is not an easy task when the raw material quality is changing continuously. The ANN model developed might be used to improve the anode density by readjusting the aggregate granulometry when there is a change in raw material properties during operation.
Acknowledgments
The technical and financial support of Aluminerie Alouette Inc. as well as the financial support of the Natural Sciences and Engineering Research Council of Canada (NSERC), Dévelopment économique Sept-Îles, Université du Québec à Chicoutimi (UQAC), and the Foundation of Université du Québec à Chicoutimi (FUQAC) is greatly appreciated.
References
Adams, A. N. (2004). Characterization of the pitch wetting and penetration behavior of petroleum coke and
recycled butts in pre-baked carbon anode. PhD, Pennsylvania State University.
Adams, A. N., & Schobert, H. H. (2004). Characterization of the surface properties of anode raw materials. Light
Metals., 495-498.
Asadi-Eydivand, M., Solati-Hashjin, M., Farzadi, A., & Osman, N. A. A. (2014). Artificial neural network approach to estimate the composition of chemically synthesized biphasic calcium phosphate powders.
Ceramics International, 40(8 PART A), 12439-12448. http://dx.doi.org/10.1016/j.ceramint.2014.04.095
Bahlmann, C., Heidemann, G., & Ritter, H. (1999). Artificial neural networks for automated quality control of textile seams. Pattern Recognition, 32(6), 1049-1060. http://dx.doi.org/10.1016/S0031-3203(98)00128-9 Belitskus, D. (1981). Effect of carbon recycle materials on properties of bench scale prebaked anodes for
aluminum smelting. Metallurgical Transactions B, 12(1), 135-139. http://dx.doi.org/10.1007/BF02674766 Berezin, A. I., Polaykov, P. V., Rodnov, O. O., Klykov, V. A., & Krylov, V. L. (2002). Improvement of green
anodes quality on the basis of the neural network model of the carbon plant workshop. Light Metals, 605-608. Bhagavatula, Y. S., Bhagavatula, M. T., & Dhathathreyan, K. S. (2012). Application of artificial neural network in performance prediction of PEM fuel cell. International Journal of Energy Research, 36(13), 1215-1225. http://dx.doi.org/10.1002/er.1870
Bhattacharyay, D., Kocaefe, D., Kocaefe, Y., & Morais, B. (2015). An artificial neural network model for predicting the CO2 reactivity of carbon anodes used in the primary aluminum production. Neural Computing
and Applications. http://dx.doi.org/10.1007/s00521-015-2093-7
Bhattacharyay, D., Kocaefe, D., Kocaefe, Y., Morais, B., & Gagnon, M. (2013). Application of the artificial neural network (ANN) in predicting anode properties. Light Metals, 1189-1194.
Bhattacharyay, D., Kocaefe, D., Kocaefe, Y., Sarkar, A., Morais, B., & Chabot, J. (2014). Characterization of dry aggregates in carbon anodes by image analysis. Light Metals., 1111-1114. http://dx.doi.org/10.1002/978111 8888438.ch185
Biedler, P., Banta, L., Dai, C., Love, R., Tommey, C., & Berkow, J. (2002). Development of a state observer for an aluminum reduction cell. Light Metals, 1091-1098.
Boadu, K. D., & Omani, F. K. (2010). Adaptive control of feed in the Hall-Héroult cell using a neural network.
JOM, 62(2), 32-36. http://dx.doi.org/10.1007/s11837-010-0028-4
Bowers, R., Ningileri, S., Palmlund, D. C., Vitchus, B., & Cannova, F. (2008). New analytical methods to determine calcined coke porosity, shape, and size. Light Metals., 875-880.
Brooks, J. D., & Taylor, G. H. (1968). Chemistry and Physics of Carbon. New York.
Engvoll, A. M. (2001). Reactivity of anode raw materials and anodes for production of aluminium. PhD, NTNU. Farr-Wharton, R., Welch, B. J., Hannah, R. C., Dorin, R., & Gardner, H. J. (1980). Chemical and electrochemical oxidation of heterogeneous carbon anodes. Electrochimica Acta, 25(2), 217-221. http://dx.doi.org/10.1016/ 0013-4686(80)80046-6
Figueiredo, F. E. O., Kato, C. R., Nascimento, A. S., Marques, A. O. F., & Miotto, P. (2005). Finer fines in anode formulation. Light Metals., 665-668.
Fischer, W. K., & Perruchoud, R. C. (2013). Interdependence Between Properties of Anode Butts and Quality of Prebaked Anodes. Essential Readings in Light Metals: Electrode Technology for Aluminum Production, 4, 267-270. http://dx.doi.org/10.1002/9781118647745.ch34
Fischer, W., & Perruchoud, R. (1991). Interdependence between properties of anode butts and quality of prebaked anodes. Light Metals, 721-724.
Fruhwirth, R. K., Filzwieser, A., Pesl, J., & Steinlechner, S. (2007). Computational intelligence - Neural computation in a copper refinery. Proceedings - European Metallurgical Conference, EMC 2007, 1, 13-29. Hulse, K. L. (2000). Anode Manufacture: Raw Materials, Formulation and Processing Parameters. Sierre,
Switzerland, R&D Carbon Ltd.
Hume, S. M. (1999). Anode reactivity: influence of raw material properties. Sierre Suisse., R & D Carbon Ltd. Hume, S. M., Fischer, W. K., Perruchoud, R. C., Metson, J. B.,Terry, R., & Baker, K. (2013). Influence of
petroleum coke sulphur content on the sodium sensitivity of carbon anodes. Essential Readings in Light
Metals: Electrode Technology for Aluminum Production, 4, 123-129. http://dx.doi.org/10.1002/978111864
7745.ch17
Lavigne, L., & Castonguay, L. (1993). Prediction of anode performance from calcined coke properties. Light
Metals., 569-575.
Lhuissier, J. (2007). About the use of under-calcined coke for the production of low reactivity anodes. International pitch and calcined petroleum coke conference-Industrial quimica del nalon and Jacobs consultancy.
Lhuissier, J., Bezamanifary, L., Gendre, M., & Chollier, M. J. (2009). Use of under-calcined coke for the production of low reactivity anodes. Light Metals., 979-983.
Meghlaoui, A., Bui, R. T., Thibault, J., Tikasz, L., & Santerre, R. (1998). Predictive control of aluminum electrolytic cells using neural networks. Metallurgical and Materials Transactions B: Process Metallurgy
and Materials Processing Science, 29(5), 1007-1019. http://dx.doi.org/10.1007/s11663-998-0069-z
Milewski, J., & Świrski, K. (2009). Modelling the SOFC behaviours by artificial neural network. International
Journal of Hydrogen Energy, 34(13), 5546-5553. http://dx.doi.org/10.1016/j.ijhydene.2009.04.068
Mohanty, C., & Jena, B. K. (2014). Optimization of aluminium die casting process using artificial neural network.
International Journal of Emerging Technology and Advanced Engineering, 4(7), 146-149.
Pang, G., Xu, W., Zhai, X., & Zhou, J. (2004). Forecast and control of anode shape in electrochemical machining using neural network. Lecture Notes in Computer Science (including subseries Lecture Notes in Artificial
Intelligence and Lecture Notes in Bioinformatics), 3174, 262-268. http://dx.doi.org/10.1007/978-3-540-286
48-6_41
Parthiban, T., Ravi, R., & Kalaiselvi, N. (2007). Exploration of artificial neural network [ANN] to predict the electrochemical characteristics of lithium-ion cells. Electrochimica Acta, 53(4), 1877-1882. http://dx.doi.org/ 10.1016/j.electacta.2007.08.049
Perruchoud, R. C., Meier, M. W., & Fischer, W. K. (2004). Survey on worldwide prebaked anode quality. Light
Piuleac, C. G., Rodrigo, M. A., Ca-izares, P., Curteanu, S., & Sáez, C. (2010). Ten steps modeling of electrolysis processes by using neural networks. Environmental Modelling and Software, 25(1), 74-81. http://dx.doi.org/ 10.1016/j.envsoft.2009.07.012
Prouix, A. L. (1993). Optimum binder content for prebaked anodes. Light Metals., 657-661.
Saengrung, A., Abtahi, A., & Zilouchian, A. (2007). Neural network model for a commercial PEM fuel cell system. Journal of Power Sources, 172(2), 749-759. http://dx.doi.org/10.1016/j.jpowsour.2007.05.039 Sarkar, A. (2015). Effect of coke properties on anode properties. PhD, University of Quebec at Chicoutimi. Schmidt-Hatting, W., Kooijman, A. A., & Perruchoud, R. (1991). Investigation of the quality of recycled anode
butts. Light Metals, 705-720.
Shang, G. Q., & Sun, C. H. (2008). Application of BP neural network for predicting anode accuracy in ECM. 2008
International Symposium on Information Science and Engineering, ISISE 2008. http://dx.doi.org/10.1109/
ISISE.2008.55
Smith, M., Perruchoud, R., Fischer, W., & Welch, B. (1991). Evaluation of the effect of dust granulometry on the properties of binder matrix bench scale electrodes. Light Metals, 651-655.
Sulaiman, D., & Garg, R. (2012). Use of under calcined coke to produce baked anodes for aluminium reduction lines. Light Metals., 1147-1151.
Suriyapraphadilok, U., Halleck, P., Grader, A., & Andresen, J. M. (2005). Physical, chemical and X-ray Computed Tomography characterization of anode butt cores. Light Metals, 617-621.
Tkac, M. (2007). Porosity development in composite carbon materials during heat treatment. Philosophiae doctor (PhD), Norwegian University of Science and Technology.
Tran, K. N., Berkovich, A. J., Tomsett, A., & Bhatia, S. K. (2009). Influence of sulfur and metal microconstituents on the reactivity of carbon anodes. Energy and Fuels, 23(4), 1909-1924. http://dx.doi.org/10.1021/ef8009519 Wang, L., Apelian, D., Makhlouf, M., & Huang, W. (2008). Predicting compositions and properties of aluminum
die casting alloys using artificial neural network. Metallurgical Science and Technology, 26(1), 16-21. Zande, M. (1997). Introduction to Carbon Technologies. University of Alicante, Alicante.
Copyrights
Copyright for this article is retained by the author(s), with first publication rights granted to the journal.
This is an open-access article distributed under the terms and conditions of the Creative Commons Attribution license (http://creativecommons.org/licenses/by/4.0/).