Audet: GRÉDI, Université de Sherbrooke, 2500, boulevard de l’Université, Sherbrooke, Québec, Canada J1K 2R1
maudet@worldbank.org
Boccanfuso: Département d’économique and GRÉDI, Université de Sherbrooke, 2500, boulevard de l’Université, Sherbrooke, Québec, Canada J1K 2R1
dorothee.boccanfuso@USherbrooke.ca
Makdissi: Département d’économique and GRÉDI, Université de Sherbrooke, 2500, boulevard de l’Université, Sherbrooke, Québec, Canada J1K 2R1
paul.makdissi@USherbrooke.ca
Cahier de recherche/Working Paper 07-07
Food Subsidies and Poverty in Egypt: Analysis of Program Reform
using Stochastic Dominance
Mathieu Audet
Dorothée Boccanfuso Paul Makdissi
Abstract:
Throughout this article, we utilize consumption dominance curves, a tool developed by Makdissi and Wodon (2002) to analyze the impacts on poverty brought on by changes in the food subsidy system in Egypt. The Egypt Integrated Household Survey (EIHS) of 1997 allows us to conclude that changes brought to these subsidies have not always worked towards alleviating poverty.
Keywords: Subsidy, Marginal Tax Reforms, Egypt JEL Classification: D12, D63, I21, I32
1
Introduction
In 1997, the food subsidy program alone represented 5.6% of total government expenditures in Egypt. Numerous changes have been brought to this system to help alleviate budgetary pressure while maintaining affordable prices for primary food goods. In 2004-2005, the Egyptian government spent the equivalent of 2 billion US dollars on their food subsidy program (see Rasromani, 2006). This being said, the objective of the paper is to analyse the spending structure of Egyptian households to better understand whether these reforms were an adequate tool for fighting poverty.
According to Santoro (2006), economic literature identifies three different approaches that can be used to analyze marginal tax reforms. The first type is based on the initial works by Ahmad and Stern (1984) who utilize a specific social welfare function. The second type of approach identifies avenues for tax reform based on the aversion to inequality and symmetry of the social welfare function. This approach is based on works by Yitzhaki and Thirsk (1990), Yitzhaki and Slemrod (1991) and Mayshar and Yitzhaki (1996). The third and final approach considers that marginal tax reforms can be used as instruments for reducing poverty. It is based on works by Makdissi and Wodon (2002), Liberati (2003) and Duclos, Makdissi and Wodon (2006). The third approach will be utilized in this paper.
The following section will present a brief methodological framework. The third section presents our analysis of the Egyptian data while utilizing this framwork. In closing, we present a brief conclusion and possibilities for future research.
2
Methodological framework
Let us suppose that the government wished to reduce an additive poverty index with an indirect tax reform. These types of indices have the following form:
(
,)
( ) (
, , 0∫
=a p y z dF y z F P)
]
)
(1)where y is the equivalent income, z , the poverty line, F , the cumulative income distribution based on
[
0,a and p ,(
y z is a function which measures the share of total poverty belonging toan individual with an income of y. Duclos and Makdissi (2004) utilize the properties of this
function which allows them to define classes of poverty indices . These classes are
defined by
(
y z p ,)
Πs( )
( )
( )
⎭ ⎬ ⎫ ⎩ ⎨ ⎧ = ∀ ≥ ∂ ∂ ∈ = Π i s y z y p C z y p P i i i s s ,..., 2 , 1 0 , 1 -et , : (2)where Cs represents the set of continuous functions s differentiable on
[
. When s=1, an increase in income of any one individual will reduce the poverty index. This class of indices is Paretian which means that all things being otherwise equal, the increase of any one individual’s income can not increase poverty. Moreover, these indices are symmetrical due to the fact that exchanging incomes between two individuals does not affect poverty. This type of income is saidto satisfy the Pen principle (1971). The poverty indices included in
]
a , 0Π2 are also convex. This implies that they respect the Pigou Dalton principle which states that a transfer from one individual to a poorer individual will decrease poverty. Poverty indices belonging to Π3
in addition to the prior stated principles, respect the Kolm principle (1976) which states that a transfer taking place at the bottom of the distribution has a greater impact on poverty then one taking place higher in the distribution. Thus, a progressive transfer occurring in a low part of the distribution will reduce poverty even if it is accompanied by an equivalent regressive transfer higher in the distribution. Indices of this class with s greater then 3 can be interpreted ethically by using the generalized transfer principle proposed by Fishburn and Willig (1984). This principle states that greater the order s, greater is the sensibility of the index to transfers occurring in the lower part of the distribution. This principle implies that at the s=4 order, a pair of transfer combinations which satisfy the Kolm principle where one is progressive in the lower part of the distribution while another is regressive higher in the distribution will reduce poverty. Generalized higher-order transfer principles essentially postulate that, as s increases, the weight assigned to the impact of transfers occurring at the bottom of the distribution also increases. The Foster, Greer and Thorbecke (1984) indices are a particular example of additive poverty measures. Other examples of such indices are given by Chakravarty (1983) and Watts (1968).
Theses indices are in fact a particular case of the second class of poverty indices proposed by Clark, Hemming and Ulph (1981).
2.1 Budgetary impact
Let us assume that the economy consists of K consumption goods. The government wishes to reduce poverty by marginally increasing the subsidy on good i and finance this increase by augmenting marginally the tax (or marginally reduce subsidy) on good j. This reform is therefore implemented within a balanced budget. Let us denote R to indicate the total income incurred by the indirect tax reform. If the population is comprised of I individuals, we have:
, 1
∑
= = K k k kX t I R (3)where Xk represents the average consumption of the good k and tk, the tax imposed on good k
when or the subsidy if . The impact of the marginal reform on total income is
therefore: 0 > k t tk <0 ⎪⎭ ⎪ ⎬ ⎫ ⎪⎩ ⎪ ⎨ ⎧ ⎥ ⎥ ⎦ ⎤ ⎢ ⎢ ⎣ ⎡ ∂ ∂ + + ⎥ ⎦ ⎤ ⎢ ⎣ ⎡ ∂ ∂ + =
∑
∑
= = j K k j k k j i K k i k k i dt t X t X dt t X t X I dR 1 1 (4)Seeing how this reform is constrained by a balanced budget, we can write that dR = 0. Integrating this into the equation (4) produces the following:
∑
∑
= = ∂ ∂ + ∂ ∂ + = ⎟ ⎟ ⎠ ⎞ ⎜ ⎜ ⎝ ⎛ = K k j k k j K k i k k i i j i j t X t X t X t X dt X X dt 1 1 1 1 1 1 où γ γ . (5)Wildasin (1984) describes γ as the differential of the efficiency cost of obtaining one dollar (or any other currency) of public funds by taxing good j to subsidize good i. Yitzhaki and Thirsk (1990) and Yitzhaki and Slemrod (1991) argue that if γ is superior to one, it is impossible to have a second order dominant reform due to the increasing loss incurred by the reform. However, seeing how we are in a poverty analysis perspective, it is possible to have a reform that is dominant at all orders of stochastic dominance with a γ parameter superior to one if the loss cost is supported by the non poor.
2.2 Impacts on poverty
The impact a marginal change of fiscal reform will have on an individual’s share of poverty with an income equal to y is
( )
,( )
,( )
, j. j i i dt t y y z y p dt t y y z y p z y dp ∂ ∂ ∂ ∂ + ∂ ∂ ∂ ∂ = (6)Besley and Kanbur (1988) show that by using Roy’s identity and the current price vector as the vector or reference prices, the change in equivalent income produced by a marginal change of tax on good k results in
( )
y, x t y k k − = ∂ ∂ (7)where xk
( )
y is the Marshalian demand of good k with the current price vector. Introducing equations (5) and (7) into equation (6), we obtain( )
( ) ( )
( )
i i j j i i dt X X y x X y x y z y p z y dp ⎥ ⎥ ⎦ ⎤ ⎢ ⎢ ⎣ ⎡ − ∂ ∂ − = , γ , . (8)To obtain the reform’s impact on poverty, we integrate equation (8):
(
)
∫
( ) ( )
( )
( )
⎥ ⎥ ⎦ ⎤ ⎢ ⎢ ⎣ ⎡ − ∂ ∂ − = a j j i i i i dF y X y x X y x y z y p dt X z F dP 0 , , γ . (9)Knowing that for all income levels (see equation (2)); when xi
( )
y /Xi is greater at all points than( )
, /∂ ≤0 ∂p y z y(
x /j Xj)
γ , there is an unequivocal reduction of poverty. Basing their argument on this premise, Makdissi and Wodon (2002) develop a method which allows for stochastic dominance test to be conducted on indirect tax reforms. They define consumption dominance as follows4 :
4
Multiplying by f ( )y at the first order was introduced by Duclos, Makdissi and Wodon (2006) to implement
( )
( ) ( )
( )
⎪ ⎪ ⎩ ⎪⎪ ⎨ ⎧ > = =∫
− 1 1 0 1 s du u CD s y f X y x y CD y s k k k s k (10)In their article, they present a result that can in the context of this paper be written as:
A marginal reform, carried out in a balanced budget framework by marginally increasing the subsidy of good i and marginally increasing the tax on good j will reduce poverty for all indices whereP∈Πsand all poverty lines where z∈
[ ]
0,z+ if and only if( )
y − CD( )
y ≥0 ∀y∈[ ]
0,z+ .CDis γ sj (11)
2.3 Critical poverty line
If stochastic dominance tests fail at a certain order of dominance, the analyst must choose between two alternatives. First, he may restrain the range of admissible poverty indices by increasing the order of stochastic dominance. Second, he could restrain the maximum poverty
line to z+. A way of limiting the maximum poverty line is to find the critical poverty line s
( )
γz associated to order s and to one value of the economic efficiency parameter,γ . This value of
is the maximum poverty line at which this specific stochastic dominance test is valid. The
maximum poverty line is situated at the first intersection between both curves and is formally defined as:
( )
γ s z( )
{
z CD( )
y CD( )
y y[ ]
z}
zs γ =sup is −γ sj ≥0 ∀ ∈ 0, . (12)2.4 Critical efficiency parameter
Duclos, Makdissi and Wodon (2006) also introduce the concept of critical efficiency parameters when the value of γ is uncertain. If the condition of equation (11) is satisfied at a certain order of dominance and at a certain value ofγ0, it becomes obvious that this will satisfy the equation for all parameter values inferior toγ0. This being said, it is possible to define a critical value γs
( )
z+ associated to the maximum poverty line, z+. This critical value γ occurs when CDis and γCDsj intersect at the maximum poverty line z+. This is defined mathematicallyby
( )
+ ={
( )
−( )
≥ ∀ ∈[ ]
+}
z y y CD y CD z is sj s , 0 0 supγ γ γ . (13)3
Analysis of reforms brought to the food subsidy program
To help alleviate budgetary pressure, the Egyptian government is seeking ways to reduce spending on subsidy programs while maintaining affordable prices for primary food goods for the poor. The objective of this section is not to suggest solutions for the reduction of public spending but to analyze whether the reforms that have undergone the food subsidy program are coherent in a poverty alleviation framework. To do this, we have used the Egypt Integrated Household Survey (EIHS) for 19975.
3.1 Description of the food subsidy program6
It is interesting to note that in 1997, the year of the EIHS survey, the basket of subsidized goods had not yet been affected by the reforms. At the time of the survey, sugar, cooking oil, wheat and bread are subsidized goods. Today, the Egyptian government now subsidizes sugar, cooking oil, macaroni, lentils and beans. These changes were made with the idea of reducing the financial burden of the subsidy program while providing the poor with basic food goods at affordable prices. It therefore becomes appropriate to use this dataset to analyze in retrospect the desirability of the reform and analyze the impact on poverty7.
The food subsidy program operates on the basis of ration cards. To have access to a monthly quota of subsidized sugar and cooking oil, an individual must have a ration card. There exist two types of ration card: green and red. The green cards offer a higher rate of subsidy then red cards. The idea behind the two cards system is to allow better targeting of the poor
5
There exists a micro data survey for 1999 but this survey was only done on a sub sample of the 1997 survey. Moreover, it does not contain all the information required for our analysis. The data was obtained through the intermediary of the International Food Policy Research Institute (IFPRI).
6
Gutner (1999) presents an overview of this reform all while presenting its advantages and inconveniences. Ahmed, Bouis, Gutner and Löfgren (2001) present a revue of all the works that have been done on the analyses of Egyptian subsides. Here, the reader can find a more detailed description of this system and its reforms it has undergone.
7
It has come to our attention that while this article was being written, the Egyptian government modified the food subsidy program’s list of subsidized goods to exclude beans and lentils. As of now, sugar, oil, tea and rice make up the list of subsidized food goods.
population. Ahmed and Bouis (2002) show that an important proportion of rich Egyptians hold green cards while certain poor have none. On average, 72% of the population holds a green card while 10% hold a red card. This distribution remains relatively unchanged regardless of income level. In a recent study by the United Nations World Food Program, experts estimate that 7 million of the poor in Egypt do not have access to the subsidized food program (WTP/MOSIT, 2005). The Egyptian government is currently attempting to make the distribution of cards more equitable.
3.2 Methodology
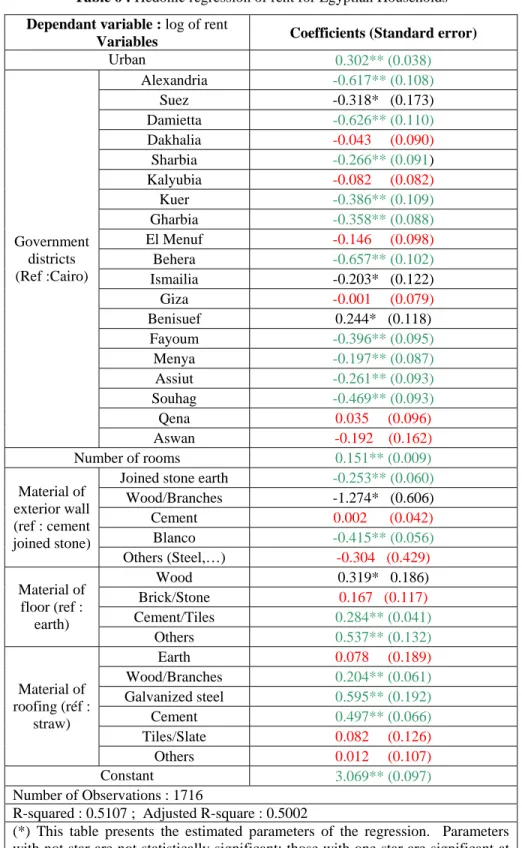
In this paper, total household per capita expenditure is used as a proxy for individual permanent income. This variable is therefore constructed by adding all food and non food expenditures, non durable good expenditures, and the depreciation values of durable goods as well as the rental value for dwelling expenditures8. In regards to dwelling expenditures, to better compare households where individuals are owners with those who are tenants, a hedonic regression of rent was used to impute a value for dwelling expenditures for those who own their dwelling. As Datt, Jolliffe and Sharma (1998) have done, we derived this value by regressing dwelling characteristics on rent paid by tenants and then using the estimates on those who own their dwelling to identify an estimated rental value. Table 6 of the appendix presents the results of this regression. It shows that households living in urban areas pay higher rent then those living in rural areas. Moreover, the capital, Cairo is shown to be the area where rent is greatest, followed by the district of Menya. Northern districts, in particular, Alexandria and Damietta are those with the lowest rent when compared to the capital. In regards to household characteristics, the greater the number of rooms, quality of walls, floors and roofs materials directly translates into higher rent prices.
We proceed by normalizing total household expenditures by a poverty line of 129.19 Egyptian pounds per month. As a result, an individual with a level of normalized total expenditures equal to 1 has a total expenditure equal to the poverty line. When the level of normalized total expenditures is equal to 0.5 or 2, the household is situated at 50% and 200% of the poverty line respectively. This normalization renders tables easier to interpret.
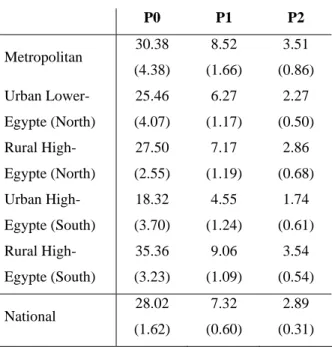
Table 1 presents the Foster, Greer and Thorbecke (1984) class of poverty indicesP0, P1 and P2
8
for Egypt and its five regions.
Table 1 : Poverty levels by region (%)
P0 P1 P2 Metropolitan 30.38 (4.38) 8.52 (1.66) 3.51 (0.86) Urban Lower-Egypte (North) 25.46 (4.07) 6.27 (1.17) 2.27 (0.50) Rural High-Egypte (North) 27.50 (2.55) 7.17 (1.19) 2.86 (0.68) Urban High-Egypte (South) 18.32 (3.70) 4.55 (1.24) 1.74 (0.61) Rural High-Egypte (South) 35.36 (3.23) 9.06 (1.09) 3.54 (0.54) National 28.02 (1.62) 7.32 (0.60) 2.89 (0.31)
Source: EIHS 1997, author’s calculations. Standard
errors are in parenthesis.
Thus, 28.02% of Egyptian households are considered as poor. Both the capital and the rural southern region have the greatest incidence of poverty, 30.38% and 35.36% respectively. The incidence of poverty in other regions are inferior possibly due among other factors to the governments resolve to develop these areas. Also, the northern and southern urban areas, followed by the northern rural area are shown to have the lowest levels of incidence. Similar results were found for the depth and severity of poverty9.
3.3 Analysis of changes brought to the subsidy program
Let us now analyze the various changes the Egyptian government has brought to the list of subsidized goods. To accomplish this, we compare the CD curves of the newly subsidized goods and compare it with goods that are no longer subsidized and then verify if the reform evolves as predicted in our methodology.
9
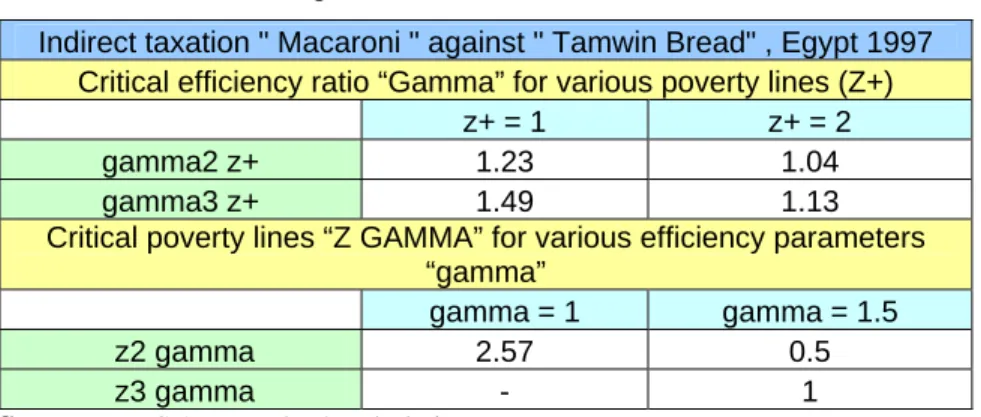
Table 2 : Comparison « macaroni » and « tamwin bread »
Indirect taxation " Macaroni " against " Tamwin Bread" , Egypt 1997 Critical efficiency ratio “Gamma” for various poverty lines (Z+)
z+ = 1 z+ = 2
gamma2 z+ 1.23 1.04
gamma3 z+ 1.49 1.13
Critical poverty lines “Z GAMMA” for various efficiency parameters “gamma”
gamma = 1 gamma = 1.5
z2 gamma 2.57 0.5
z3 gamma - 1
Source: EIHS 1997 author’s tabulation
In Table 2 we present the results of the comparison between “macaroni” and “tamwin bread”. These results suggest that it would be appropriate to tax macaroni to then increase subsidies on tamwin bread. Therefore, this modification to the list of subsidized food goods was not desirable even though the efficiency cost of taxing macaroni is 23% larger then that of tamwin bread. The increase of tax on macaroni would allow for an increased subsidy on tamwin
bread which would result in a reduction of all poverty indices belonging to and all poverty lines equal or inferior to the official poverty line. This result also holds true for all poverty lines inferior or equal to two times the official poverty line if the efficiency cost of taxing macaroni is 4% greater then that of taxing tamwin bread. In fact, if the efficiency costs of taxing both goods are equal, we can consider all poverty lines inferior to 2.57 times the official line. It is important to note that this class of indices includes all indices that are Paretian, symmetrical and respect the Pigou-Dalton aversion to inequality. These three principles are generally accepted by a large majority of analysts’, therefore our results are valid for a wide range of indices. If we wish to
consider indices belonging to the class, the results are even more convincing. Even if we were to consider that the efficiency cost of taxing macaroni is 49% superior to that of taxing tamwin bread, an increase in the taxation of macaroni which in turn would subsidize tamwin
bread would reduce poverty for all indices belonging to the
2
Π
3
Π
3
Π class and also for all poverty lines inferior or equal to the official poverty line. This result also holds true for all poverty lines equal to two times the official poverty line if the efficiency cost of taxing macaroni is 13% superior to that of taxing tamwin bread. In effect, if the efficiency costs of taxing both goods were equal, we can consider for this class of indices every imaginable poverty line up to the maximum income of a seeing how both curves never intersect.
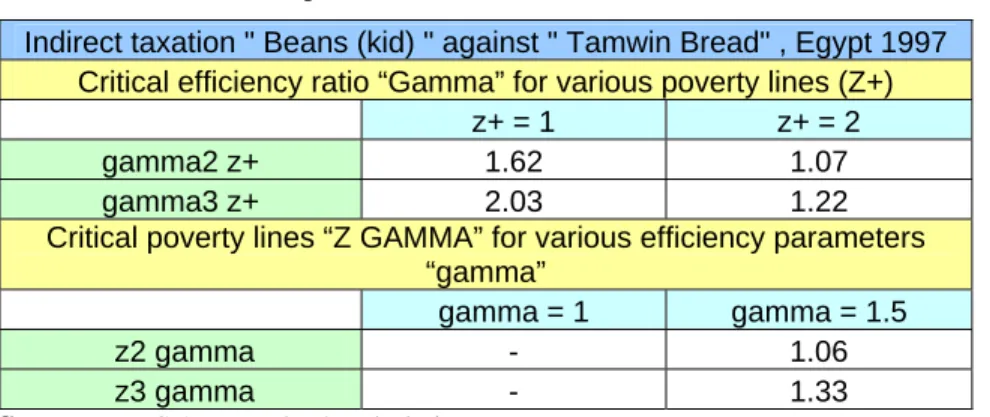
Table 3 : Comparison « beans (kid) » and « tamwin bread »
Indirect taxation " Beans (kid) " against " Tamwin Bread" , Egypt 1997 Critical efficiency ratio “Gamma” for various poverty lines (Z+)
z+ = 1 z+ = 2
gamma2 z+ 1.62 1.07
gamma3 z+ 2.03 1.22
Critical poverty lines “Z GAMMA” for various efficiency parameters “gamma”
gamma = 1 gamma = 1.5
z2 gamma - 1.06
z3 gamma - 1.33
Source: EIHS 1997 author’s tabulation
Table 4 : Comparison «other beans » and « tamwin bread »
Indirect taxation " other beans " against "Tamwin bread" , Égypte 1997 Critical efficiency ratio “Gamma” for various poverty lines (Z+)
z+ = 1 z+ = 2
gamma2 z+ 2.88 1.25
gamma3 z+ 5.87 1.81
Critical poverty lines “Z GAMMA” for various efficiency parameters “gamma”
gamma = 1 gamma = 1.5
z2 gamma - 1.63
z3 gamma - 2.59
Source: EIHS 1997 author’s tabulation
In Table 3 and Table 4, we present the results from the comparison of “beans” and “tamwin bread”. These results suggest that it would be appropriate to tax beans to in turn subsidize tamwin bread. This change in the list of subsidized food goods is once again not a desirable choice since even if the efficiency cost of taxing “kid” beans (resp. other beans) is 62% (resp. 188%) superior to that of taxing tamwin bread, an increase of taxes on beans which would allow for an increase in subsidy of tamwin bread would reduce poverty for all indices belonging to the
class and for all poverty lines equal or inferior to the official poverty line. These results hold true for all poverty lines inferior or equal to two times the official poverty line if the efficiency cost of taxing “kid” beans (resp. other beans) is 7 % (resp. 25%) superior to that of taxing tamwin bread. In fact, if the efficiency costs of taxing both goods were equal, we could consider all poverty lines imaginable up to the maximum income a seeing how both curves never intersect
for both types of beans. Now, if we consider only indices belonging to the class, the results once again are very convincing. Even with efficiency cost of taxing beans is 103% (resp. 487%) greater then that of bread, an increase of taxes on beans to subsidize tamwin bread would result
2
Π
3
in a reduction of poverty for all poverty indices belonging to the Π class and for all poverty 3 lines equal or inferior to the official line. This result remains true for all poverty lines inferior or equal to two times the official poverty line if the efficiency cost of taxing beans is 22% (resp. 81%) greater the taxing tamwin bread.
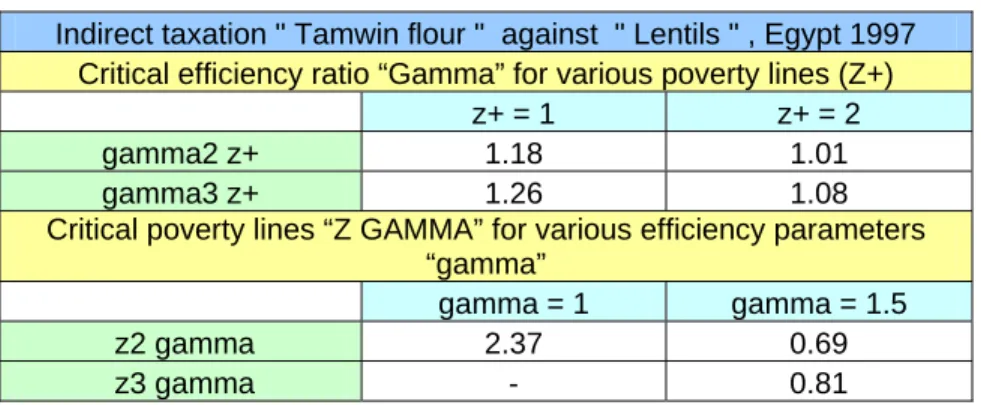
Table 5 presents the results of the comparison between “tamwin flour” and “lentils”.
Table 5 : Comparison « tamwin flour » and « lentils »
Indirect taxation " Tamwin flour " against " Lentils " , Egypt 1997 Critical efficiency ratio “Gamma” for various poverty lines (Z+)
z+ = 1 z+ = 2
gamma2 z+ 1.18 1.01
gamma3 z+ 1.26 1.08
Critical poverty lines “Z GAMMA” for various efficiency parameters “gamma”
gamma = 1 gamma = 1.5
z2 gamma 2.37 0.69
z3 gamma - 0.81
Source: EIHS 1997author’s tabulation
These results suggest that is would be appropriate to tax flour to in turn increase subsidies on lentils. This indicates that replacing tamwin flour with lentils in the list of subsidized food goods was a desirable decision if the objective was to reduce poverty. We note that even if the efficiency cost of taxing flour was 18% greater then that of taxing lentils, a reduction of subsidies on tamwin flour to increase subsidies on lentils would reduce poverty for any poverty
indices belonging to the class and for all poverty lines inferior or equal to the official poverty line. The results hold true for all the poverty lines inferior or equal to two times the official poverty line if the efficiency cost of taxing lentils is 1% greater then that of tamwin flour. In fact, all poverty lines inferior to 2.37 times the official poverty line can be considered if both cost
efficiencies are equal. If we now consider indices belonging to the
2
Π
3
Π class, the results are once again very convincing. Even if the efficiency cost of taxing tamwin flour is 26% greater then that of lentils; a reduction of subsidies designated to flour diverted towards lentils would reduce
poverty for all poverty indices belonging to the Π class and for all poverty lines equal or 3 inferior to the official poverty line. This remains true for all poverty lines inferior or equal to two times the official poverty line if the efficiency cost of taxing tamwin flour is 8% greater then that of taxing lentils.
Looking at these results, we conclude that the Egyptian government should have kept tamwin bread on the list of subsidized goods and should not have added beans and macaroni if it wished to alleviate poverty. However, replacing subsidies on tamwin flour by subsidies on lentils is a coherent policy in regards to poverty alleviation.
4 Conclusion
In this article, we have analyzed the impact specific poverty food subsidy reforms that Egypt have had. We conclude that the changes brought to the list of subsidized food goods have not always been relevant as a tool for fighting poverty. It would be interesting in future works to study the entirety of the Egyptian price system paying attention to both general indirect taxes as well as regulated infrastructure prices. To do this, we could use methodologies proposed by Makdissi and Wodon (2005) who adapt the analysis of CD curves to the analysis of infrastructure sectors. It would also be interesting to study the targeting and allocation properties of current Egyptian poverty reduction policies with such tools as those developed by Duclos, Makdissi and Wodon (2005) who also adapt CD curves to this end.
Reference:
Ahmad, E. and N.H. Stern (1984), The Theory of Reform and Indian Indirect Taxes, Journal of Public Economics, 25, 259-298.
Ahmed, A.U. and H.E. Bouis (2002), Weighing what’s practical: proxy means tests for targeting food subsidies in Egypt, FCND discussion paper NO. 132, International Food Policy Research Institute.
Ahmed, A.U., H.E. Bouis, T. Gutner and H. Löfgren (2001), The Egyptian Food Subsidy System Structure, Performance, and Options for Reform, Research Report 119, International Food Policy Research Institute.
Besley, T. and R. Kanbur (1988), Food Subsidies and Poverty Alleviation, Economic Journal, 98, 701-719.
Chakravarty, S.R. (1983), A New Index of Poverty, Mathematical Social Sciences, 6, 307-313.
Clark, S., R. Hemming and D. Ulph (1981), On Indices for the Measurement of Poverty, Economic Journal, 91, 515-526.
Datt, G., D. Jolliffe and M. Sharma (1998), "A profile of poverty in Egypt: 1997," FCND discussion papers 49, International Food Policy Research Institute (IFPRI).
Duclos, J.-Y. and P. Makdissi (2004), Restricted and Unrestricted Dominance for Welfare, Inequality and Poverty Orderings, Journal of Public Economic Theory, 6, 145-164.
Duclos, J.-Y., P. Makdissi and Q. Wodon (2005), Poverty-Dominant Transfer Programs: The Role of Targeting and Allocation Rules, Journal of Development Economics, 77, 53-73.
Duclos, J.-Y., P. Makdissi and Q. Wodon (2006), Socially-Improving Tax Reforms, mimeo.
Egypt Integrated Household Survey, 1997-1999. 2000. Washington, D.C.: International Food Policy Research Institute (IFPRI)(datasets). " http://www.ifpri.org/data/egypt04.htm "
Fishburn, P.C. and R.D. Willig (1984), Transfer Principles in Income Redistribution, Journal of Public Economics, 25, 323-328.
Foster, J., J. Greer and E. Thorbecke (1984), A Class of Decomposable Poverty Measures, Econometrica, 52, 761-776.
Gutner T. (1999), The Political Economy of Food Subsidy Reform in Egpyt. FCND Discussion Paper No. 77.
Kolm, S.-C. (1976), Unequal Inequlity: I, Journal of Economic Theory, 12, 416-442.
Liberati, P. (2003), Poverty Reducing Reforms and Subgroup Consumption Dominance Curves, Review of Income and Wealth, 49, 589-601.
Makdissi, P. and Q. Wodon (2002), Consumption dominance curves: testing for the impact of indirect tax reforms on poverty, Economics Letters, 75, 227-235.
Makdissi, P. and Q. Wodon (2005), Poverty-Reducing and Welfare-Improving Marginal Public Price and Price Cap Reforms, forthcoming in Journal of Public Economic Theory..
Mayshar, J. and S. Yitzhaki (1996), Dalton Improving Tax Reform, American Economic Review, 85, 793-807.
Pen, J. (1971), Income Distribution. London: Allen Lane, The Penguin Press.
Rasromani, W.K. (2006), Government rethinks food subsidies in light of rising sugar prices, The Daily Star Egypt.
Santoro, A. (2006), Marginal commodity tax reforms: a survey, forthcoming in Journal of Economic Surveys.
Watts, H.W. (1968), An Economic Definition of Poverty, in D.P. Moynihan (ed.), On Understanding Poverty, Basic Books, New York.
WFP/MOSIT (2005), Vulnerability Analysis and Review of Food Subsidy in Egypt.
Wildasin, D.E. (1984), On Public Good Provision With Distortionary Taxation, Economic Inquiry, 22, 227-243.
Yitzhaki, S. and J. Slemrod (1991), Welfare Dominance: An Application to Commodity Taxation, American Economic Review, 81, 480-496.
Yitzhaki, S. and W. Thirsk (1990), Welfare Dominance and the Design of Excise Taxation in the Côte d'Ivoire, Journal of Development Economics, 33, 1-18.
Appendix
Table 6 : Hedonic regression of rent for Egyptian Households Dependant variable : log of rent
Variables Coefficients (Standard error)
Urban 0.302** (0.038) Alexandria -0.617** (0.108) Suez -0.318* (0.173) Damietta -0.626** (0.110) Dakhalia -0.043 (0.090) Sharbia -0.266** (0.091) Kalyubia -0.082 (0.082) Kuer -0.386** (0.109) Gharbia -0.358** (0.088) El Menuf -0.146 (0.098) Behera -0.657** (0.102) Ismailia -0.203* (0.122) Giza -0.001 (0.079) Benisuef 0.244* (0.118) Fayoum -0.396** (0.095) Menya -0.197** (0.087) Assiut -0.261** (0.093) Souhag -0.469** (0.093) Qena 0.035 (0.096) Government districts (Ref :Cairo) Aswan -0.192 (0.162) Number of rooms 0.151** (0.009)
Joined stone earth -0.253** (0.060)
Wood/Branches -1.274* (0.606) Cement 0.002 (0.042) Blanco -0.415** (0.056) Material of exterior wall (ref : cement joined stone) Others (Steel,…) -0.304 (0.429) Wood 0.319* 0.186) Brick/Stone 0.167 (0.117) Cement/Tiles 0.284** (0.041) Material of floor (ref : earth) Others 0.537** (0.132) Earth 0.078 (0.189) Wood/Branches 0.204** (0.061) Galvanized steel 0.595** (0.192) Cement 0.497** (0.066) Tiles/Slate 0.082 (0.126) Material of roofing (réf : straw) Others 0.012 (0.107) Constant 3.069** (0.097) Number of Observations : 1716
R-squared : 0.5107 ; Adjusted R-square : 0.5002
(*) This table presents the estimated parameters of the regression. Parameters with not star are not statistically significant; those with one star are significant at the level of 10% and those with two stars are significant at the 5% level. Standard errors are show in parentheses.