Promoting Pollution Prevention in Small Businesses: Costs and Benefits of the "Enviroclub" Initiative
25
0
0
Texte intégral
(2) CIRANO Le CIRANO est un organisme sans but lucratif constitué en vertu de la Loi des compagnies du Québec. Le financement de son infrastructure et de ses activités de recherche provient des cotisations de ses organisations-membres, d’une subvention d’infrastructure du Ministère du Développement économique et régional et de la Recherche, de même que des subventions et mandats obtenus par ses équipes de recherche. CIRANO is a private non-profit organization incorporated under the Québec Companies Act. Its infrastructure and research activities are funded through fees paid by member organizations, an infrastructure grant from the Ministère du Développement économique et régional et de la Recherche, and grants and research mandates obtained by its research teams. Les partenaires du CIRANO Partenaire majeur Ministère du Développement économique, de l’Innovation et de l’Exportation Partenaires corporatifs Banque de développement du Canada Banque du Canada Banque Laurentienne du Canada Banque Nationale du Canada Banque Royale du Canada Banque Scotia Bell Canada BMO Groupe financier Caisse de dépôt et placement du Québec Fédération des caisses Desjardins du Québec Financière Sun Life, Québec Gaz Métro Hydro-Québec Industrie Canada Investissements PSP Ministère des Finances du Québec Power Corporation du Canada Raymond Chabot Grant Thornton Rio Tinto State Street Global Advisors Transat A.T. Ville de Montréal Partenaires universitaires École Polytechnique de Montréal HEC Montréal McGill University Université Concordia Université de Montréal Université de Sherbrooke Université du Québec Université du Québec à Montréal Université Laval Le CIRANO collabore avec de nombreux centres et chaires de recherche universitaires dont on peut consulter la liste sur son site web. Les cahiers de la série scientifique (CS) visent à rendre accessibles des résultats de recherche effectuée au CIRANO afin de susciter échanges et commentaires. Ces cahiers sont écrits dans le style des publications scientifiques. Les idées et les opinions émises sont sous l’unique responsabilité des auteurs et ne représentent pas nécessairement les positions du CIRANO ou de ses partenaires. This paper presents research carried out at CIRANO and aims at encouraging discussion and comment. The observations and viewpoints expressed are the sole responsibility of the authors. They do not necessarily represent positions of CIRANO or its partners.. ISSN 1198-8177. Partenaire financier.
(3) Promoting Pollution Prevention in Small Businesses: Costs and Benefits of the “Enviroclub” Initiative* Paul Lanoie†, Alexandra Rochon-Fabien ‡ Résumé / Abstract L’initiative des Enviroclubs a été développée par trois agences fédérales – Développement économique Canada pour les régions du Québec, Environnement Canada et le Conseil national de recherche du Canada – et lancée en 2001 pour aider les petites et moyennes entreprises (PMEs) à améliorer leur profitabilité et compétitivité via une meilleure performance environnementale. Un Enviroclub consiste en un groupe de 10 à 15 PMEs impliquées dans des séances de formation en gestion de l’environnement et engagées à mettre en œuvre au moins un projet rentable de prévention de la pollution. L’objectif de cet article est de fournir une analyse coûts-bénéfices de cette initiative originale de façon à éclairer les décideurs publics quant au bien-fondé de tels programmes. Un des plus importants bénéfices sociaux de cette initiative est de réduire les émissions de plusieurs types de polluants, ce qui fait que l’un des défis principaux de cette recherche est de trouver la valeur monétaire de ces améliorations environnementales. Pour ce faire, nous ferons du “transfert de valeurs environnementales” pour obtenir des valeurs qui viennent d’études existantes pertinentes. Nous menons notre analyse à trois niveaux. Premièrement, nous considérons les coûts et les bénéfices pour l’ensemble de la société, ensuite pour les firmes qui participent aux programmes et enfin, pour les instances gouvernementales concernées. Nous concluons que, peu importe la perspective choisie, l’initiative des Enviroclubs s’avère rentable. Mots clés : analyse coûts-bénéfices, PMEs, formation environnementale, performance environnementale. The Enviroclub initiative was developed by three federal government agencies—Canada Economic Development for Quebec Regions, Environment Canada and the National Research Council Canada— and launched in 2001 to assist small and medium-sized enterprises (SMEs) in improving their profitability and competitiveness through enhanced environmental performance. An Enviroclub consists of a group of 10-15 SMEs involved in training sessions on environmental management and carrying out at least one profitable in-plant pollution prevention project. The objective of this article is to provide a cost benefit analysis (CBA) of this original initiative in order to inform policy makers as to the social desirability of such programs. One of the main social benefits of this initiative is to reduce emissions of various pollutants, so that one of our largest challenges is to place a value on these environmental improvements. To do so, we use the “environmental value transfer” method to obtain values from previous relevant studies. We conduct our CBA at three different levels: we consider the costs and benefits first for the whole of society, then from the participating firms’ point of view and, finally, from the governments’ perspective. We conclude that, whichever perspective we choose, the Enviroclub initiative has been highly profitable. Keywords: cost-benefit analysis, SMEs, environment training, environmental performance.. *. The authors wish to thank Gérald Girouard, Rachel Turgeon and François Huppé for providing us with the data, their help in starting this project, and their comments. † HEC Montréal, 3000 Côte Ste-Catherine, Montreal H3L 2T9, et CIRANO, paul.lanoie@hec.ca ‡ HEC Montréal, 3000 Côte Ste-Catherine, Montreal H3L 2T9.
(4) I.. INTRODUCTION. In economics, it is standard to consider that there is room for government intervention in the area of environmental protection. This view relies on a basic paradigm: in general, markets work well to reach an optimal use of scarce resources, so that government intervention is useful only for redistributing revenues, or when markets are no longer fulfilling their role effectively. This is precisely what occurs when one has to deal with environmental problems. One of the prerequisites for the smooth operation of markets is the existence of well-defined ownership rights. In the case of environmental resources available through open access, such as air or clean water, these rights are very difficult to assign. Therefore, because air and water belong to no one (or to anyone), economic agents may use them at zero cost, whereas the actual cost of this use for society as a whole is certainly greater. Polluters receive the wrong signal and, because they use these resources without paying the true price, they are encouraged to do so to excess. Left alone, the market mechanism generates too much pollution, and government intervention is legitimate for reducing it to a tolerable threshold.. To that end, government has traditionally used regulation to set limits on the amount of pollution, or to require specific pollution control technologies. Economists have argued that ―market-based instruments,‖ such as taxation or pollution permits, could be more attractive than regulation.1 These instruments may result in the polluters’ receiving the right signal, once confronted with the true cost of their actions. In short, from this perspective, consideration of the environment is necessarily associated with a cost increase for companies that have previously used environmental resources with impunity.. During the last decade, however, this paradigm has been challenged by a number of analysts (Porter, 1991; Gore, 1993; Porter and van der Linde, 1995). In particular, Porter argues that pollution is often associated with a waste of resources (material, energy, etc.), and that more stringent environmental policies can stimulate innovations that may offset the costs of complying with these policies (this is referred to as the Porter. 1. Green taxes and pollution permits should be preferred over regulation, because they provide incentives for abatement cost minimization and continuous innovation.. 1.
(5) Hypothesis). In other words, firms could be considered ―myopic‖ since they ignore the existence of many ―low-hanging fruit,‖ and government intervention could be useful in helping them identify profitable opportunities. This could be true especially for small and medium-sized firms (SMEs), where daily struggles for survival may push aside environmental issues (CFIB, 2007). Given their particular situation, non-traditional means may be needed to foster pollution prevention among SMEs. The Enviroclub initiative in Canada is a good example of an original measure put in place for such a purpose.. The Enviroclub initiative was developed by three federal government agencies (Environment Canada, the National Research Council Canada and Canada Economic Development for Quebec Regions) and launched in 2001 in the Province of Quebec to assist SMEs in improving their profitability and competitiveness through enhanced environmental performance. An Enviroclub consists of a group of 10-15 SMEs, each of which carries out one profitable pollution prevention project. To support this practical experience, business participants attend four days of workshops on various themes related to environmental performance, spread out over a period of about six months. They also receive the services of a consultant for 90 hours of technical assistance. This consultant analyses the firm’s operations and, after a thorough diagnosis, recommends different in-plant projects to prevent pollution and enhance business performance. Each participating firm is committed to implementing at least one of the recommended in-plant projects. This type of initiative seems fairly original2 and, as such, is worth investigating.. Given the uniqueness of the Enviroclub approach, it is important for policy makers to evaluate its outcome thoroughly. Many specialists will argue that a cost benefit analysis (CBA) is an adequate and comprehensive approach for this purpose (Boardman et al, 2006). The objective of this article is to provide a CBA of the Enviroclub initiative for the period 2001-2007 so that policy makers may see whether such programs are socially desirable. The main costs were the expenses of the three federal agencies, the fee paid by the participating firms and the investments required for the in-plant projects. Among the benefits, there were energy and raw material savings as well as reductions in different polluting emissions. Since these emissions have no market price, one of our 2. In our research, we came across one similar program in Mexico described in Lyon and Van Hoof (2009). Huppé et al (2006) also describe similar initiatives in Austria and South Africa.. 2.
(6) largest challenges was to place a value on them. To do so, we use the ―environmental value transfer‖ method to obtain values from previous relevant studies. We conduct our CBA at three different levels: we consider the costs and benefits first for the whole of society, then from the participating firms’ point of view and, finally, from the governments’ perspective. We conclude that, whichever perspective we choose, the Enviroclub initiative has been highly beneficial. Huppé (2004) produced an exploratory CBA of the first three years of the program, but he did not try to place a value on the environmental benefits of the program, neither did he try to evaluate the costs and benefits from other perspectives than that of society as a whole.. The rest of the paper is organized as follows: Section II briefly describes the Enviroclub initiative. Section III discusses certain methodological considerations. Section IV identifies and monetizes the different costs of the initiative, while Section V is devoted to the benefits. Section VI presents the CBA from the three perspectives mentioned above, and discusses the results of a sensitivity analysis. Finally, Section VII provides concluding remarks. II.. THE ENVIROCLUB INITIATIVE3. Three federal government organizations jointly developed and implemented this pollution prevention program targeting economic returns for SMEs. Given their respective missions, it was natural for them to do so. Environment Canada4 seeks to implement pollution prevention as the main approach to environmental protection (see Canadian Environmental Protection Act, 1999). The National Research Council Canada (NRC) is the Government of Canada’s premier organization for research and development. Its Industrial Research Assistance Program seeks to improve manufacturing processes and productivity through technologies that present higher efficiency in resource and energy use. Canada Economic Development promotes economic development in Quebec. Its Sustainable Development Strategy encourages and helps small businesses to adopt sustainable development practices (CED, 2003).. 3. The beginning of this section is based on Huppé et al (2006). In 2008, Environment Canada and Canada Economic Development withdrew their commitment to the Enviroclub initiative. The program is now under the responsibility of NRC and the Quebec Ministry of Economic Development, Innovation and Exports (MDEIE), whose mission is similar to that of Canada Economic Development. 4. 3.
(7) An Enviroclub is scheduled over a period of 8-10 months and includes: a period of prerecruitment, where a recruiting team is formed; the recruitment phase, when businesses identify in-plant projects and are enlisted to form a club; the implementation phase, which includes the two main features of the clubs: workshops and in-plant projects; and the wrap-up, when results are compiled and the club is assessed.. In general, eligible SMEs must have fewer than 200 employees and are involved primarily in the manufacturing sector. The registration fee is $2,500, and the firms cover the cost of their in-plant pollution projects.. An Enviroclub includes workshops undertaken over four non-consecutive days. The main topics covered are: ▪. pollution prevention as a driver of competitiveness and profitability;. ▪. selecting and implementing profitable pollution prevention projects;. ▪. energy efficiency and greenhouse gas (GHG) emissions;. ▪. environmental emergencies;. ▪. environmental management systems;. ▪. environmental performance as a marketing and communication tool.. Consultants are hired to provide 90 hours of technical assistance to SMEs (paid for by the Enviroclub), helping them to identify, design and implement their in-plant projects. The participating firm is committed to putting in place at least one of the recommended in-plant projects.. Most in-plant projects seek to introduce pollution prevention practices and technologies that relate to product or service changes and improvement, process or technology improvement, input or raw material changes, operating improvements, or on-site reuse and recycling. Such projects must increase the SME’s economic profits, or improve its competitiveness and export capability by opening new export markets. They must generate environmental benefits through reduced emissions of toxic and priority. 4.
(8) substances, as well as substances on Canada’s National Pollutant Release Inventory, and reduction in GHG emissions, ozone-depleting substances and acid rain precursors. Alternatively, projects can reduce the consumption of input materials, natural resources or energy. A few projects were also aimed at implementing an environmental management system (EMS) within the firm. For these projects, we have the costs involved, but it was very difficult to identify the exact benefits.. Between 2001 and 2007, 22 clubs were created in the different administrative regions of Quebec. These clubs involved 277 SMEs. When our database was completed, 211 firms had completed the program, implementing 216 in-plant projects. The distribution of firms by industrial sector is provided below, as well as the number of in-plant projects implemented per year and the distribution of the types of projects.. TABLE I: INDUSTRIAL SECTOR OF FIRMS HAVING IMPLEMENTED A PROJECT Type of industry Textile Machinery, parts and transportation equipment Wood, paper and furniture Mineral and metal processing Food and beverage Chemicals and plastics Other Total. Number of firms 17 18 54 45 29 28 25 211. TABLE II: DISTRIBUTION OF PROJECTS BY YEAR. Year 2001 2002 2003 2004 2005 2006 2007 Total. Number of projects 13 11 37 35 45 28 47 216. 5.
(9) TABLE III: TYPES OF PROJECTS. Types of projects 1) Pollution prevention (P2) - Improvement in operations - Improvement in process or technology - On-site re-use or recycling - Improvement in product or service - Substitution of product or service - Change in inputs or raw materials 2) Environmental management system - Other - Action and implementation plan - Employee training plan. III.. Number of projects 198 88 66 22 10 8 4 18 14 3 1. METHODOLOGICAL ISSUES. In a cost-benefit analysis (CBA) of an activity, project or policy or, as in this case, a program, one seeks to find out whether the program is welfare-improving for the whole of society, i.e., whether it generates more benefits than costs. A CBA generally involves four main steps. First, one has to identify the costs and benefits induced by the program. Second, one has to monetize all the costs and benefits so as to compare them on the same basis. Third, the costs and benefits must be expressed in dollars of the same year (discounted), since a dollar today is worth more than a dollar in the future. Fourth, one has to perform a sensitivity analysis to assess how the conclusion of the analysis is sensitive to certain assumptions one has to make throughout the study.. In our case, a certain number of issues were raised at each step. First, when identifying the benefits of the program, we faced the difficulty of establishing the number of years the benefits would occur. For instance, in most cases, in-plant projects have led to reduced use of material, reduced energy consumption, reduced emissions, etc., and these reductions are most likely to occur in more than one year. There are very few. 6.
(10) arguments justifying a specific number of years, so that we have to use certain scenarios. We do not have the age of the firms involved in the Enviroclub initiative, but we know that they are likely to be fairly mature companies which have passed the ―survival threshold‖ where many new ventures fail and go bankrupt. Indeed, new firms are not likely to be concerned by ―less crucial‖ issues, such as environmental protection. In our cases, firms are likely to be long-lived, as are the benefits from in-plant projects. As in Huppé (2004), we set our base case at seven years, but we also look at three other scenarios: 5, 10 or 15 years.. Second, in monetizing costs and benefits, one has to refer to the real opportunity costs of inputs or resources. This implies that the analysis has to abstract from, as far as possible, any taxes, subsidies or interferences that affect the price mechanism.5 Therefore, in our calculations, when considering the price of certain resources, such as energy or materials, we took away taxes or subsidies whenever feasible.. Third, of course, the main issue in monetizing the benefits is placing a value on the reduction of polluting emissions, since these are not priced by the market. There is now a vast literature on methods for valuing non-market goods, such as the quality of the environment, leisure time, or health and safety. The methodologies involved include revealed preference methods and contingent valuation.6 As will be seen below, we will be dealing with nine different types of emissions, and it would be beyond the scope of this research to conduct an original study to determine the value of each of these nine types of emissions in the context of Quebec. We will thus use the environmental value transfer method, transferring environmental value estimates from previous studies. As discussed in Spash and Vatn (2006), it is legitimate to do so when one can find highquality studies covering similar environmental goods carried out in a similar geographical and institutional context. We will rely mainly on recent American studies published in peer-reviewed journals. For GHG emissions, the range of estimates is fairly broad, and we will use a lower and upper bound in our calculations.. Fourth, the choice of a discount factor can always be controversial. We will follow the recommendation of the Treasury Board of Canada, and use a real discount rate of 8% 5 6. For a complete discussion on this issue, see Boardman et al (2006), chapter 4. See Tietenberg (2007), chapter 3 for a complete discussion.. 7.
(11) with an interval of +2% and –2%.7 Fifth, as discussed above, our sensitivity analysis will allow the duration of benefits to vary, as well as the discount rate and the price of GHG emissions.. IV.. THE COSTS. There are four main categories of costs involved in this program. First, we have the administrative costs covered by the three agencies involved in the program. These were estimated by Huppé (2004) and extrapolated for the following years. Second, there are expenses related to the promotion of the program and the recruitment of participants. After discussion with program leaders, these expenses were estimated at $350,000 per year. Third, the $2,500 fee paid by the participants has to be included, plus the amount paid to the consultants for their technical assistance (90 hours on site). Finally, the costs involved in the in-plant projects were estimated and reported by all participants; they represent about 80% of total costs. The next table reports the total costs of the program for the period 2001-2007. In general, we feel fairly confident about these figures, so that we do not perform a sensitivity analysis on that side of the equation.. 7. http://www.powerauthority.on.ca/sites/default/files/page/7846_J7.3_Att_1_Excerpt_Canadian_CostBenefit_Analysis_Guide.pdf. 8.
(12) TABLE IV: SUMMARY OF COSTS IN 2000 CONSTANT DOLLARS. (I). (II). (III). (IV). (V). CED, EC and NRC salaries and expenditures. Total cost of implemented projects (including grants, membership fees and capital investment). Total cost of projects not implemented (membership fees ($2,500) + cost of consultant 8 ($9,000)). Total costs. $107,300.61 $104,940.00 $102,081.71 $162,189.11 $165,835.51 $166,141.15 $166,843.05. $278,812.84 $580,039.63 $3,985,634.75 $2,199,812.12 $2,995,346.02 $2,515,900.57 $2,346,483.21. $56,088.96 $10,971.00 $160,082.68 $52,392.55 $10,253.27 $150,838.68 $186,949.78. $2,236,595.12 $975,331.16 Implementation subtotal: $3,211,926.27. $14,902,029.14 Project subtotal: $15,529,606.06. $627,576.92. Enviroclub solicitation and promotional costs. Year. Pre2001 2001 2002 2003 2004 2005 2006 2007 20012007. $341,411.04 $333,900.00 $324,805.45 $318,911.17 $312,056.07 $306,049.50 $299,461.88. V.. $783,613.45 $1,029,850.63 $4,572,604.59 $2,733,304.95 $3,483,490.88 $3,138,929.90 $2,999,737.92 $18,741,532.33. THE BENEFITS. As shown in Table V below, there are three main categories of benefits from the in-plant projects: i) energy savings; ii) raw material savings; and iii) reduction in polluting emissions. This last category can be subdivided into three sub-categories: atmospheric emissions, water effluents and wastes. The first two categories (energy and raw material savings) provide direct benefits to the firms involved in the program, while the third provides benefits to society as a whole. Table V provides the energy and raw material savings as well as the emissions reductions in quantities, and the following discussion presents the ―price‖ chosen for monetizing each category of benefits.. 8. Costs incurred for firms which participated in the program but did not implement in-plant projects.. 9.
(13) In terms of energy, quantities of electricity and of various fossil fuels (natural gas, propane, diesel, etc.) were saved through the in-plant projects. To price the quantities of fossil fuels, we use the average yearly price in Quebec as provided by MJ Ervin & Associates,9 and we subtract taxes. For electricity, we refer to the M rate used by HydroQuebec for medium-sized firms.10. Second, raw materials were saved, especially wood and water (on average 1.3 million cubic metres per year). Other types of raw materials have also been saved, such as plastic or steel, but they are not documented in our database. The wood price we chose is the least expensive one: the average annual "softwood lumber, Toronto green‖ composite price (MRNF, 2007). Regarding water price, we use the only study available on the valuation of water for industrial purposes (Dachraoui and Harchaoui, 2004). Their estimate is $0.55 (C$, 1996) per cubic metre, which is not far from the price charged by Quebec municipalities using water meter systems ($0.51 per cubic metre, Environment Canada, 2008). Third, polluting emissions were reduced in three areas: atmospheric emissions, water effluents and waste (hazardous and domestic). Five types of air pollutants were affected by the in-plant projects: particulate matter (PM2.5 and PM10); nitrogen oxides (NOx); sulphur oxides (SOx), volatile organic compounds (VOC), and greenhouse gases (GHG). There is no market price for the first five types so, as mentioned above, we use the environmental value transfer method. In fact, our prices for these pollutants come from Muller and Mendelsohn (2007). This American study is the most sophisticated exercise we have encountered on this topic. The authors use a simulating model, the Air Pollution Emissions Experiments and Policy (APEEP) analysis, to value the marginal damages associated with air pollution. These damages include impacts on agriculture, forests, ecosystems, buildings and human health. A particularly relevant aspect of this study is that it provides values for rural and urban areas and, not surprisingly, the value is much higher (often twice as much) in urban areas, see Table VI below.. 9. http://www.mjervin.com The price of heavy oil comes from Transport Canada (2007). http://www.hydroquebec.com/business/moyen/tarif-affaires.html. 10. 10.
(14) TABLE V: SUMMARY OF NON-CUMULATIVE ANNUAL SAVINGS. Category. Energy. Type Electricity Natural gas Propane Gasoline Diesel. Unit MWh. 2001 -. 2002 655. 2003 -476. 2004 493. 2005 2,167. 2006 1,994. 2007 1,587. Total 6,421. L L L L. 30,969 20,400 68,265. 321,500 219,000 -. 1,683,131 76,175 114,700. 727,752 169,237 2,610. 318,692 37,870 105,302. 1,190,126 187,686 96,487. 363,073 198,332 202,228. 4,635,243 888,300 20,400 589,592. L. 6,000. -. -. 1,642. 301,674. 41,750. 58,300. 409,366. Heavy fuel oil Wood Water Other GHG VOC PM10 SOx NOx Volume Hazardous. L 3 m 3 m kg T kg kg kg kg 3 m kg. 1,000 1,450 7,354 2,183 5,180 122 343 3,029 1,450 500,000. 45,881 229 950 35,033 56 37 900 -. 13,500 10,306 401,076 1,508,472 13,420 5,883 2,104 814 7,644 394,557 198,200. 453,719 42,937 1,772 51,627 105 50 1,664 359,141 28,800. 38,337 79,164 4,203,847 10,084 4,464 330 1,466 5,130 78,776 78,526. 598,864 2 333,928 222,966 4,788 427 984 13,875 9,754 333,800 9,178. 354 13,168 213,042 1,821 889 867 1,167 13,309 12,032 12,459. 612,364 49,998 1,328,386 6,198,847 35,019 103,503 4,568 17,752 41,430 1,179,756 827,163. Nonhazardous. kg. 1,594,500. -. 11,087,800. 282,021. 4,594,755. 94,702. 27,217,833. 44,871,612. Light fuel oil. Raw materials. Atmospheric emissions. Effluents Waste. 11.
(15) TABLE VI: MARGINAL COST OF POLLUTANTS ACCORDING TO MULLER AND MENDELSOHN (2007)11. Source of emissions 2002 US$ Urban Rural. PM2.5 kg/yr $3.30 $1.10. PM10 kg/yr $0.50 $0.20. NOx kg/yr $0.30 $0.30. SO2 kg/yr $1.50 $0.90. COV kg/yr $0.50 $0.30. We use the rural values, since most companies in our sample are in rural or semi-rural regions. Following the principles for value transfer from Spash and Vatn (2006), overall, the Muller and Mendelsohn study is quite satisfying. It is of very high quality (published in the Journal of Environmental Economics and Management), it evaluates exactly the pollutants we need, and the geographical and institutional contexts are similar (especially for rural areas). Actually, Hahn and Cecot (2009), in their cost benefit analysis of ethanol production, also use results from Muller and Mendelsohn (2007). For GHG emissions, we refer to two meta-analyses. On one hand, Tol (2008) examines 200 estimations in 47 different studies. In doing so, he gives less weight to older studies and those published in less well-known publications.12 He ends up with a value of $23 per ton (US$, 1995). The Intergovernmental Panel on Climate Change – IPCC (2007) provides a value for a ton of GHG based on about 100 estimates published in peerreviewed journals. They end up with a value of $11 per ton (US$, 2004). As these two. 11. The database compiles particulates differently from Muller and Mendelsohn (2007). In fact, Enviroclub. compiled PM10s as being particles with a diameter of less than 10 microns, so this classification includes both PM10s and PM2.5s. In order to place a value on PM10s as identified in Enviroclub, we take the average of the two prices as estimated in the Muller and Mendelsohn (2007) study. All the prices in the table are in 2002 U.S. dollars. 12. Dionne and Lanoie (2004) apply a similar method to suggest a representative value of a statistical life.. 12.
(16) values are fairly different, to be cautious, we will use $11 per ton in our base case, and we will conduct a sensitivity analysis using the figure from Tol (2008). Regarding water effluents, we found no North American studies providing us with the value of these emissions. As a proxy, we took the abatement cost of the Montreal wastewater treatment plant, the largest in Quebec: $0.054 per cubic metre (C$, 2001).13 It was not possible to obtain data for each wastewater treatment plant associated with each company in our sample. Finally, emissions of hazardous and domestic wastes were reduced. As in the case of water effluents, we are forced to use the abatement cost as a proxy. In Quebec, the public agency in charge of waste management, reuse and recycling, Recyc Quebec, estimates that the average cost of treating hazardous waste, such as paint, oil and grease, is $2,000 per tonne.14 For domestic waste, the Quebec Department of Sustainable Development, Environment and Parks has estimated that the average cost of using landfill sites is $53 per tonne (MDDEP, 2008). As discussed in Tietenberg (2007), abatement or replacement cost is generally a lower bound of an environmental value.. 13. In addition, the Montreal plant probably enjoys economies of scale, since Statistics Canada (2009) indicates an average cost in Canada of around $0.09 per cubic metre. 14 www.recyc-quebec.gouv.qc.ca. 13.
(17) TABLE VII: SUMMARY OF BENEFITS FOR THE PERIOD 2001-2007. Summary of annual savings in 2000 constant dollars Year: Electricity. Energy. Atmospheric emissions. Raw materials. Effluents. 2001 MWh. Natural gas. L. Propane. L. Gasoline. L. Diesel. L. Light fuel oil. L. Heavy fuel oil. L. GHG. T. VOC. Kg. PM10. Kg. SOx. Kg. NOx. Kg. Wood. m. 2002 -. 7,528.09 -. 2003. 2004. 2005. 2006. 2007. Total. 15,559.26. (10,994.59). 11,266.92. 49,460.02. 47,785.11. 38,163.86. 151,240.57. 80,910.36. 465,311.39. 245,350.30. 121,754.94. 466,848.36. 81,575.96. 1,469,279.39. 113,290.12. 41,955.46. 93,216.61. 20,911.46. 106,785.94. 117,654.46. 493,814.04. 8,031.39. -. 30,125.22. -. 2,499.13. -. -. 47,686.64 -. -. -. -. 8,031.39. -. 1,241.88. 62,734.50. 60,443.28. 127,348.14. 329,579.65. 778.75. 178,192.07. 25,062.28. 35,682.11. 242,214.33. 3,187.22. -. -. 75,060.18. 32,672.31. 461,394.20. 60,924.89. 346,700.48. 2,328.24. 15,745.05. 2,644.23. 23,202.87. 2,006.11. 118.70. 54.13. 2,048.89. 102.36. 321.74. 462.05. 50.36. 1,097.05. 67.96. 1,975.98. 1,361.48. 404.41. 3,435.33. 747.89. 2,305.59. 174,511.02. 177,698.24. 62,611.61. 1,203,966.63. 192.02. 399.72. 46,518.23. 958.24. 844.57. 4,448.64. 18,707.78. 1,573.44. 23,934.62. 4,383.72. 5,981.63. 18,620.06. 241.81. 50,140.21. 7,136,555.47. 164,602.96. 3. Water. m3. Volume. m3. Hazardous. kg. Non-hazardous. kg. Waste. 148,821.95. -. 1,320,344.28. -. 5,617,007.21. 855.81. 27,079.60. 236,720.56. 267,791.18. 46,723.96. 197,088.74. 7,771.82. 784,031.66. 76.38. -. 20,783.23. 18,917.68. 4,149.51. 17,582.86. 633.79. 62,143.46. 836,108.68. -. 331,433.48. 48,159.86. 131,312.96. 15,347.61. 20,834.16. 1,383,196.74. 73,896.53. -. 513,860.08. 13,070.18. 212,942.27. 4,388.93. 1,261,400.62. 2,079,558.60. 14.
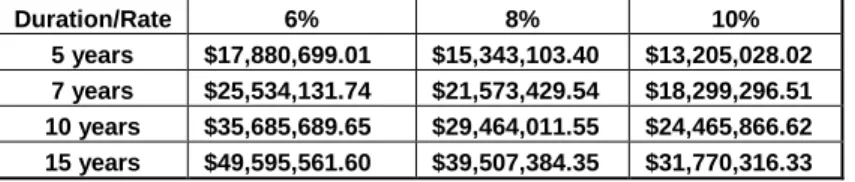
(18) VI.. THE COST-BENEFIT ANALYSIS. As we mentioned in the introduction, we will present a cost-benefit analysis from society’s point of view, participating firms’ point of view and the governments’ perspective. In our base case scenario, the discount rate is 8%, we expect the benefits to last seven years and we consider a price of GHG emissions of $11 per tonne (US$, 2004). We provide the results in constant Canadian dollars of 2000. Table VIII presents the base case scenario as well as our sensitivity analysis, allowing the discount rate and the period during which benefits are recorded to change.. TABLE VIII: SOCIAL PROFITABILITY. Duration/Rate. 6%. 8%. 10%. 5 years. $45,339,319.92. $39,529,220.11. $34,602,256.33. 7 years. $61,515,904.57. $52,751,129.54. $45,460,360.61. 10 years. $82,821,027.06. $69,377,261.20. $58,509,648.55. 15 years. $111,686,559.02. $90,304,962.47. $73,797,205.65. The net present value (NPV) for the base case is strongly positive at $52,751,129.54. Not surprisingly, since the benefits continue to occur after the costs are incurred, a lower discount rate places relatively more weight on the benefits and results in a higher NPV, while a higher discount rate results in a lower NPV. Of course, when the period of time for which benefits are recorded is longer, the NPV rises, and vice versa. Finally, we look at the base case scenario when the value of CO2 emissions is set at $23 (US$, 1995) according to Tol (2008). In line with our expectations, the NPV is higher, at $56.2 M (C$, 2000) in our base case, when we give a higher value to CO2 emissions. Overall, it seems that the Enviroclub program has been highly profitable for Canadian society. Even in the most pessimistic cases (high discount rate, shorter period of benefits), the profitability is still fairly strong. We now compute the NPV from the participating firms’ point of view. In this case, the main private expenses are the contribution of $2,500 to the program and the investments in the in-plant projects. The main private benefits are the savings in energy. 15.
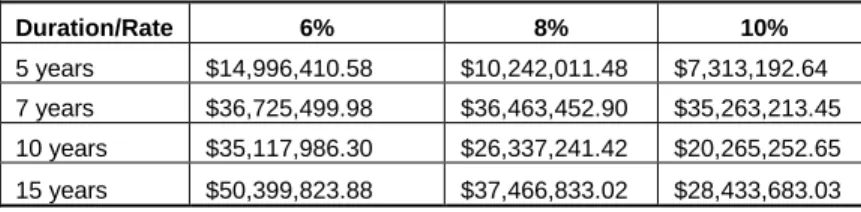
(19) and raw materials.15 Actually, in terms of raw materials, we only include wood. Since most Quebec municipalities do not charge for water, any reduction in the use of water does not really mean firms’ cashflow is improved. We present the base case scenario as well as the sensitivity analysis. In this case, since the value of the CO2 emissions is not relevant, we do not consider it in the sensitivity analysis.. Once again, the NPV is fairly high, at more than $21 M in our base case scenario. The same patterns as those discussed above are observable when we allow for changes in the discount rate or the period of benefits. Given the nature of the Enviroclub program, which places the emphasis on profitable and competitiveness-enhancing in-plant projects, this result is not surprising. It suggests, as often mentioned in the literature on environmental management (Ambec and Lanoie, 2008; Porter and van der Linde, 1995), that there are many ―low-hanging fruit‖ around.. TABLE IX: ORGANIZATIONAL PROFITABILITY Duration/Rate 5 years 7 years 10 years 15 years. 6% $17,880,699.01 $25,534,131.74 $35,685,689.65 $49,595,561.60. 8% $15,343,103.40 $21,573,429.54 $29,464,011.55 $39,507,384.35. 10% $13,205,028.02 $18,299,296.51 $24,465,866.62 $31,770,316.33. Finally, from the governments’ point of view, the main costs are the expenses for the recruitment of enterprises in the program, the cost of the consultant and the administrative expenses, while the main benefits are the reduction in polluting emissions and water consumption. Furthermore, from a fiscal point of view, when firms save on energy and raw materials, fewer taxes are collected by government, but when these firms make more profits by saving on these items, they pay more taxes on their business income.. The following table presents our base case scenario and the sensitivity analysis. Not surprisingly, the NPV is also strongly positive from the government point of view in the. 15. One also has to take into account the extra tax to be paid by firms when their expenses are reduced and their profits increased.. 16.
(20) base case scenario at $36.5 M (C$, 2000), as well as in the sensitivity analysis. When the value of CO2 is set at a higher level according to Tol (2008), the NPV goes up to $39.2 M (C$, 2000) in our base case.. This suggests that an innovative program like Enviroclub can be more efficient than traditional command and control regulations in dealing with SMEs’ environmental performance. Overall, this suggests that the program has created a win-win situation for both the governments and the firms.. TABLE X: GOVERNMENT PROFITABILITY Duration/Rate. VII.. 6%. 8%. 10%. 5 years. $14,996,410.58. $10,242,011.48. $7,313,192.64. 7 years. $36,725,499.98. $36,463,452.90. $35,263,213.45. 10 years. $35,117,986.30. $26,337,241.42. $20,265,252.65. 15 years. $50,399,823.88. $37,466,833.02. $28,433,683.03. CONCLUSION and DISCUSSION. The objective of this article was to provide a cost benefit analysis of the Enviroclub initiative. This program was developed by three federal government agencies—Canada Economic Development for Quebec Regions, Environment Canada and the National Research Council Canada—to assist small and medium-sized enterprises in improving their profitability and competitiveness through enhanced environmental performance. An Enviroclub consists of a group of 10-15 SMEs involved in training sessions on environmental management and carrying out at least one profitable in-plant pollution prevention project.. 17.
(21) After describing the program, we identified and monetized its principal costs and benefits. The costs were related mainly to the expenses of the three federal agencies, the fee paid by the participating firms and the investments required for the in-plant projects. Among the benefits, there were energy and raw material savings, as well as reductions in different polluting emissions. Since these emissions have no market price, one of our largest challenges was to place a value on them. For this purpose, we used the ―environmental value transfer‖ method to obtain values from previous relevant studies.. We conducted our CBA at three different levels. We considered the costs and benefits first for society as a whole, then from the participating firms’ point of view and, finally, from the governments’ perspective. We concluded that, whichever point of view we chose, the Enviroclub initiative has been highly profitable.. In general, we consider that our estimates are fairly conservative and our results probably represent a lower bound of the actual net benefits. We may be underestimating the net benefits in at least five ways. First, some firms participated in the program in late 2006 and in 2007, but had not completed their in-plant projects by the time our database was compiled. For these firms, we have some of the costs in our data but no benefits. Second, we did not account for the benefits from the environmental management system (EMS) projects since their specific outcome was very difficult to identify. These EMSs are likely to have led to some changes, such as reductions in energy use and waste. Third, in terms of raw materials, we accounted only for wood and water, while other types of inputs were saved but not documented. Fourth, some projects resulted in a better quality of life in the plant through less dust, less noise or better air quality, but we were not able to quantify those aspects. Finally, given the positive outcome of most inplant projects, it is quite likely that many SMEs learned a lot from their participation in the program and have implemented other projects that were not accounted for in the data.. From a policy perspective, this paper raises a certain number of questions. First, it shows that the traditional ―command and control‖ regulatory approach can be very well complemented by other voluntary approaches, especially for SMEs. Indeed, while traditional regulation may be an option with a small number of large enterprises, there is a limit on the resources that regulatory bodies can put into enforcement in the face of. 18.
(22) tens or hundreds of thousands of potential small businesses requiring regulation. Second, it shows that information and training is still lacking for improving SMEs’ environmental performance. Facing daily struggles to survive, SMEs are likely to have little time or expertise and few resources to devote to environmental issues. The fact that many opportunities to reduce polluting emissions and costs at the same time were missed shows in a very eloquent manner that environmental issues are simply not well understood by SME managers. Any effort to provide them with more information and expertise on best practices should be welcome. Third, in the same vein, this paper shows policy makers that it is possible to reduce pollution without major costs for firms, in line with the Porter Hypothesis. The empirical evidence on the Porter Hypothesis is controversial (for instance, see Lanoie et al, 2011), but most previous research has been conducted using mainly data on large firms. To our knowledge, this is probably the first paper to suggest that the Porter Hypothesis may be more relevant for SMEs than for larger enterprises. This question warrants further research.. 19.
(23) REFERENCES Ambec, S.; Lanoie, P. (2008). ―Does it Pay to be Green? A Systematic Overview,‖ Academy of Management Perspectives, 22(4), November, 45–62.. Boardman, A.E,; Greenberg, D.H.; Vining, A.R.; Weimer, D.L. (2006). Cost-Benefit Analysis Concepts and Practice, 3rd Edition, Upper Saddle River, NJ, Pearson / Prentice Hall, 560 p.. Canada Economic Development (2003). Sustainable Development Strategy.. Dacharoui, K. and Harchaoui, T.M. (2004). Water Use, Shadow Prices and the Canadian Business Sector Productivity Performance, Economic Analysis (EA) Research Paper Series, Micro-economic Analysis Division, Statistics Canada, 28 p. Dionne, G. and Lanoie, P. (2004). ―Public Choice About the Value of a Statistical Life for Cost-Benefit Analyses: The Case of Road Safety,‖ Journal of Transport Economics and Policy, 38, 247–74.. Environment Canada (2008). 2008 Municipal Water Pricing Report, Ottawa. Canadian Federation of Independent Business – CFIB (2007). Achieving Eco-prosperity: SMEs’ perspectives on the environment, Toronto, 37 p.. Gore, A. (1993). Earth in the Balance: Ecology and the Human Spirit, New York: Penguin, 1993. Hahn, R. and Cecot, C. (2009). ―The Benefits and Costs of Ethanol: An Evaluation of the Government’s Analysis,‖ Journal of Regulatory Economics,35 (June), 275–95. Huppé, F (2004). Coûts et bénéfices de l’initiative Enviroclub, période allant de la fin 1990 à 2003-04, mimeo, Environment Canada.. 20.
(24) Huppé, F.; Turgeon, R.; Ryan, T.; Vanasse, C. (2006). ―Fostering Pollution Prevention in Small Businesses: the Enviroclub Initiative,‖ Journal of Cleaner Production, (14) 563– 571. Intergovernmental Panel on Climate Change – IPCC (2007). Summary for Policymakers, in Climate Change 2007: Impacts, Adaptation and Vulnerability, contribution of Working Group II to the Fourth Assessment Report of the Intergovernmental Panel on Climate Change. Lanoie, P.; Laurent-Lucchetti, J.; Johnstone, N.; Ambec, S. ―Environmental Policy, Innovation and Performance: New Findings on the Porter Hypothesis,‖ forthcoming in Journal of Economics and Management Strategy.. Lyon, T.; Van Hoof, B. (2009). Evaluating Mexico’s Green Supply Chains Program, mimeo, University of Michigan (August). Ministère du Développement Durable, de l’Environnement et des Parcs (2008). Augmentation de la redevance à l’élimination, mimeo.. Ministère des Ressources Naturelles et de la Faune (MNRF), Direction du développement de l’industrie des produits forestiers, Portrait statistique Février 2007. Muller, N. and Mendelsohn, R. (2007). ―Measuring the Damages of Air Pollution in the United States,‖ Journal of Environmental Economics and Management, pp. 1-14. Porter, M. (1991). ―America’s Green Strategy,‖ Scientific American, 264(4), 168. Porter, M. and C. van der Linde (1995). ―Toward a New Conception of the EnvironmentCompetitiveness Relationship,‖ Journal of Economic Perspectives, 9(4), 97–118. Spash, C.L and Vatn, A. (2006). ―Transferring Environmental Value Estimates: Issues and Alternatives,‖ Ecological Economics, 379–88.. Tietenberg, T. (2007). Environmental Economics and Policy, 5th Edition, Boston, Pearson, Addison Wesley. 538 p.. 21.
(25) Tol, R.S.J. (2008). ―The Social Cost of Carbon: Trends, Outliers, and Catastrophe,‖ Open-Assessment E-Journal, 2(25), 1–24. Transport Canada (2007). Transportation in Canada: An Overview, Transport Canada, addenda.. 22.
(26)
Figure
Documents relatifs
For the analysis of rAAV vectors produced in in- sect cells, the internal normalizer was prepared by admixing DNA species found in rAAV preparations in proportions comparable to
7: (Color online) Double differential e + e − pair yield from semi-leptonic decays of heavy flavor as simulated by pythia and mc@nlo. The p T intervals are indicated in
Working with a new participatory modelling method with two groups of dairy farmers, each constituted by farmers both converting and converted to organic farming, we built two
after 60 min. The heat flux values measured by the heat flux meters installed on the mast are shown in Figure 11.. Average Room and Window Opening Temperatures... Temperatures
A Maxwell’s fisheye lens, 30 on the other hand, is a kind of GRIN lens that can focus the wave from a point source on the edge of the lens to another point on the opposite edge of
already at 80 ° C and dissolved in boiling water. The difference in membranes’ behavior can be explained by the different molec- ular structures of the polymers. The nitrile
Results suggest that to balance the objectives of promoting domestic gas consumption through use in electricity production, provide affordable electricity to consumers
A., Luminescent probes based on water-soluble, dual-emissive lanthanide complexes: metal ion-induced modulation of near-IR emission. J., Reversible redox modulation of a
