Product, Process and Organizational Innovation: Drivers, Complementarity and Productivity Effects
44
0
0
Texte intégral
(2) CIRANO Le CIRANO est un organisme sans but lucratif constitué en vertu de la Loi des compagnies du Québec. Le financement de son infrastructure et de ses activités de recherche provient des cotisations de ses organisations-membres, d’une subvention d’infrastructure du Ministère du Développement économique et régional et de la Recherche, de même que des subventions et mandats obtenus par ses équipes de recherche. CIRANO is a private non-profit organization incorporated under the Québec Companies Act. Its infrastructure and research activities are funded through fees paid by member organizations, an infrastructure grant from the Ministère du Développement économique et régional et de la Recherche, and grants and research mandates obtained by its research teams. Les partenaires du CIRANO Partenaire majeur Ministère du Développement économique, de l’Innovation et de l’Exportation Partenaires corporatifs Banque de développement du Canada Banque du Canada Banque Laurentienne du Canada Banque Nationale du Canada Banque Royale du Canada Banque Scotia Bell Canada BMO Groupe financier Caisse de dépôt et placement du Québec Fédération des caisses Desjardins du Québec Gaz Métro Hydro-Québec Industrie Canada Investissements PSP Ministère des Finances du Québec Power Corporation du Canada Raymond Chabot Grant Thornton Rio Tinto State Street Global Advisors Transat A.T. Ville de Montréal Partenaires universitaires École Polytechnique de Montréal HEC Montréal McGill University Université Concordia Université de Montréal Université de Sherbrooke Université du Québec Université du Québec à Montréal Université Laval Le CIRANO collabore avec de nombreux centres et chaires de recherche universitaires dont on peut consulter la liste sur son site web. Les cahiers de la série scientifique (CS) visent à rendre accessibles des résultats de recherche effectuée au CIRANO afin de susciter échanges et commentaires. Ces cahiers sont écrits dans le style des publications scientifiques. Les idées et les opinions émises sont sous l’unique responsabilité des auteurs et ne représentent pas nécessairement les positions du CIRANO ou de ses partenaires. This paper presents research carried out at CIRANO and aims at encouraging discussion and comment. The observations and viewpoints expressed are the sole responsibility of the authors. They do not necessarily represent positions of CIRANO or its partners.. ISSN 1198-8177. Partenaire financier.
(3) Product, Process and Organizational Innovation: * Drivers, Complementarity and Productivity Effects Michael Polder †, George van Leeuwen ‡, Pierre Mohnen§, Wladimir Raymond**. Résumé / Abstract Nous estimons un modèle dans lequel la recherche-développement (R-D) et l’investissement en technologies de l’information et de la communication (tic) déterminent trois types d’innovation (de produit, de procédé, et organisationnelle), lesquels influencent à leur tour la productivité. Nous trouvons que l’investissement en tic facilite l’innovation tant dans le secteur manufacturier que dans celui des services. Faire de la R-D a un effet positif sur l’innovation en produit dans le secteur manufacturier. L’effet le plus important sur la productivité provient de l’innovation organisationnelle. Les deux autres types d’innovation n’augmentent la productivité que s’ils sont accompagnés d’innovation organisationnelle. Cette dernière est complémentaire à l’innovation de procédé. Mots clés : Innovation, ICT, R&D, productivité.. We propose a model where both R&D and ICT investment feed into a system of three innovation output equations (product, process and organizational innovation), which ultimately feeds into a productivity equation. We find that ICT investment and usage are important drivers of innovation in both manufacturing and services. Doing more R&D has a positive effect on product innovation in manufacturing. The strongest productivity effects are derived from organizational innovation. We find positive effects of product and process innovation when combined with an organizational innovation. There is evidence that organizational innovation is complementary to process innovation. Keywords: Innovation, ICT, R&D, productivity. Codes JEL : L25, O30-033.. *. The views expressed in this paper are those of the authors and do not necessarily reflect any policy by Statistics Netherlands. We thank Jacques Mairesse for helpful suggestions and making available the programming code of Robin and Mairesse (2008). The paper has benefited from comments by Eric Bartelsman, Emmanuel Duguet, Stéphane Robin and the participants at conferences/seminars in Dijon (JMA, June 2009), Nuremberg (ASIGO, May 2009), The Hague (Statistics Netherlands, May 2009), Jena (April 2009), University Paris II (ERMES, February 2009). Errors are our own. † Statistics Netherlands, Den Haag (NL). ‡ University of Maastricht, Maastricht (NL). § UNU-MERIT, Maastricht (NL) and CIRANO, Montreal (CA). ** Corresponding author: [email protected], tel. +31 70 337 51 38..
(4) 1. Introduction Innovation is considered to be a key driver of productivity growth. The introduction of new goods and services, as well as novelties in methods of production and non-technological aspects as management practices and marketing, allow firms to improve efficiency. There is much empirical research on the contribution of various instances of innovation on productivity and, moreover, on what in turn are the drivers of innovation. Despite sharing a clear common ground, it seems that there are roughly two separate strands of literature to be distinguished: one strand dealing with R&D driven technological innovation, and another strand that seeks to explain productivity differences from organizational changes propagated by the use of information technology. In this paper we aim to provide a more encompassing empirical description of the innovation process in firms, by combining elements from both strands of literature. In the pioneering work by Griliches (1979), the production function is augmented with R&D to account for the fact that knowledge, and the generation thereof, contributes to the output of a firm. Crépon, Duguet, and Mairesse (CDM, 1998) extended this insight to a distinction between innovation input (e.g. R&D) and innovation output (i.e. knowledge). The idea is that innovation input (research effort, and sources of knowledge) leads to the generation of knowledge, which may manifest itself in new products and improved production methods, and is put to use in the production process. Since the seminal contribution by CDM, many studies have confirmed the positive impact of innovation on productivity at the firm level. Examples of such studies include Lööf and Heshmati (2002) and Van Leeuwen and Klomp (2006). As in CDM, the focus in most of these studies is on product innovation, the main reason being that this type of innovation is the only one for which a quantitative output measure is readily available (e.g. the share of innovative products in total sales or patent data). However, as mentioned above and recognized in current innovation surveys, there are various other types of innovation, such as process innovation, organizational innovation and marketing innovation. Changes in organization and in particular its combination with investment in information technology is the topic of empirical work by e.g. Brynjolfsson and Hitt (2000), Black and Lynch (2001) and Brynjolfsson et al. (2006). In their work, information technology enables organizational investments (business processes and work practices), which in turn lead to cost reductions and improved output and, hence, productivity gains. Investment in information. 2.
(5) and communication technology (ICT)1 can therefore be considered as a separate input into the innovation process, which can lead to new services (e.g. internet banking), new ways of doing business (e.g. B2B), new ways of producing goods and services (e.g. integrated management) or new ways of marketing (e.g. electronic cataloguing).2 Besides the emphasis on the complementarity between ICT and changes in the organization of the firm, there is evidence that the use of ICT also has a positive effect on product innovation and productivity (Van Leeuwen, 2008). In this paper, we bring together the insights from both the work on R&D and technological innovation, as well as from that on organizational innovation and ICT. We extend the CDM framework to include three types of innovation (product, process, and organizational innovation),3 and ICT as an additional innovation input besides R&D. This is one of the first studies to include three types of innovation as well as modeling ICT as an enabler of innovation. The plan is as follows. In section 2, we briefly review some related literature on the effects of various types of innovation on productivity and the role of ICT. In section 3 we outline our model and estimation strategy. In section 4 we describe the data and the main variables, whereas in section 5 we present the estimation results and various robustness checks. Section 6 concludes and gives directions for further research. 2. Related literature The CDM model has been estimated on firm data originating from innovation surveys in OECD and non-OECD countries (see e.g. Chudnovsky et al. 2006 for an overview). The models differ by the types of innovation that are considered, the modeling of their interactions, the use of quantitative or qualitative innovation indicators, and the econometric meth-. 1. In this paper we will look at ICT rather than IT, as communication technology is also likely. to be of importance for improving both innovative capabilities and productivity. Bloom et al. (2009) show that information technology and communication technology are associated with different types of organizational change. 2. Murphy (2002) provides an overview of examples of organizational change, documenting. its relation with ICT and evidence of its effect on firm performance. 3. Besides organizational innovation, innovation surveys generally regard marketing innova-. tion as another type of non-technological innovation. Due to the short time dimension for this variable in our dataset, we shall not consider it in our analysis. 3.
(6) ods used to account for simultaneity and selectivity. In this brief survey, we shall focus on two generalizations of the original CDM model, namely the introduction as separate innovation outputs of process and organizational innovations, and the introduction of ICT as a separate innovation input. The former are readily available in the innovation surveys, the latter requires merging the innovation survey data with data from ICT surveys. Moreover, we discuss some related literature on the importance of ICT and the role of organizational innovation. Given that productivity gains are related to production efficiency and factor saving, it can be argued that an analysis of the productivity effects of innovation that focuses exclusively on product innovation is too restrictive. However, due to the lack of continuous output measures it is not straightforward to extend the model to other types of innovation. For product innovations most of the time it is the share of total sales that are due to innovative products that is used to measure the intensity of innovation, or alternatively the number of patents. For other types of innovation (process, organizational), it is usually only observed whether a firm has performed the innovation or not. Griffith et al. (2006, henceforth GHMP) use the binary indicators for product and process innovation in the augmented production function as measures of innovation output in a study for four countries: France, Germany, Spain, and the UK. They estimate by two separate probits the propensities of their occurrence, and use those to replace the product and process dummies in the augmented production function to control for their possible endogeneity. Robin and Mairesse (2008) for France adjust the GHMP model slightly by estimating the knowledge production function as a bivariate probit, which allows to calculate the propensity of performing both a product and a process innovation together in addition to the probabilities of performing them separately. This term can be used to assess the possible complementarity between the two types of innovation. For manufacturing, GHMP only find a positive significant effect for process innovation in France; in the other countries it is insignificant. Product innovation, on the other hand, has a positive significant effect in all countries but Germany. For France, Robin and Mairesse find positive effects for product and process innovation separately, and also for their combined occurrence. Their findings hold for both the manufacturing and the services sector. Roper et al. (2008) use binary indicators for product and process innovation, as well as a mix of a continuous measure for product innovation and a binary decision variable for process innovation. Based on the Irish Innovation Panel (IIP), they find no significant effect of both types on productivity when using the binary specification. They find a significant negative 4.
(7) effect for product innovation when using the continuous measure of innovation success.4 This is interpreted as a possible disruption effect. The authors do not control for potential endogeneity, because they argue that ‘the recursive nature of the innovation value chain suggests that innovation output measures are necessarily predetermined’ (op. cit. p. 964). Mairesse et al. (2006) compare the effects on TFP of various (quantitative and qualitative) product and process innovation indicators, introducing them individually and controlling for their endogeneity by estimating the respective models by Asymptotic Least Squares. Contrary to Roper et al. (2008), they find a higher impact for process than for product innovation. Strikingly, however, they find no significant impact only when the endogeneity innovation output is not controlled for. For Italy, Parisi et al. (2006) find a positive effect for process innovation and not for product innovation using instrumental variable estimation. Schmidt and Rammer (2007) find a positive impact of combined technological (product and/or process) and non-technological (organizational and/or marketing) on the profit margin of firms, mainly due to the combination of organizational and product innovation. However, according to their study, technological innovation has a bigger effect on the profit margin without non-technological innovation. From this overview, it appears that there is at least some degree of heterogeneity in the findings about the importance and direction of product, process and organizational innovation, and their combination. With respect to the role of ICT, our work is closely related to that of the Eurostat ICT impacts project (see Eurostat, 2008). Because data on ICT investment are not available in the survey on ICT use, this international micro-data study proposes to use other metrics such as the share of PC enabled personnel, the adoption of broadband and e-commerce variables as indicators for firm-level ICT-intensity. The study reveals that – on average – ICT usage is positively related to firm performance. The strength of these results varies over countries, however, and it also appears that the benefits of different types of ICT usage are industry specific. Broadband use seems to be associated with a capital deepening effect (that is, the use of broadband is indicative of a larger stock of ICT capital), whereas electronic sales shows a true efficiency effect. Van Leeuwen (2008, Chapter 12 of the Eurostat report) incorporates the broadband and e-commerce variables into the standard CDM model (with innovation output represented. 4. Since their productivity measure is value added per employee, and capital intensity is con-. trolled for, their result may be viewed as a total factor productivity (TFP) effect. 5.
(8) by innovative sales per employee). It is shown that e-sales and broadband use affect productivity significantly through their effect on innovation output. Broadband use only has a direct effect on productivity if R&D is not considered in the model as an input to innovation. As regards ICT, the model used in this paper can be seen as a modification and extension of the model in Van Leeuwen (2008). Another line of literature motivates the importance of ICT for organizational innovation in particular, see e.g. Brynjolfsson and Hitt (2000), Black and Lynch (2001), and Bresnahan et al. (2002). Case studies reveal that the introduction of information technology is combined with a transformation of the firm, investment in intangible assets, and a change in the relation with suppliers and customers. Electronic procurement, for instance, increases the control of inventories and decreases the costs of coordinating with suppliers. In addition, ICT offers the possibility for flexible production: just-in-time inventory management, integration of sales with production planning, et cetera. A lack of proper control for intangible assets seems to be the answer to the famous remark by Solow that one can find ICT everywhere but in the productivity statistics. In addition, a lack of investment in intangible assets is seen as a possible candidate for explaining the differences in productivity growth that are observed between Europe and the US. The available econometric evidence at the firm level shows that a combination of investment in ICT and changes in organizations and work practices facilitated by these technologies contributes to firms’ productivity growth. More evidence on this relation is provided by Crespi et al. (2007). Using CIS data for the UK, they find a positive effect on firm performance of the interaction between IT and organizational innovation, but not for the individual variables. They also find a significant effect of competition on organizational innovation. 3. Model The modeling approach follows GHMP and RM, who use an augmented CDM model to incorporate product as well as process innovation. We extend their model to include an equation for ICT as an enabler of innovation and organizational innovation as an indicator of innovation output. Quantitative as well as qualitative data are used to model innovation inputs, whereas only qualitative information is used for innovation outputs. We measure productivity as value added over employment. Controlling for the capital/labor ratio in the productivity equation, the remaining terms can be interpreted as explaining total factor productivity.. 6.
(9) 3.1. Innovation inputs: R&D and ICT We distinguish two types of innovation inputs: R&D expenditures and ICT investment. We measure R&D investments by the total of intramural and extramural R&D expenditures. This variable is subject to selectivity, however. The question is only asked to firms with a completed/ongoing/abandoned product and/or process innovation, whereas non-innovating firms can also invest in R&D (e.g. when investing in physical capital for R&D purposes in the period covered by the survey, while the actual innovation project did not commence in this period). In addition, the variable may be censored because innovators may not always report or may underestimate R&D (e.g. when it is performed by workers in an informal way). Furthermore, only continuous R&D performers that stated to have positive R&D expenditures are used in the estimation. In analogy to R&D, we use the investment in ICT as a measure for ICT input. There are many periods in which firms do not report investment in ICT, so in fact ICT investment is also a censored variable. Again, this variable is subject to censoring, as firms that do not report investment may in fact still have positive ICT input, e.g. through own-account development which is not recorded as investment.5 For both indicators, we therefore have a certain number of zero values and missing observations. To model this pattern of zero/missing and positive observations, we use a type II tobit model, see Amemiya (1984). For R&D we have a dichotomous variable d R that takes value 1 when R&D is observed and 0 otherwise. We associate to d R a latent variable d R* such that (1). d R = 1 when d R* = α 1′w1t + η1t > 0 and d R = 0 otherwise.. Likewise for ICT we have a dichotomous variable d ICT to which we associate a latent vari* such that able d ICT. (2). * d ICT = 1 when d ICT = α 2′ w2t + η 2t > 0 and. d ICT = 0 otherwise.. 5. In addition to ICT investment we use broadband access and the use of e-commerce as addi-. tional ICT input variables in the innovation output equation. These variables are not censored or subject to selectivity, and we treat them as exogenous. 7.
(10) The amount of R&D, measured by (the log of) R&D expenditures per employee, and denoted by rt is related to another latent variable rt* such that (3). rt = rt* = β1' x1t + ε1t when d R = 1 and zero otherwise.. Likewise, the amount of ICT, measured by (the log of) ICT investment per employee, and denoted by ICTt is related to a latent variable ICTt* such that (4). ICTt = ICTt* = β 2' x2t + ε 2t when d ICT = 1 and zero otherwise.. We drop the firm subscript to avoid notational clutter. For year t, wjt and xjt (j = {1,2}) are vectors of exogenous explanatory variables some of which may be common to both vectors. Each pair of random disturbances η1t and ε1t , and η2t and ε 2t , is assumed to be jointly iid normally distributed. For reasons of symmetry we use the same explanatory variables in the selection equation for ICT as for R&D (i.e. w1t = w2t). Besides dummy variables for industry and size, we used the following common variables in the two selection equations: a dummy variable for being part of an enterprise group, and a dummy variable referring to the dependence on foreign markets. To model the amount of R&D and ICT (thus, x1t = x2t), we use the variables used in the selection equation and add a dummy for cooperation in innovative activities and dummies for various types of financial support. Equations (1) and (3) and (2) and (4) are estimated by maximum likelihood. From the (selectivity corrected) estimations of the intensity equations, we calculate predictions for the latent R&D and ICT investments, which feed into the innovation output equations. As in GHMP, the predictions are also calculated for the firms with zero investments.6 Thus, it is assumed that all firms have a certain amount of (possibly unobserved) research effort and/or ICT investment. 3.2. Innovation outputs: product, process and organization. Innovation input leads to innovation output, also known as ‘knowledge production’. In this study, we consider three types of innovation, namely product, process and organizational innovations. The three innovation equations are given by (5a). 6. pdtt* = β3′x3t + ε3t. When predicting R&D and ICT we assume that there is no cooperation and no sources of. funding for non-innovators, i.e. we set these variables to zero for these firms. 8.
(11) (5b). pcst* = β4′x4t + ε4t. (5c). orgt* = β5′x5t + ε5t. where x3 to x5 include the predictions of the innovation input variables from the equations (3) and (4). As with innovation inputs, the levels of generated knowledge are latent. In this case, we only observe whether a firm had a certain type of innovation or not.7 Let I(⋅) denote the indicator function, which equals 1 if the condition is true and 0 if not, and pdtt. = I(pdtt* > 0) = I(ε3t < β3′x3t ),. pcst. = I(ε4t < β4′x4t), orgt = I(ε5t < β5′x5t ), εt = (ε3t,ε4t,ε5t)′ ~ N(0, ),. where pdt, pcs and org are the dummy variables corresponding to the event that a firm has respectively a product, process, or organization innovation. Then the three-equation system is a trivariate probit model. It can be estimated by simulated maximum likelihood using the GHK simulator (see Train, 2003). Besides reflecting the assumption that also firms that do not report investment have a certain amount of research effort or ICT investment, the advantage of using predictions for innovation input is that we are able to use the whole sample. This means that the number of observations is increased and selectivity bias is circumvented. In addition, at least if all explanatory variables in the R&D and ICT equations are exogenous, endogeneity of the innovation inputs is controlled for. Following GHMP and RM, we construct propensities for each possible combination of innovation type, and include these as proxies for knowledge in the augmented production function. Standard errors of the estimates are computed by bootstrapping. Following van Leeuwen (2008), we include broadband intensity and e-commerce variables as instances of ICT input in the knowledge equation, to capture the application and degree of sophistication of ICT.8 3.3. Production function. Finally, we estimate an augmented production function to determine the semi-elasticities of productivity with respect to dichotomous innovation output measures. The estimating equation is. 7. For product innovation, we also observe the percentage of total sales due to innovative. products. To treat the three types of innovation in the same manner, however, we also restrict the measurement of product innovation to a binary variable. 8. We treat the ICT usage variables as exogenous to innovation output. In section 5.4 we check. the robustness of our results to this assumption by including year t-1 instead of year t values. 9.
(12) (6). VAt/Lt = [. ijk. βijk I(pdt = i, pcs = j, org = k)] + β6′x6t + ε6t ,. (i,j,k ∈ {0,1}). where VAt/Lt is the log of value added over firm size in fte, and x6 are additional explanatory variables including capital intensity and firm size. We use I(0,0,0) as a reference category. Thus, there are seven dummies reflecting the different combinations of innovation types: (0,0,1), (0,1,0), (0,1,1), …, (1,1,1). Since these innovation output measures are latent and endogenous, they are replaced by predictions from the trivariate probit in section 3.2.9 We control for the endogeneity of capital and labour using the estimation algorithm by Olley and Pakes (1996). 4. Data. The data used in this exercise are sourced from different surveys at Statistics Netherlands, which are linked at the firm level. The sample includes firms in the manufacturing sector (NACE 15 to 37) as well as the services sector (NACE 50 to 93).10 The innovation variables are sourced from the Community Innovation Survey (CIS). We pool the 2002, 2004, and 2006 editions (also referred to as respectively CIS 3.5, CIS 4 and CIS 4.5). Information on ICT usage comes from the Business ICT (E-commerce) survey. Investment in ICT is taken from the Investment Statistics (IS). Finally, production data (production value, factor costs, and employment) are taken from the Production Statistics (PS). We use price information at the lowest available level from the Supply and Use tables (AGT); this results in deflators at a mixed 4-digit and 3-digit NACE levels. Our definitions of the different innovation types follow those in the innovation survey. Thus, product innovation is defined as a new or (significantly) improved good or service. Process innovation is defined as a significantly improved method of production or logistics, or supporting activities such as maintenance and operations for purchasing, accounting, or computing. Finally, organizational innovations include the introduction of new business practices, knowledge management systems, methods of workplace organization (i.e. system of decision making), and management of external relations. In all cases, the innovation needs to be new. 9. The predictions correspond to the propensities for the respective combinations. Since these. add up to one, it is necessary to use one combination as a reference category to avoid perfect collinearity. Note that replacing the actual (latent) innovation output variables with predictions is in line with the original CDM approach. 10. We exclude NACE 73, the commercial R&D sector. 10.
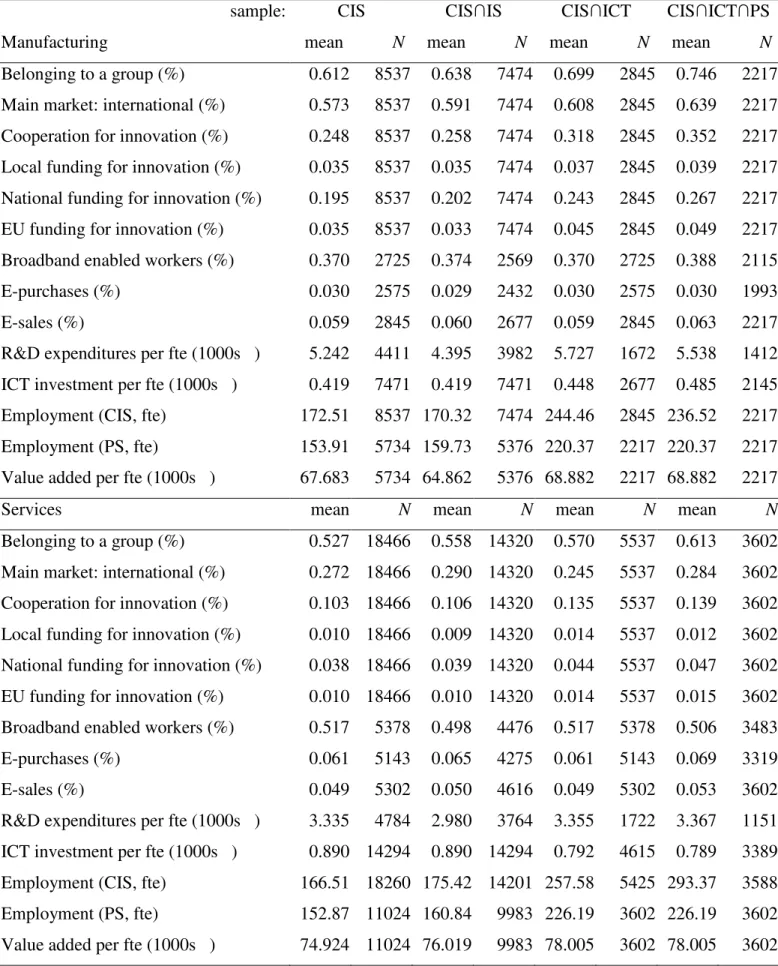
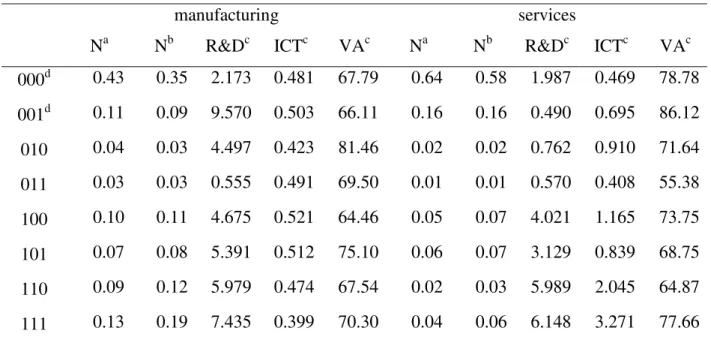
(13) to at least the firm, and may be developed by the firm itself or by another enterprise (or in collaboration). For each of these innovation types, the CIS provides information on whether a firm stated to have performed such an innovation or not in the three-year period ending in the year preceding the survey (for example, the CIS 2006 is carried out in 2007 and concerns the period 2004 to 2006). Table 1 gives the summary statistics by sector for the key variables used in the analysis, for the different samples used in different equations in the main analysis. The R&D equation only uses CIS data; the ICT equation uses IS and CIS; the knowledge production function uses CIS and ICT data; finally, the TFP equation uses PS, CIS and ICT (the latter two only via the predicted propensities).11 The overall impression is that the means of the variables are pretty much in line in the various samples. Based on the employment variables, however, it seems that crossing the CIS with the E-commerce survey leads to a bias towards larger firms. This is not surprising since the sampling frame of the latter survey is relatively small, and smaller firms are less likely to be sampled in all surveys, so that in crossing data sets these firms have a higher probability to drop out. There are, however, some differences between manufacturing and services. Firms in the services sector are much less likely to have their main market abroad. They also cooperate less in innovative activities, and less firms receive funding. On the other hand, services firms have a higher intensity of broadband use. While R&D expenditures per worker are substantially lower than in manufacturing, they also invest more in ICT. Thus, compared to firms in manufacturing, services firms appear to be more domestically oriented, relying relatively more on ICT and private funding for innovation. Table 2 shows the distribution of possible combinations of innovation types by sector, both from the CIS and for the production function sample. For the latter sample, also averages for R&D and ICT investment, and value added are reported. Overall, the manufacturing sector seems more innovative: here 43% of the firms report not to have been innovative, against 64% in the services (this category does include firms with an ongoing or abandoned innovation project, however). Most of the innovators in services only have an organizational innovation, however, and this combination has even a higher share than in manufacturing. For the. 11. In the robustness analyses of our results we also use different (sub)samples, for example. the R&D survey for information on t−1 R&D expenditures and information on investment in fixed capital goods from the Investment Statistics in the estimation of the production function following the method by Olley and Pakes (1996). 11.
(14) other combinations the services sector has a lower score, especially for the one where all types of innovation are involved, which accounts for 13% of the observations in manufacturing (CIS sample), but only 4% for services.12 From the averages by combination of innovation types, we see that a clear relation between productivity and a specific type of innovation or the number of innovations cannot be deduced. Nor do these figures reveal a correlation between R&D or ICT with firm performance. 5. Results. In this section, the estimation results of the augmented CDM model are presented. Since one may expect that the importance of innovation modes can differ between industries, we present the estimation results separately for manufacturing and services.13. 12. One could be concerned with the ability of firms to dissociate process and organizational. innovations. Crespi et al. (2007), for example, worry that (what firms mark as) process innovation in fact incorporates ‘disembodied’ reorganization such as contracting out, new working methods etc. Greenhalgh and Rogers (2010, ch. 1) include organizational innovation in their definition of process innovation. In this case one would expect that firms would tick the boxes for both process and organizational innovation. The distribution of innovation mode combinations suggests that this is not a big problem in our data. A quick calculation shows that for the observations involving process or organizational innovation in manufacturing (services), they only occur together in one third (one sixth) of the observations. This suggests that firms do not view these types of innovation as the same thing. In addition, the correlation in the CIS sample between process and organizational innovation is 0.27, which is in fact lower than the correlations between product and process and between product and organizational innovation. Finally, some care has been taken in the survey to caution the respondents not to include organizational changes in the question on process innovation (the closing sentence of the question reads “Exclude purely organizational innovations”). 13. Industry differences may also be present within manufacturing and services. As far as this. concerns industry specific averages, those are controlled for by industry dummies. Due to the smaller number of observations it is not possible to allow for varying effects of the variables of interest for the different sub-industries. 12.
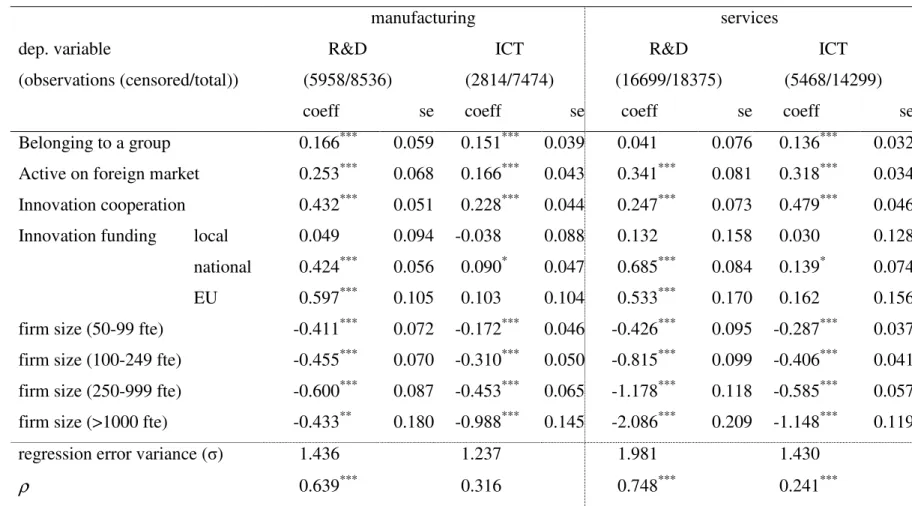
(15) 5.1. Innovation input. Table 3a presents the estimation results for the R&D – (1) and (3) – and ICT – (2) and (4) – equations. Marginal effects are reported. For example, the marginal effect of belonging to a group on R&D intensity in manufacturing is 0.166, so (the log of the) R&D intensity is 16.6% higher when a firm is part of a group than if not..All variables are significant without many differences in the results by sector, the only exception being the dummy for being part of a group and some of the dummies for financial support. EU funding is insignificant in the ICT equations, and national funding only marginally significant. Local funding does not seem to play a role for both the R&D and ICT decisions. The finding that financial support for innovation is less important for ICT, suggests that firms invest in ICT for more than reasons of innovation alone. This can be understood by the fact that ICT is an instance of a ‘general purpose technology’, and innovation support is not needed to motivate ICT investment. Moreover, ICT can be bought easily, and is less plagued by uncertainty and less than R&D subject to a market failure for financing because of asymmetric information. The positive sign of the indicator for being part of a group in manufacturing could reflect that those firms may benefit from better internal access to finance, knowledge, or other synergies that facilitate the possibility to perform R&D or to invest in ICT. However, in services being part of a group has no effect on R&D. Firms that cooperate on innovation do more R&D. We also find that firms are likely to spend more on ICT when cooperating on innovation activities, which can be understood by the fact that communication possibilities are vital in this case. In addition, we find a positive sign of the indicator for foreign activities, which reflects that competing in a foreign market requires firms to be innovative and, because trading partners are located at a greater distance, communication possibilities become more important.14 Finally, we find that overall a higher size is associated with lower R&D and ICT intensities.. 14. Vice versa, innovative firms may be more likely to enter into foreign markets, receive. funding, et cetera, so that one should be careful with drawing conclusions about causality. This also raises the issue of whether the indicators could be endogenous to R&D and/or ICT. We do not pursue this possibility here however, so by assumption, the variables are considered to be exogenous. 13.
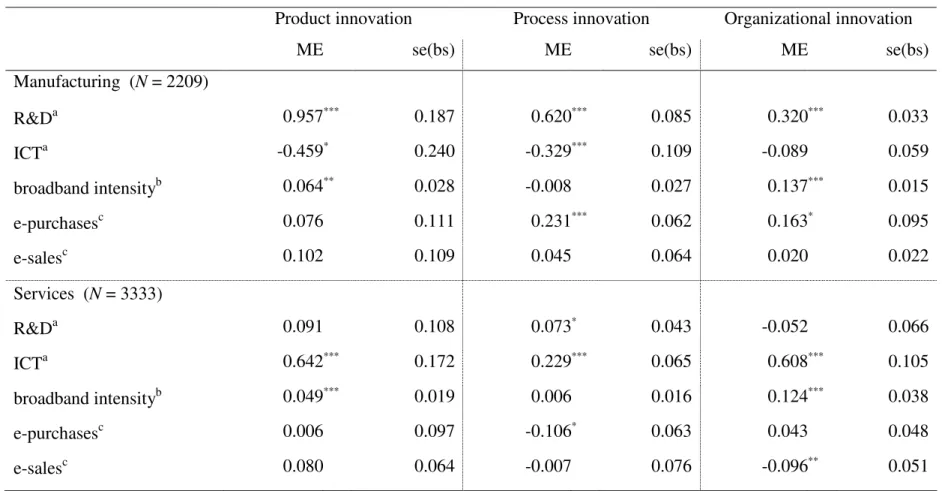
(16) 5.2. Innovation output. Results for the knowledge production function are reported in table 3b. The indicators for knowledge are the binary variables indicating whether a firm had a particular type of innovation in a certain year. The three-equation system is estimated as a trivariate probit, accounting for the mutual dependence of the error terms.15 R&D and ICT investment are replaced by their predictions based on equation (2) and (4), also for firms having missing or zero values for these variables, reflecting that those firms may well have innovation input (i.e. R&D and ICT input are considered to be latent). The use of predicted variables makes the usual standard errors invalid. Therefore, we also report bootstrapped standard errors and use them to judge the significance of the estimated coefficients.16 We find that for the predicted variables in the knowledge production equation the bootstrapped standard errors are substantially larger than the usual standard errors. For the other control variables this is not the case. The results reported in table 3b are the marginal effects on the probability of performing the pertinent innovation. For example, if in services (log) ICT investment increases by 1%, the probability of a process innovation increases by 0.41%. The corresponding standard errors are calculated by bootstrapping. The technical details of these calculations are described in Appendix A.17 In line with most of the CDM literature, we find that R&D contributes positively to product innovation in manufacturing. By contrast, it is unimportant for product innovation in services, and for process and organizational innovation in both sectors. Thus, R&D appears to be. 15. The estimation routine is adopted from the Stata program by Antoine Terracol. We set the. number of draws for the maximum likelihood simulator (‘GHK’, Geweke-HajivassiliouKeane) to 50. Experimentation with setting the number of draws to 25 and 100 gives approximately the same results. 16. In the bootstrap procedures (both for the innovation output equation as for the production. function below) we use 100 replications. Since each replication of the bootstrap uses a different sample, and therefore each replication requires the construction of new predictions for innovation inputs, the estimation of the innovation input equations is included in the bootstrap procedure. 17. Another set of potentially interesting results are the effects on the latent innovation output. variables in the equations (5a)-(5c). These can be found in an earlier discussion paper (Polder et al. 2009). 14.
(17) mainly devoted to developing new and improving existing products in manufacturing, but we find no evidence that these efforts spill over to other innovation types in this sector. On the other hand, ICT investment is important for all types of innovation in services, while it plays a limited role in manufacturing, being only significant at 10% for organizational innovation.18 The broadband intensity of a firm seems to make a significant difference in both sectors. Broadband access allows firms to quickly share and obtain information from other agents in the firm’s network; following Eurostat (2008) it is seen as an indicator of how advanced the ICT infrastructure of a firm is. In our results it positively affects product as well as organizational innovation in manufacturing, and all types of innovation in services. As in Eurostat (2008), the e-commerce variables are seen as indicators of how a firm actually uses its ICT infrastructure for selling goods and services in the case of e-sales, and for purchasing inputs in the case of e-purchases. In manufacturing, both electronic sales and purchases seem to matter only for process innovation, which could point at the integration of sales and purchases activities into the logistics and/or supporting activities of firms. In services, all types of innovation are positively affected by more e-purchasing, although only marginally in the case of process and organizational innovation, while product innovation is the only one that also benefits from a higher intensity of e-sales.19 The fact that access to broadband is significant in most cases, even in the presence of the e-commerce variables, indicates that the importance of broadband goes beyond its use in e-commerce. The results with respect to the ICT variables confirm recent findings that ICT is an important enabler of capturing and processing knowledge in the innovation throughput stage. In addi-. 18. One could also argue that ICT investment and R&D interact in the innovation process. That. is, the combined application of R&D and ICT helps innovation. We tested this by adding an interaction term of (predicted) R&D and ICT investment to the innovation output equation. The results (not reported, but available upon request) showed no evidence of the significance of such an interaction, both for manufacturing and services. Moreover, it was reassuring that the results for the separate R&D and ICT variables remained close to the ones obtained above. 19. Van Leeuwen and Farooqui (2008) find a positive effect of e-sales on product innovation,. making no distinction between manufacturing and services. Our results suggest that this overall positive effect of e-sales is due to the higher proportion of the service firms in their sample. 15.
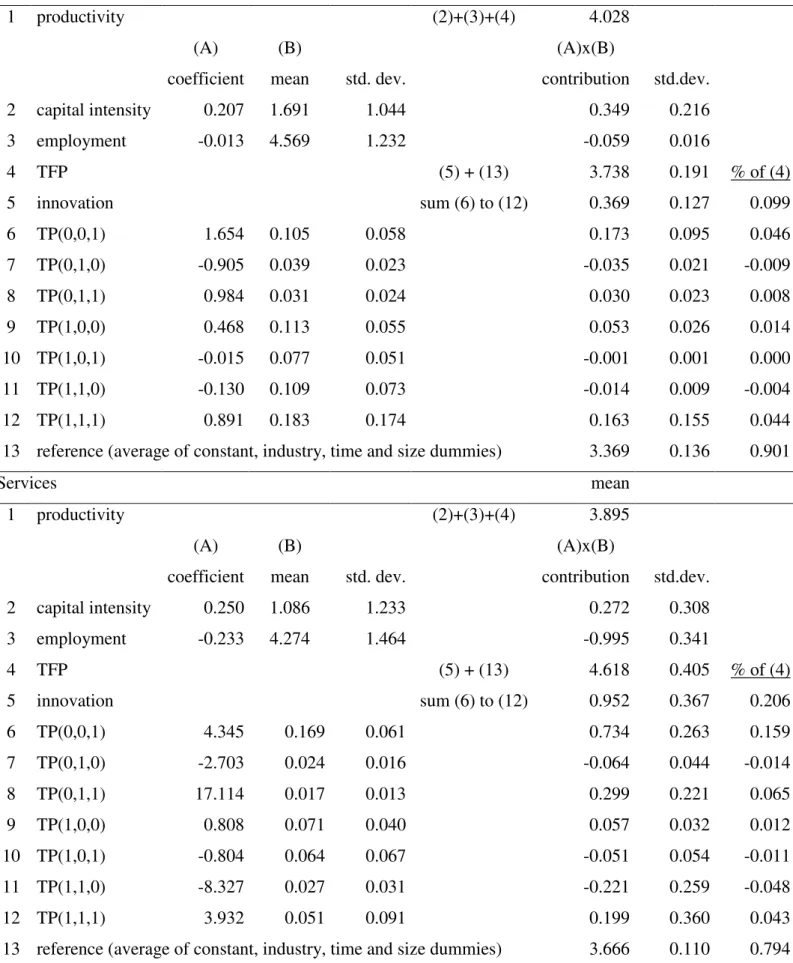
(18) tion, the industry differences demonstrate that ICT in general, and relatively new ICT applications such as broadband connectivity and e-commerce in particular, are more important in services than in manufacturing. 5.3. Productivity. Finally, we present the estimates for the production function. We use value added over employment as the dependent variable. Controlling for capital intensity and firm size using data from the PS, the estimated effects can be interpreted as TFP effects. Firstly, the OLS estimation results are given for the model as discussed above where the knowledge production function consists of a trivariate probit. Subsequently, to be able to focus on the contribution of organizational innovation, we also present the results of a model with only product and process innovation. For all sets of results we report the normal standard errors as well as standard errors based on bootstrapping, where the latter account for the fact that predicted values are used for the propensities.20 It turns out that the differences between both sets of standard errors for the production function are small for this equation. Table 3c presents the OLS estimation results for the model with three innovation types. The most striking aspect is that in both sectors the combinations of innovations that contribute significantly to a higher productivity all involve organizational innovation: organizational innovation only, process combined with organizational innovation, and the combination of all types of innovation. By contrast, the combination of product and process innovation in services is associated with a lower productivity. It can be argued that this combination initially has a disruptive effect but may lead to productivity gains in subsequent periods, but can also be indicative of a negative effect of technological innovation that is not adequately supported by a change in the organization of a firm.21 Overall, we see that combinations with product and process innovation do not have a positive effect on productivity when performed in isolation or jointly, but do have a positive effect when combined with an organizational innova-. 20. To be able to construct new predictions for innovation input and output, the entire model is. re-estimated in each bootstrap replication (see also footnote 16). 21. Testing for a lagged positive effect of technological innovation on productivity requires the. introduction of dynamics in our model, which is beyond the scope of our current investigation. 16.
(19) tion. This finding is consistent with the idea of possible complementarities between technological and organizational innovation. We test this hypothesis formally in the next subsection. Capital intensity (proxied by depreciation per fte) is positive and significant for both sectors. The coefficient on labor, which measures the deviation from constant returns to scale in this specification,22 is insignificant for manufacturing but significantly negative for services. This indicates substantial decreasing returns to scale in this sector. This can be explained by a typical feature of services. This industry consists of many small firms operating on suboptimal scales. Kox et al. (2007) show that scale economies in services are very local and that productivity in services across size classes is hump-shaped with increasing economies of scale for small firms and decreasing economies of scale for large firms. Although we control in our model for size related selectivity, it cannot be circumvented that the linking of various data sources leads to the under-representation of small firms, especially in services. Thus, having relatively more large firms in the matched samples may explain the negative estimate for the returns to scale parameter in services.23 The effects of innovation are much larger in services. For example, interpreting the coefficients as semielasticities, an increase of 1 percentage point (+0.01) in the propensity of introducing a process together with an organizational innovation (TP(0,1,1)), increases productiv-. 22. Starting with the Cobb-Douglas function for value added we have, VA = A⋅KαLβ, and our. specification is a rewritten version of this, i.e. VA/L = A(K/L)αLα+β−1. Thus, constant returns to scale (α + β = 1) would imply the coefficient on labor to be zero in our specification. 23. In this paper we argue that R&D and ICT are inputs in the innovation process of a firm,. and not in the production process. Accordingly, R&D and ICT investment are absent from the production function, and their effect on productivity is only indirect via the innovation output variables. With respect to R&D, the model structure where innovation input leads to innovation output which ultimately leads to productivity gains (without a direct effect of R&D) is well established, see e.g. Crépon et al. (1998). To test whether the input variables have a direct effect on productivity, besides their indirect effect via innovation output, we also estimated the production function including (predicted) R&D and ICT intensity as explanatory variables. In both the manufacturing and services sector the direct effects of both input variables turn out insignificant, while the pattern of significance in the innovation modes combination dummies is largely maintained. Thus, there is no evidence for an effect on productivity of R&D and ICT, besides the indirect effect via innovation. 17.
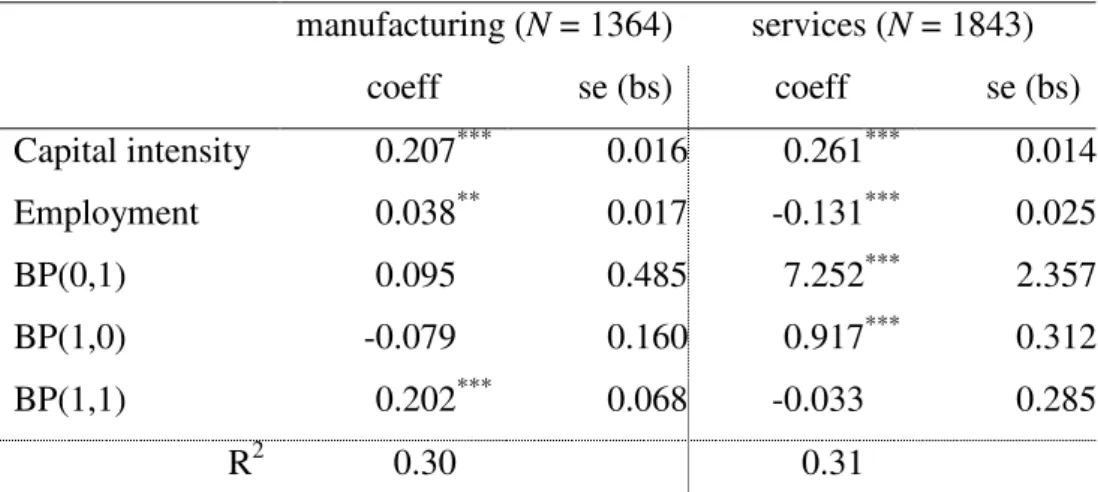
(20) ity by about 17% in services. However, this interpretation does not take into the account the differences in the means of the propensities and their standard deviations. These are presented in table 3d. Notice that the smaller groups get a lower propensity. From the standard deviations reported we see that a 0.01 percentage point change is relatively big for, say, TP(0,1,1) compared to for example TP(0,0,1). An increase of a single standard deviation would thus lead to an increase of respectively 4.345×0.061 = 26.3% for TP(0,0,1) and 17.114×0.013 = 22.1% for TP(0,1,1) in services. In addition, it is in this context illustrative to look at the contribution of innovation to productivity. In table 3d we decompose (average) productivity into the contributions of each of the explanatory variables in the productivity equation. There are two major components, namely the contribution of the factors of production (capital and labor) and TFP. TFP can be broken down into a reference part (containing the constant plus industry and time dummies), and innovation (containing the propensities). The contribution of each of the variables to productivity is its estimated coefficient times its average. The biggest contributions from innovation in manufacturing come from TP(0,0,1) and TP(1,1,1). In total, the share of innovation in TFP is about 10% in this sector. With almost 21%, this share is much higher in services. The strongest contributions from innovation come again from TP(0,0,1) and TP(1,1,1), extended with TP(0,1,1). Although the latter category has the largest coefficient, its contribution to TFP ranks second, due to the lower average propensities. Relating our results to the existing literature on the effects of product and process innovation (see section 2), we find that the latter types of innovation increase productivity significantly only when accompanied by an organizational innovation. The omission of non-technological innovation in existing studies is therefore a possible explanation for the varying results with respect to the effect of different types of innovation on productivity. To reinforce this point, we re-estimated the model excluding organizational innovation, specifying the knowledge production equation as a bivariate probit. The results for both sectors are reported in table 3e. They show that the combination of product and process innovation increases TFP significantly in manufacturing but not in services. However, when we confront these results with those of table 3c, we realize that in manufacturing the positive effect of the combination of product and process innovation only occurs in the presence of organizational innovation (the effect of TP(1,1,0) being non-significant), whereas in services the insignificant effect of the combination of product and process innovation could be due to the mixture of the significant positive effect in the presence of organizational innovation and the significant negative effect. 18.
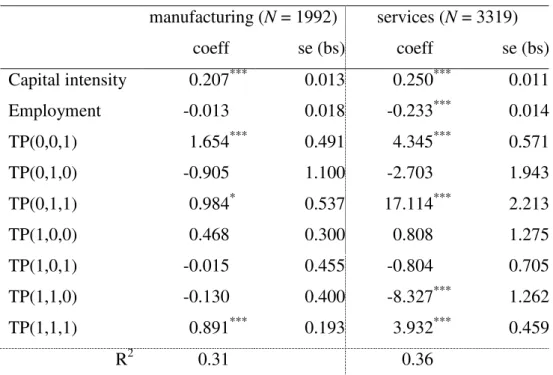
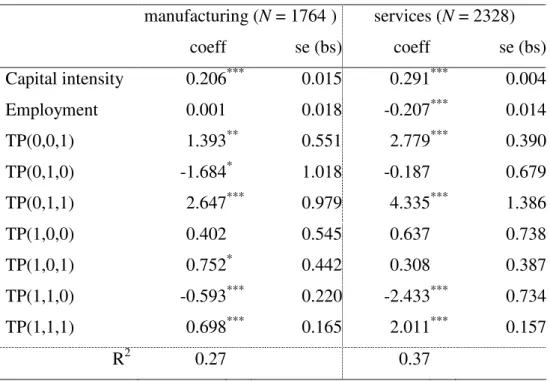
(21) in the absence of organizational innovation. These contrasting results show that leaving out organizational innovation from the analysis can lead to different (possibly misleading) conclusions about the contribution of product and process innovation to productivity.24 5.4. Robustness checks. 5.4.1. Endogeneity and selectivity bias in the production function To investigate the robustness of our results with respect to potential bias due to selection effects and the endogeneity of the capital variable, we estimated the productivity equation with the Olley and Pakes (1996) estimation algorithm.25 The results are presented in table 4. The main findings on the effects of innovation modes on productivity are maintained when the Olley-Pakes method is used for estimation of the production function. The only differences in significance with respect to the OLS estimation results reported in table 3c are the insignificance at the 10% level of the combination of process and organizational innovation in manufacturing, and the significance of the positive effect of product and organizational innovation in this sector. The combinations that have a positive effect on productivity all involve organizational innovation as in table 3c. Overall, the estimated effects are larger in magnitude than in the case of the OLS results. Although the effects in manufacturing have increased more with respect to table 3c, the strongest effects are still in services. The capital coefficient is somewhat lower than before in both sectors, which contrasts with the findings by Olley and Pakes. This could be due to the smaller samples compared to the OLS estimation, due to the need to link with the investment survey. Finally, while we still find decreasing returns to scale in services, it is much less pronounced compared to the results in table 3c.. 24. Note that it is difficult to compare the results of the two models directly since the coeffi-. cients of the innovation combination dummies are with respect to different reference categories (BP(0,0) includes both the reference category in the three innovation type model TP(0,0,0), as well as TP(0,0,1)). Moreover, the predictions for the innovation output variables are based on a different knowledge production function. 25. We use the Olley-Pakes estimation package for Stata, see Yasar et al. (2008). We use val-. ue-added instead of gross output. We do not include the age of a firm, but we have the innovation combination dummies as additional variables. As a proxy for the unobserved productivity we use a second-order polynomial in investment and the capital-labor ratio. 19.
(22) 5.4.2. Degree of product innovation A product innovation is in general defined as a good or service that is new for the firm that produces it. There is therefore no distinction in the degree of novelty of an innovation. For product innovation we can make this distinction by using the information on whether an innovation is new to the market or not. It can be argued that firms that develop a highly innovative product generate a higher competitive advantage than firms adapting new products that already exist, resulting in a higher level of productivity. Such a distinction could possibly have an impact on the allocation of the contribution of each of the innovation types to productivity, because firms with new-to-firm innovations move to different combinations. We therefore re-estimate the model narrowing the definition of product innovation by requiring that it is new to the market. The results for the productivity equation are reported in table 5.26 The only two significant coefficients are those related to organizational innovation by itself or in combination with product and process innovation, in both manufacturing and services. All other innovation mode combinations are insignificant at the 10% level. The coefficients of the significant combinations are in line with table 3c, but the combination with the highest coefficient in services in that table - TP(0,1,1) - is now insignificant and the negative effect of TP(1,1,0) becomes insignificant. Both combinations contain relatively few observations, which could explain their sensitivity to a change in the definition of product innovation.. 5.4.3. Robustness to the lagging of innovation input variables The structure of the data implies that we are relating innovation output over a three-year period (t−2 to t) to R&D and ICT investment from one year (year t). An implicit assumption in our analysis is that the R&D and ICT investment in year t is indicative for these investments over the entire period. The main advantage of this approach is that we maximize the number of firms in the analysis. Due to the loss of data, it is not possible to construct aggregate investment over t−2 to t and relate these total investments over the whole period to innovation output. However, to see whether the results are sensitive to our timing assumptions we reestimate the model using ‘mid-period’ (i.e. t−1) values for the innovation inputs. For informa-. 26. The change in the definition of product innovation does not affect the innovation input eq-. uations. The innovation output equation is altered because the dummy for product innovation is adjusted. The estimation results for the latter do not change in a qualitative way; they are available upon request. 20.
(23) tion on the mid-period R&D investments we make use of the biannual R&D survey that is carried out in between two editions of the CIS (i.e. each odd year). This survey only contains R&D performers, detected in the previous CIS (year t-2), although zeroes may occur for R&D. The Heckman equations (1) and (3) are estimated with t-1 values for R&D. The selection variable applies to whether a firm reported R&D in the R&D survey or not. The explanatory variables are the same as before. Next, we construct predictions for year t-1 R&D in the same way as before, and in the same fashion, we also predict mid-period ICT investment.27 Mid-period broadband intensity and e-commerce variables can be taken from the year t-1 ICT survey. The results for the innovation output equation and the production function are reported in the tables 6a and 6b. In the innovation output equation, we find stronger effects of R&D in manufacturing than before, whereas ICT investment is now insignificant or has a negative impact. These findings could relate to the fact that the predictions for R&D are now based solely on R&D performers (i.e. firms in the R&D survey). This could lead to an overstatement of the relevance of R&D. By consequence, the negative coefficient on ICT investment could be the result of a compensation for this overstatement. Nevertheless, the pattern of significance for the broadband intensity and e-commerce does not vary much from table 3b, with broadband positively affecting the probabilities for a product and organizational innovation and epurchases increasing the probability of a process innovation. The results for the knowledge production function in the services sector are similar as before, although the role of broadband and e-commerce is slightly lower, which could be due to the lower number of observations. The results for the productivity equation, once more, remain largely the same, especially in services, although there are some changes in the magnitudes of the estimated effects. In table 6b, we see that in manufacturing the main change is that a process innovation by itself and a process innovation combined with a product innovation have a significantly negative effect in this specification. As before, however, in both sectors, only combinations with organizational innovation have a positive effect on productivity.. 27. The estimation results for the adjusted R&D and ICT equations are available upon request. 21.
(24) 5.5. Testing for complementarity and substitutability of innovation modes. It is possible to test formally the complementarity and substitutability between the different innovation modes. Following the approach taken by Mohnen and Röller (2005) we apply a test for super- and submodularity of the production function. If the production function is supermodular with respect to a combination of innovation modes, this is evidence of the complementarity of these modes. In the case of submodularity, the modes are substitutes. Let Ij denote a possible combination of innovation modes, where j = 1,…,8 since there are three innovation modes. Note that if Ij = 1. Ik ≠ j = 0. We will use the shorthand f(Ij) to de-. note the value of the production function when Ij = 1.28 Supermodularity is then defined as f (I j ) + f (I k ) ≤ f (I j ∨ I k ) + f (I j ∧ I k ). ∀j, k,. and likewise, submodularity is defined as f (I j ) + f (I k ) ≥ f (I j ∨ I k ) + f (I j ∧ I k ). ∀j, k,. where ∨ is the componentwise maximum of Ij and Ik, and ∧ the componentwise minimum. We do not need all these inequalities. To test the complementarity between two innovation modes, we only need to make pairwise comparisons keeping the third mode constant. In addition, some inequalities are trivial. For example, for Ij = (0,0,0) and Ik = (1,1,0) we have f(0,0,0) + f(1,1,0) < f(1,1,0) + f(0,0,0). Only the combinations where the minimum and maximum operators lead to different combinations than the left-hand side are non-trivial. Thus, combination Ij should have at least one element that is smaller than the corresponding element in Ik, and at least one element should be bigger (i.e. at least one innovation mode should occur in Ij but not in Ik and vice versa). For testing the complementarity between, for example, product and process innovation we therefore have Ij = (0,1,X) and Ik = (1,0,X), with X = {0,1}, and the inequality restrictions are: f(0,1,0) + f(1,0,0) < f(1,1,0) + f(0,0,0) ⇔ β010 + β100 − β110 − β000 < 0 f(0,1,1) + f(1,0,1) < f(1,1,1) + f(0,0,1) ⇔ β011 + β101 − β111 − β001 < 0 Similarly, for the other two pairwise comparisons we have: product-organizational innovation f(0,0,1) + f(1,0,0) < f(1,0,1) + f(0,0,0) f(0,1,1) + f(1,1,0) < f(1,1,1) + f(0,1,0) process-organizational innovation 28. Note that the contribution of additional variables in the production function cancels out in. the inequalities, so that they can be excluded from the exposition. 22.
(25) f(0,0,1) + f(0,1,0) < f(0,1,1) + f(0,0,0) f(1,0,1) + f(1,1,0) < f(1,1,1) + f(1,0,0) with similarly straightforward translations into the estimated regression coefficients. The inequalities for submodularity are easily obtained by replacing ‘≤’ with ‘≥’. Kodde and Palm (1986) derive a Wald test-statistic for testing these inequalities for regression coefficients. Let γ = (β000, β001, β010, β011, β100, β101, β110, β111)′, the coefficients on the dummies for innovation mode combinations in the augmented production function. The test statistic is given by29 D = ( Sγ~ − Sγˆ )′( S ′ cov(γˆ ) S ) −1 ( Sγ~ − Sγˆ ) where. γ~ = arg min ( Sγ − Sγˆ )′[ S ′ cov(γˆ ) S ] −1 ( Sγ − Sγˆ ) s.t. Sγ < 0 where γˆ the OLS estimate of γ, cov( γˆ ) is the estimated covariance matrix of γ, and S is a matrix that maps the coefficients into the constraints derived above.30 For example, if one wants to test jointly the constraints associated with complementarity for product and process innovation,31 S=. −1 0 1 0 1 0 −1 0 . 0 −1 0 1 0 1 0 −1. The covariance matrix can be estimated from the OLS results. The interpretation of γ~ is that it is the coefficient, which is as close as possible to the OLS estimates under the restrictions reflected in S. We use quadratic minimization under inequality constraints in MATLAB to calculate γ~ . Critical values for the test statistic D can be found in Kodde and Palm.32. 29. Cf. (2.16) op. cit. Note that since we do not have equality constraints, there is no need to. subscript the parameter vector and covariance matrix, and the equation reduces to the given expression. 30. Equivalently, let h(β) denote the vector of restrictions, such that H0: h(β) < 0 and H1: h(β). > 0 (i.e. in the restrictions above, bring all terms to the left-hand side). As in the notation of Kodde and Palm, S = ∂h/∂β, a derivative matrix which consists only of elements -1, 0, and 1. 31. Note that for testing submodularity the matrix is −S.. 32. For the lower bound of the test statistic, the number of degrees of freedom (dfLB) equals the. number of equality constraints plus 1, and the number of degrees of freedom for the upper 23.
(26) Table 7 gives the results for the super- and submodularity tests for the baseline model as well as for the specifications used for the robustness analyses. Complementarity is accepted for product and process innovation in both sectors in all variants; substitutability of these types is rejected in most cases, although in some cases the test is inconclusive at 5 or 10% and H0 is accepted at 1%. Product and organizational innovation appear to be substitutes in both sectors, as substitutability is accepted in all cases. Complementarity is rejected in nearly all cases, although in the case where product innovation is new to the market in manufacturing it is still accepted at 1%, while the test result turns to inconclusive at lower significance levels. Process and organizational innovation are found to be complements, with complementarity being accepted in all variants for both sectors. However, the strength of this result is slightly qualified by the fact that substitutability is also accepted in some of the alternative specifications (Olley-Pakes and product innovation new-to-market). In summary, we find evidence for the substitutability of organizational innovation and product innovation, and complementarity of product and process innovation. Process and organizational innovation are complements in the baseline model, but in some alternative specifications substitutability cannot be rejected. Note that the test gives a statistical verdict on the loss or gain in productivity derived from performing two types of innovation jointly. The test does not provide a statement on which type is ‘better’. When we find that two types are substitutable, it does not mean that they are interchangeable. For example, we find that product and organizational innovation are substitutes, but from table 3c we see that the highest productivity gains are derived from the latter. The outcome of the test means that, on average, the combinations where product and organizational do not occur together have a higher productivity than the combinations where they do occur together. Looking at table 3c, this can be understood from the fact that organizational innovation without product innovation (i.e. the combinations TP(0,0,1) and TP(0,1,1)) has strong positive effects. 6. Conclusions and further research. In this paper, we investigate the relation between innovation and productivity, combining insights from the literature on R&D driven technological innovation and that on nontechnological innovation complemented by ICT. The standard CDM framework is extended. bound (dfUB) equals the total number of constraints. Since we have two inequality constraints, and no equality constraints, dfLB = 1 and dfUB = 2. 24.
(27) to include investment in ICT as an endogenous input into innovation next to R&D, and process and organizational innovation as innovation output next to product innovation. Including ICT investment reflects the idea that it is an enabler of innovation success, and thus a determinant of innovation output. Extending the model with process and organizational innovation reflects that productivity gains are not solely achieved by product innovation. Lacking continuous measures for the output of process and organizational innovation, innovation output is measured by dichotomous variables reflecting whether a firm performed a particular type of innovation or not. We reach a number of interesting conclusions. R&D drives the output of product innovation in the manufacturing sector. There is also evidence for a positive effect on process and organizational innovation in this sector when using mid-period values. By contrast, in the services sector there is no evidence for an effect of R&D on any of the innovation types considered. Using R&D as a measure of innovation, as encountered frequently in the literature, is probably most appropriate in manufacturing where it has the strongest effects on product innovation. ICT is most important for innovation success in the services sector. ICT investment, the use of broadband, and doing e-commerce, positively affect all three types of innovation in this sector. For manufacturing, ICT seems less important, although ICT investment and broadband use are still important drivers of organizational innovation in this sector. Broadband use also positively affects product innovation in manufacturing, and e-commerce is positively related to process innovation. Organizational innovation is the only innovation type that leads to higher contemporaneous TFP levels. Product and process innovation only lead to higher TFP when performed in combination with an organizational innovation. This is true for both sectors, though we find stronger effects in services. Testing for complementarity and substitutability shows that organizational and product innovations are substitutes. While their combination without organizational innovation does not lead to significantly higher productivity, product and process innovation are complements. Organizational innovation and process innovation are found to be complements, although in some non-baseline variants both complementarity and substitutability are accepted. All in all, our results say that product and process innovations do not have a positive effect without organizational innovation. Moreover, in both sectors ICT investment and application are found to be important drivers of organizational innovation. The pattern of significance of each of the combinations does not vary much between the sectors. The magnitude of the es25.
(28) timated effects does differ, however, with stronger effects found in services. These results stress the importance of ICT for the innovation process, and the complementarity of ICTenabled non-technological innovation to pure technological innovation. Our findings put into perspective existing work on productivity effects of innovation not taking into account nontechnological innovation and/or focusing on R&D inputs only, without considering ICT. Our results can also be related to findings at a higher aggregation level. Within the macroeconomic literature there is a longstanding debate on the causes of higher economic growth and the growth of productivity in the United States over the last two decades compared to the rest of the world, in particular the European Union (see e.g. van Ark et al. 2008, and Jorgenson et al. 2008). The most common explanation of this phenomenon is that the US have been more successful in investing and implementing new information and communication related technologies. Macroeconomic figures show that the European Union is behind in terms of the contribution to economic growth of ICT producing and using sectors (mainly market services) and of components related to the knowledge economy (quality of labor, ICT capital, and technological change). Our results connect and reinforce these observations since they provide evidence that ICT inputs indeed lead to productivity differences at the microlevel via its impact on innovation, in particular changes in organization. This also corroborates findings of Bloom and Van Reenen (2007) who present evidence that US firms are on average better managed than European firms.33 There are a number of issues that deserve further research. Firstly, since we have available various waves of the CIS, it is possible to introduce firm-specific effects. Among other things, this may make the results more robust to omitted variables and various other sources of bias (provided they are approximately time-invariant). This would severely complicate the estimation of the discrete trivariate knowledge equation. In addition, it is possible to investigate dynamics. For example, current R&D expenditures may lead to innovation only after a period of time. Likewise, innovation may not immediately materialize into productivity gains. However, the introduction of feedback and/or autoregressive effects, especially in combination with fixed effects, is an econometrically challenging extension (e.g. Raymond et al. 2010). Finally, we did not have the availability over data about worker skills. The availability. 33. Since Bloom and Van Reenen relate their findings to product market competition and fam-. ily ownership of the firm, it would be an interesting extension of our model to include these variables into the ICT input equation. 26.
(29) of such a variable would certainly be interesting, especially in the light of the complementarity of worker skills and ICT as in, for example, Bresnahan et al. (2002). References Amemiya, Takeshi. 1984. “Tobit models: a survey.” Journal of Econometrics, 24: 3-62. Ark, Bart van, Mary O’Mahony, and Marcel P. Timmer. 2008. “The Productivity Gap. between Europe and the United States: Trends and Causes.” Journal of Economic Perspectives, 22(1): 25-44. Black, Sandra E., and Lisa M. Lynch. 2001. “How to compete: the impact of workplace. practices and information technology on productivity.” The Review of Economics and Statistics, 83(3): 434-445. Bloom, Nicholas, Luis Garicano, Raffaella Sadun and John Van Reenen. 2009. “The. distinct effects of information technology and communication technology on firm organization.” NBER Working Paper No. w14975. Bresnahan, Timothy F., Erik Brynjolfsson and Lorin M. Hitt. 2002. “Information tech-. nology, workplace organization, and the demand for skilled labor: firm-level evidence.” Quarterly Journal of Economics, 117(1): 339-376. Brynjolfsson, Erik, and Lorin M. Hitt. 2000. “Beyond Computation: Information Technol-. ogy, Organizational Transformation and Business Performance.” Journal of Economic Perspectives, 14(4): 23-48. Brynjolfsson, Erik, Andrew McAfee, Michael Sorell, and Feng Zhu. 2006. “Scale without. mass: business process replication and industry dynamics.” Harvard Business School working paper 07-016. Chudnovsky, Daniel, Andrés López, and Germán Pupato. 2006. “Innovation and produc-. tivity in developing countries: a study of Argentine manufacturing firms’ behavior (19922001).” Research Policy, 35: 266-288. Crépon, Bruno, Emmanuel Duguet, and Jacques Mairesse. 1998. “Research, innovation. and productivity : an econometric analysis at the firm level.” Economics of Innovation and New Technology, 7: 115-158. Crespi, Gustavo, Chiara Criscuolo, and Jonathan Haskel. 2007. “Information technology,. organizational change and productivity growth: evidence from UK firms.” CEP Discussion Paper no. 783. Eurostat. 2008. “Information Society: ICT impact assessment by linking data from different. sources (Final Report).” Luxembourg: Eurostat. 27.
(30) Greenhalgh, Christine and Mark Rogers. 2010. Innovation, intellectual property, and eco-. nomic growth. Woodstock, Oxfordshire (UK): Princeton University Press. Griffith, Rachel, Elena Huergo, Jacques Mairesse, and Bettina Peters. 2006. “Innovation. and productivity across four European countries.” Oxford Review of Economic Policy, 22(4): 483-498. Griliches, Zvi. 1979. “Issues in assessing the contribution of research and development to. productivity growth.” Bell Journal of Economics, 10(1): 92-116. Jorgenson, Dale W., Mun S. Ho, and Kevin J. Stiroh. 2008, “A Retrospective Look at the. U.S. Productivity Growth Resurgence.” Journal of Economic Perspectives, 22(1): 3-24. Kodde, David, and Franz Palm. 1986. “Wald criteria for jointly testing equality and ine-. quality restrictions.” Econometrica, 54(5): 1243-1248. Kox, Henk, George van Leeuwen, and Henry van der Wiel. 2007. “Market structure, pro-. ductivity and scale in European business services.” CBS Discussion Paper 7013. Leeuwen, George van, and Shikeb Farooqui. 2008. “ICT, innovation and productivity.” In. Eurostat “Information society: ICT impact assessment by linking data from different sources.” 222-239. Leeuwen, George van, and Luuk Klomp. 2006. “On the contribution of innovation to. multi-factor productivity growth.” Economics of Innovation and New Technology, 15: 367390. Lööf, Hans, and Almas Heshmati. 2002. “Knowledge capital and performance heterogene-. ity.” International Journal of Production Economics, 76(1): 61-85. Mairesse, Jacques, Pierre Mohnen and Elisabeth Kremp. 2006. “The importance of R&D. and innovation for productivity: a reexamination in light of the French innovation survey.” Annales d’Économie et de Statisque, 79/80: 1-24. Milgrom, Paul, and John Roberts. 1990. “The economics of modern manufacturing, tech-. nology, strategy and organizations.” American Economic Review, 80: 511-528. Mohnen, Pierre and Lars-Hendrik Röller. 2005. “Complementarities in innovation policy.” European Economic Review, 49: 1431-1450. Murphy, Marian. 2002. “Organizational change and firm performance.” OECD Science,. Technology and Industry Working Papers, 2002/14, OECD Publishing. Olley, G. Steven, and Ariel Pakes. 1996. “The dynamics of productivity in the telecommu-. nications equipment industry.” Econometrica, 64(6): 1263-1297.. 28.
Figure

+7

Documents relatifs
Previously, one- time digital signatures based on hash functions involved hundreds of hash function computations for each signature; we show that given online ac- cess to a
• Even if the destination endpoint doesn’t speak MPLS, the LSP that goes to the last MPLS speaking router along the path will be
SUMMARY: ROMSwitcher is a new aspect ratio switch which allows LisalMac XL users to use the Apple Mac XL Screen Kit for a properly proportioned full-size
This research proposed to explore the linkage between salespersons’ preoccupation for the well-being of future generations (coined generativity), their contribution to
Thus, hedefi ned the multiplication of two cardinal numbers 1, and, although the extension of this definition to a transfinite number of cardinal numbers
Element relations in the years 1997 and 2000 of the youngest needle age classes in different treatments: (IL) irrigation with liquid fertilizer, (WA) wood ash, (I) irrigation,
But if statement Sh fails to make sense, it seems that statement Sf does not make sense either, according to Condition1: for the terms “brain” and “left arm” occupy the
Monodisperse sequence-encoded poly(alkoxyamine amide)s were synthesized using an iterative strategy employing two chemoselective steps: the reaction of a primary amine with an
