HAL Id: hal-00684401
https://hal.archives-ouvertes.fr/hal-00684401
Submitted on 2 Apr 2012
HAL is a multi-disciplinary open access
archive for the deposit and dissemination of
sci-entific research documents, whether they are
pub-lished or not. The documents may come from
teaching and research institutions in France or
abroad, or from public or private research centers.
L’archive ouverte pluridisciplinaire HAL, est
destinée au dépôt et à la diffusion de documents
scientifiques de niveau recherche, publiés ou non,
émanant des établissements d’enseignement et de
recherche français ou étrangers, des laboratoires
publics ou privés.
Fingerprinting localization based on neural networks
and ultra-wideband signals
Lei Yu, Mohamed Laaraiedh, Stephane Avrillon, Bernard Uguen
To cite this version:
Lei Yu, Mohamed Laaraiedh, Stephane Avrillon, Bernard Uguen. Fingerprinting localization based
on neural networks and ultra-wideband signals. Signal Processing and Information Technology
(IS-SPIT), 2011 IEEE International Symposium on, Dec 2011, Bilbao, Spain. pp.184 -189,
�10.1109/IS-SPIT.2011.6151557�. �hal-00684401�
Fingerprinting Localization based on Neural
Networks and Ultra-wideband signals
Lei Yu, Mohamed Laaraiedh, Stéphane Avrillon, Bernard Uguen
Université de Rennes 1, IETR, Campus Beaulieu Bat 11D
Rennes 35042 France
Email : [lei.yu, mohamed.laaraiedh, stephane.avrillon, bernard.uguen]@univ-rennes1.fr
Abstract—Fingerprinting techniques have been proved as an effective techniques for determining the position of a mobile user in an indoor environment and in challenging environments such as mines, canyons, and tunnels where common localization techniques based on time of arrival (TOA) or received signal strength (RSS) are subject to big positioning errors. In this paper, a fingerprinting based localization technique using neural networks and ultra-wideband signals (UWB) is presented as an alternative. The fingerprinting database is built with signa-tures extracted from channel impulse responses (CIR) obtained by processing an IR-UWB indoor propagation measurement campaign. The construction of the neural networks and the adopted approach are described. Positioning performances are evaluated with different selected signatures and different sizes of the fingerprinting database.
Index Terms—Fingerprinting, Localization, Neural networks, UWB.
I. INTRODUCTION
Indoor localization has received a lot of attention over the past few decades [1]. A good indoor localization system must have a high accuracy, a short training phase, a low cost, and a good robustness in the face of previously unobserved condi-tions. Fingerprinting based localization techniques have been proposed for indoor and challenging environments such as mines, tunnels, and hospitals where the propagation is highly affected by noise and multipath components. Fingerprinting techniques refer to identifying a specified location by relying on the data which can represent this location.
Fingerprinting localization systems are based on two phases: the off-line phase (training) and the on-line phase (localiza-tion). In this paper, during the training phase, a fingerprint-ing database consistfingerprint-ing of the signatures extracted from the channel impulse response (CIR) of the Ultra-wideband (UWB) measurement campaign is built. This database benefits from the high time resolution and multipath resolvability of the UWB signals [2], [3], [4]. In the on-line phase, this database is used to locate targeted nodes. Different techniques can be applied to train the database such as Nearest Neighbour, Sup-port Vector Regression, and Neural Networks. Assuming that the fingerprinting database cannot be analysed mathematically due to their complexities, the neural networks are proposed in our work.
In this direction, this paper presents a contribution to fingerprinting based localization techniques using neural net-works and ultra-wideband CIR. We start in section II by
introducing the fingerprinting technique and the construction of the fingerprinting database. Then, we describe the neural networks technique in section III by presenting its architecture and the algorithm applied during the learning process. In section IV, the UWB measurement campaign is presented, this measurement campaign is used to evaluate and compare the different fingerprints and sizes of the databases. Finally, the results are discussed in section V and our concluding remarks and work perspectives are given in section VI.
II. FINGERPRINTINGBASEDLOCALIZATIONTECHNIQUE
A. Training phase
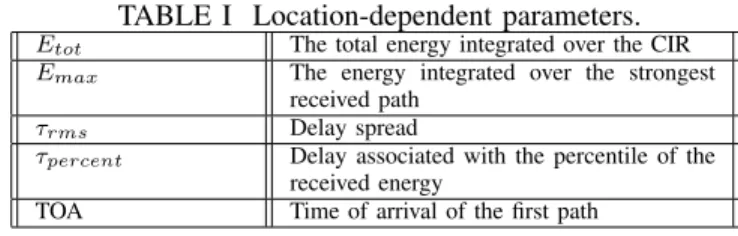
The fingerprinting based localization technique could be considered as a regression scheme that maps an input vector to an output vector by using a training set. During the training phase, the fingerprinting database is constructed with the location-dependent parameters (LDPs) extracted from the CIR. Two main factors should be considered for selecting the finger-prints. Firstly, the fingerprints must have considerable spacial variability. Secondly, the fingerprints must be consistent in time. In this paper, we focus on the following LDPs:
TABLE I Location-dependent parameters.
Etot The total energy integrated over the CIR Emax The energy integrated over the strongest
received path τrms Delay spread
τpercent Delay associated with the percentile of the
received energy
TOA Time of arrival of the first path
A fingerprinting database is expressed by:
T = (f1, p1), (f2, p2)...(fN, pN) (1)
where fi represents the input fingerprint pattern for the
ith
location and pi is the position of the ith point, given
by pi = [xi, yi, zi]. N is the total number of elements in
the fingerprinting database (i.e. the size of the fingerprinting database).
The fingerprint pattern fi can be made of one or several
LDPs extracted from the CIR between the transmitter and a number of reference nodes.
where mi1, mi2, mi3, ..., mij represent the different
fin-gerprints of the ith point. E.g. if Etot is selected as the
fingerprint and four different receivers are the reference nodes, the definition (2) becomes:
fi= [Etoti1, Etoti2, Etoti3, Etoti4] (3)
Certainly, we can also combine some signal features for building a combined fingerprint pattern. Assuming that we select Emax and TOA as the fingerprint, the definition (2)
becomes:
fi= [Emaxi1, Emaxi2, Emaxi3, Emaxi4,
T OAi1, T OAi2, T OAi3, T OAi4] (4)
We distinguish two different types of LDPs depending on whether a time reference is available (TOA) or not (Etot, Emax, τrms, τpercent). The consumption of a known
time reference has an impact on the receiver complexity.
B. Location phase
The location phase consists in the modelling of the input vector and the output vector of the fingerprinting database and then using the learned model to estimate the targeted locations. Various techniques could be implemented in the location phase. In this paper, neural networks technique is proposed to be used during the location phase.
C. Advantages vs. drawbacks
The main advantage of the fingerprinting based localization technique is that it can provide accurate location estimation in the challenging multipath environments and thus outperforms some common localization techniques based on trilateration and triangulation. Moreover, in the on-line phase, the targeted location is calculated based on the carpet values, which avoids the need for communication with a central server. No more additional access to the network is required, and hence it provides for a standalone positioning solution independent of the environment. With the fingerprinting based localization technique, we just need to focus on the choice of fingerprints and the association between the chosen fingerprints and their positions.
However, the fingerprinting database has to be large enough in order to achieve a good positioning accuracy. In addition, the fingerprinting database has to be updated when the envi-ronments change significantly. For example, if some metallic furnitures are placed in an indoor environment, we have to rebuild the fingerprinting database to take into account their effects on the signal propagation. This drawback can be very expensive especially in outdoor environments which are usually very dynamic. That is why the fingerprinting based localization technique is more suitable for indoor localization systems.
III. NEURALNETWORKS
Neural network is a software simulation of a biological brain (sometimes called Artificial Neural Network or ANN) [2], [5]. It is a mathematical model which aims to recognize patterns in a database. Once the neural network has been trained on samples of the known database, it is able to predict by detecting similar patterns for future input data even if they have never been seen previously. Generally, neural network is an adaptive system which can change its structure based on the external or internal information that flows through the network during the learning phase. Modern neural networks are non-linear statistical data modelling tools. They are usually used to model the complex relationship between the input vector and the output vector, which makes it suitable for the fingerprinting based localization technique.
In this paper, we use the feed-forward network which allows the signals to travel from input to output without feedback. Feed-forward network tends to be straight forward network that associates inputs with outputs. They are extensively ap-plied in pattern recognition applications.
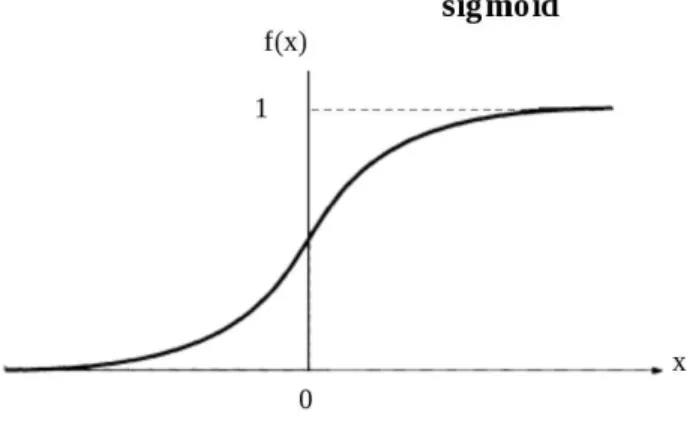
The behaviour of the neural network depends on both the input-output transfer function and the appropriate weights of the neurons which can reduce the error between desired outputs and real outputs. During the learning process, the sigmoid activation function is used to translate the input signal to outputs signal. The value of logistic sigmoid transfer function ranges from 0 to 1 (Fig. 1).
Fig. 1 Sigmoid logistic transfer function.
In order to make neural networks applicable to a specific task, we must choose how the units are connected to one another, and we must set weights on the connections appropri-ately in such a way that the error between the desired output and the real output can be reduced. This learning process requires that the neural networks calculate the error derivative of weights. In other words, it must compute how the error changes as each weight is increased or decreased slightly. The back-propagation algorithm [6] is the most widely used method for determining the error derivative of weights.
Fig. 2 illustrates a back-propagation multilayer network with M layers. Nj represents the number of neurons in jth
layer. Here, the network presents the pth pattern of training sample set with N0 dimensional input Xp1, Xp2, , XpN 0 and
NM dimensional known output response Tp1, Tp2, ..., TpN M.
The actual response to the input pattern by the network is represented as Op1, Op2, ..., OpN M.
As shown in Fig. 3, Yji is the output from the ith neuron
in layer j for pthpattern, W
jik is the connection weight from
kth
neuron in layer j − 1 to ith neuron in layer j, and δ ji is
the error value associated with the ithneuron in layer j.
Fig. 2 Back-propagation network.
Fig. 3 The ith neuron in layer j.
In this paper, with the fingerprinting database built during the training phase, we design a simple neural network with only one hidden layer as shown in Fig. 4, the fingerprint pattern with j different signatures are placed in parallel in the input and the coordinates of the target in 3D are placed in the output. In general, the number of the neurons in the hidden layer is not defined. The more neurons in the hidden layer, the more complexity the system is and of course the longer computation duration is. Usually, we can set the number of the neurons using one of the following rules:
• The number of hidden neurons should be between the
size of the input layer and the size of the output layer.
• The number of hidden neurons should be 2/3 of the size
of the input layer, and should be larger than the size of the output layer.
• The number of hidden neurons should be less than twice
the size of the input layer.
In our work, we define the number of hidden neurons using the second rule.
Fig. 4 Neural networks architecture.
The incremental back-propagation algorithm is applied to calculate and adjust weights for each neuron in the hidden layer. It is a supervised learning method, where weights are updated after each presenting training pattern, which means weights are adjusted many times during a single epoch.
IV. UWB MEASUREMENTCAMPAIGN
The measurement campaign has been done in the framework of the FP7 WHERE project. It has been carried out by the CEA-LETI in the SIRADEL headquarter building in Rennes, France. The aim of this indoor UWB measurement campaign was to collect UWB impulse responses in a same local area. In order to assess small-scale fading, impulse response measure-ments are made on several square grids. The investigation of the measurement campaign is limited to a few selected rooms and offices on the first floor of the SIRADEL building. An overall number of collected profiles has been calculated and saved: 302 (Tx positions) x 4 (Rx positions) = 1208 profiles [7]. The LDPs have been extracted from the profiles and used to establish the fingerprinting database.
In order to ignore the fingerprints that are too noisy due to strong shadowing, Link Quality Indicator (LQI) is defined as the ratio between the maximum signal amplitude and the maximum noise amplitude in dB scale (Estimated during the first five nanoseconds corresponding to a common time slot without any signal). In this paper, we have decided to remove fingerprints extracted from the measurement campaign with LQI less than a threshold of 10dB. The total number of profiles reduces to 165 x 4 = 660 profiles.
V. RESULTS AND DISCUSSIONS
A. Establishment of the fingerprinting database
Fingerprinting databases with different sizes are built to evaluate the influence of the training points density on the positioning performance. Fig. 5 shows the different training and learned points. The training points are plotted with blue circles and represents 20% of all points (165 x 20% = 33 points). The remaining 80% points (in green x markers) with
unknown locations are to be estimated using the learnt neural network. The red diamond markers represent the four anchors with which measurements of LDPs are performed.
Fig. 5 Training and learnt points of the fingerprinting database.
B. Choice of the fingerprint pattern
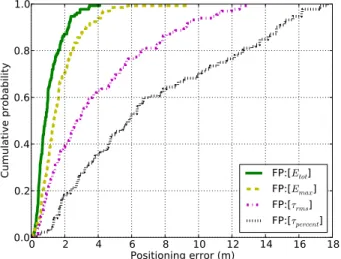
Different fingerprint patterns with different LDPs could be used in the neural network. First, we compare the localiza-tion performances when using different no time referenced available fingerprints (i.e. Etot, Emax, τrms, and τpercent).
For this, we represent in Fig. 6 the different cumulative density functions (CDF) of fingerprinting using these no time referenced fingerprints. This figure shows that the fingerprint Etot can provide the best localization accuracy (90% of the
points can be estimated with the error less than 2 meters). Table II summaries the performances by giving the values of the mean and the standard deviation (Std) of positioning error for all fingerprints.
0
2
4
6
Positioning error (m)
8
10 12 14 16 18
0.0
0.2
0.4
0.6
0.8
1.0
Cumulative probability
FP:[
Etot]
FP:[
Emax]
FP:[
τrms]
FP:[
τpercent]
Fig. 6 CDF of positioning error with different no time referenced available fingerprints.
As discussed above, TOA is a time referenced fingerprint, which can be estimated by setting a proper threshold above the noise floor [8], [9]. Usually, TOA is accurately estimated with a higher precision especially in UWB networks. This high accuracy is very interesting to enhance the positioning accuracy of proposed fingerprinting technique. In order to
TABLE II Summary of fingerprinting performances for dif-ferent fingerprints. Fingerprint Mean (m) Std (m) Etot 1.055 0.765 Emax 1.691 1.290 τrms 3.893 3.291 τpercent 7.122 4.952
enhance the positioning accuracy, the combined fingerprint pattern using both the best no time referenced available fingerprint (i.e. Etot) and the TOA is applied to the neural
networks.
As expected, Fig. 7 shows that TOA outperforms Etot and
that the fusing TOA with Etot fingerprint pattern enhances
the localization accuracy. More than 95% of the estimated points are localised with a positioning error less than 1 meter. Table. III summarises these performances. One can see that the adding TOA to Etotenhances much better the positioning
accuracy than adding Etot to TOA. This is explained by the
fact that TOA is usually much more precise than received signal strength indicators (i.e. Etotor Emax). Both actual and
estimated points using the combined fingerprint pattern of Etot
and TOA are shown in Fig. 8.
0.0 0.5 1.0 1.5 2.0 2.5 3.0 3.5 4.0 4.5
Positioning error (m)
0.0
0.2
0.4
0.6
0.8
1.0
Cumulative probability
FP:[
Etot]+[
TOA]
FP:[
TOA]
FP:[
Etot]
Fig. 7 CDF of positioning error for simple and combined fingerprint patterns.
TABLE III Summary of fingerprinting performances for simple and combined fingerprint patterns.
Fingerprint Mean (m) Std (m) Etot 1.055 0.765
T OA 0.455 0.297 Etot+ T OA 0.377 0.255
Since it is interesting for operators to reduce complexity and resource consumptions, exploitation of TOA estimates must be reduced as much as possible because they consume much resources and cause overhead [10]. Besides, RSSI related
Fig. 8 Actual vs. estimated positions using Etot and TOA.
fingerprints are usually available without any additional costs. For these reasons, a promising localisation scheme consists in using all available RSSI based fingerprints (i.e. Etot) and
reducing the number of TOA. This scheme seems to be a very interesting opportunistic localization scenario.
In order to show the effect of fusion of RSSI with TOA on positioning accuracy, we assume all four Etotfingerprints are
available and we gradually increase the number of additional TOAs. Fig. 9 plots the CDFs of positioning error over the area with respect to the number of added TOAs. The evolution of average positioning error with respect to the number of added TOAs is shown in Fig. 10. These two figures show a gradual enhancement provided by increasing the number of used TOA. Nevertheless, adding some TOA may deteriorate the localization accuracy. For example, the fusion of Etotwith
only one TOA (i.e. RSSI+1TOA) case which is represented in red line. This can be explained by the fact that some fingerprints are very imprecise or that they come from a misplaced device with respect to other devices.
0.0 0.5 1.0 1.5 2.0 2.5 3.0 3.5 4.0 4.5
Positioning error (m)
0.0
0.2
0.4
0.6
0.8
1.0
Cumulative probability
FP:[RSS+4TOA]
FP:[RSS+3TOA]
FP:[RSS+2TOA]
FP:[RSS+1TOA]
FP:[RSS]
Fig. 9 Effect of gradually adding TOA to RSSI fingerprints.
C. Size of the fingerprinting database
Besides the choice of the fingerprint pattern, the size of the fingerprinting database is also an important parameter which can influence the positioning accuracy. Using the Etot based
0.0
0.5
1.0
Number of added TOA
1.5 2.0
2.5
3.0
3.5 4.0
0.4
0.6
0.8
1.0
1.2
Average positioning error
Fig. 10 Average positioning error with respect to the number of added TOAs.
fingerprint pattern, Fig. 11 plots the CDFs of the positioning error with respect to the different sizes of the fingerprinting database. It shows that generally, the accuracy of localization tends to be better with the increasing of the size of the finger-printing database. However, when the fingerfinger-printing database reaches a given size, the technique tends to perform the same positioning accuracy, with no significant improvement. Table. IV presents the statistical positioning errors using different sizes of the database.
0
1
2
Positioning error (m)
3
4
5
6
7
8
0.0
0.2
0.4
0.6
0.8
1.0
Cumulative probability
50% 25% 20% 10%Fig. 11 CDF of positioning error using different sizes of the fingerprinting database.
VI. CONCLUSIONS ANDPERSPECTIVES
This paper has presented a measurements- and simulations-based study of a fingerprinting technique simulations-based on neural net-works and Ultra-wideband signals. The proposed technique is based on the construction of a fingerprinting database of LDPs
TABLE IV Summary of fingerprinting performances with respect to the database size.
Size of the database Mean (m) Std (m) 10% 1.373 1.266 20% 1.055 0.765 25% 0.994 0.614 50% 0.962 0.596
extracted from an UWB measurement campaign. The feed-forward neural network with incremental back-propagation algorithm is used to learn the database and to locate the targeted positions. Different types of fingerprints and different sizes of the fingerprinting database are considered to evaluate the positioning performance. Simulations have shown that RSSI-based fingerprint can provide good localization accuracy and that the fusion of very precise TOA fingerprints can drastically improve the positioning accuracy. In addition, we have shown that increasing the number of learnt points does not mean usually to enhance performances. A fair database size is sufficient to reach the best performances. Future work consists in using Motley Keenan Multiwall model and ray tracing techniques to replace measured by simulated databases .
ACKNOWLEDGMENT
This work has been performed in the framework of the ICT project ICT-248894 WHERE2, which is partly funded by the European Union.
REFERENCES
[1] H. Liu, H. Darabi, P. Banerjee, and J. Liu, “Survey of wireless indoor positioning techniques and systems,” IEEE Transactions on Systems, Man, and Cybernetics, vol. 37, no. 6, pp. 1067–1080, Nov. 2007. [2] S Gezici and H.Vincent Poor, “Position estimation via ultra-wideband
signals,” Tech. Rep., Department of Electrical and Electronics Engineer-ing, July 2008.
[3] A. Hayar, H. Anouar, and B. Zayen, “Performance analysis of some fingerprinting based localization techniques using uwb signaling,” IEEE Information Theory Winter School, Mar. 2009.
[4] A. Taok, N. Kandil, S. Affes, and S. Georges, “Fingerprinting lo-calization using ultra-wideband and neural networks,” International Symposium on Signals, Systems and Electronics, ISSSE, pp. 529–532, July 2007.
[5] M. Heidari, F.O. Akgul, N.A. Alsindi, and K. Pahlavan, “Neural network assisted identification of the absence of direct path in indoor localization,” Global Telecommunications Conference, pp. 387–392, Nov. 2007.
[6] B.K. Heung, H.J. Sung, G.K. Tag, and P. Kyu, “Fast learning method for back-propagation neural network by evolutionary adaptation of learning rates,” Neurocomputing, pp. 101–106, 1996.
[7] ICT-217033 WHERE Deliverable D4.1, “Measurements of location-dependent channel features,” Tech. Rep., 2008.
[8] D. Dardari, C.C. Chong, and M.Z. Win, “Analysis of threshold-based toa estimators in uwb channels,” Proceedings of 14th European Signal Processing Conference (EUSIPCO ’06), Sept. 2006.
[9] I. Guvenc and Z Sahinoglu, “Threshold-based toa estimation for impulse radio uwb systems,” Tech. Rep., Mitsubishi Electric Research Laboratories, Dec. 2005.
[10] M. Laaraiedh, L YU, B. Uguen, and S. Avrillon, “Comparison of hybrid localization schemes using rssi, toa, and tdoa,” 17th European Wireless Conference, Apr. 2011.