HAL Id: hal-00881666
https://hal-mines-paristech.archives-ouvertes.fr/hal-00881666
Submitted on 23 Mar 2017
HAL is a multi-disciplinary open access
archive for the deposit and dissemination of sci-entific research documents, whether they are pub-lished or not. The documents may come from teaching and research institutions in France or abroad, or from public or private research centers.
L’archive ouverte pluridisciplinaire HAL, est destinée au dépôt et à la diffusion de documents scientifiques de niveau recherche, publiés ou non, émanant des établissements d’enseignement et de recherche français ou étrangers, des laboratoires publics ou privés.
Application of the morphological ultimate opening to
the detection of microaneurysms on eye fundus images
from a clinical database
Xiwei Zhang, Guillaume Thibault, Etienne Decencière
To cite this version:
Xiwei Zhang, Guillaume Thibault, Etienne Decencière. Application of the morphological ultimate opening to the detection of microaneurysms on eye fundus images from a clinical database. 13th International Congress of Stereology (ICS’13), Oct 2011, Pékin, China. �hal-00881666�
APPLICATION OF THE MORPHOLOGICAL ULTIMATE OPENING TO
THE DETECTION OF MICROANEURYSMS ON EYE FUNDUS IMAGES
FROM A CLINICAL DATABASE
X.W. Zhang1, G. Thibault1, and E. Decencière1
1 Center for Mathematical Morphology, département mathématiques et systèmes, MINES ParisTech, Fontainebleau, France ABSTRACT
Diabetic Retinopathy (DR) is a severe disease which can cause blindness. OPHDIAT is a telemedicine network for DR mass screening, which has gathered thousands of clinical high resolution color eye fundus images. The TELEOPHTA project has been launched in order to develop a computer aided diagnosis system of DR, which aims at performing a preliminary analysis of the OPHDIAT images in order to filter most images corresponding to healthy eyes. Microaneurysms (MAs) are likely to be the lesions present at the earliest stage of the disease. In this paper, a new method of MAs detection, using the recently proposed ultimate opening, is presented. The proposed method does not use any supervised classification, while provides a competitive and efficient way to detect MAs, especially for our clinical database. Further improvements may be brought through the accurate detection of the retinal elements and other retinal diseases, or through the estimation of the image quality.
KEYWORDS: Diabetic retinopathy; Microaneurysm detection; Mathematical morphology; Ultimate opening; Clinical eye fundus images
INTRODUCTION
Diabetes is a huge threat to human health, while, as a complication of diabetes, Diabetic Retinopathy (DR) is the leading cause of blindness for people between 25 and 65 years. Tremendous work has been done for the research of automated analysis methods of eye fundus images. But few of them show reliable results on clinical databases. Considering the increasing number of patients, and the decreasing number of ophthalmologists, mass screening has to be somehow accelerated in order to constitute a long term solution. The TELEOPHTA project has been launched in order to develop an automated computer aided diagnosis system of DR. The project includes several important stages: 1. Collection of clinical fundus images and manual annotation of related lesions on a subset of images. 2. Development of image analysis methods for the detection and segmentation of major retinal structures (vessels, optic disc, macula) and of main lesions (microaneurysms, exudates, hemorrhages, etc.). 3. Development of statistical learning methods that classify images into two classes: healthy images, and images to be sent to the specialist. 4. Software development and integration of all developed methods.
Figure 1: Fundus images examples from the OPHDIAT database
The telemedicine network OPHDIAT has been established by the Assistance Publique – Hôpitaux de
Paris (AP-HP) for the diagnosis of DR in 2004. Some
20000 recent examinations, corresponding to more than 100000 images, have been extracted from the OPHDIAT database and anonymized, to build the TELEOPHTA database. A subset of 300 images is annotated by an ophthalmologist in order to provide an expert advice on the position of pathologies. OPHDIAT is a clinical database used in real conditions, rather than a well-defined digital image processing dedicated database. The images are taken in different screening centers with different types of cameras. As we see in Figure 1, the images are diverse, and show important size, color, illumination, contrast, and quality
variations. Currently, 6 different image sizes are present on the database, ranging from 1440960 to 25441696 pixels. All images are in JPEG compressed format, which causes problems for image processing due to compression artifacts.
This paper will concentrate on the detection of Microaneurysms (MAs). MAs are dilations of the venous end of retinal capillaries. Their sizes vary mostly between 10 and 100μm, but do not exceed 125μm. In color retinal images, they appear as little dark red dots (or dark dots in the green channel). They do not touch visible blood vessels. Figure 2 shows 5 MAs. Since they constitute the first sign of DR, the detection of MAs plays a crucial role in the whole work and is always a hot issue of automated retinal image analysis.
Figure 2: Examples of microaneurysms (green channel)
STATE OF THE ART
A large amount of literature can be found on the detection of MAs. Most of the proposed methods have three steps: Pre-filtering, extraction of candidates and classification. Niemeijer et al. [9] use the residue of a local median filter to get candidates. False detections are first removed by segmented retinal structures and a kNN classifier is used to get the final results. In a recent work, Quellec et al. [10] propose a method based on wavelets. A model of MA is designed in the sub-band of the image of wavelet transform by using a 2D gaussian function. The remarkable thing is that they also assign a probability to each MA in the result, which is quite flexible and useful to study the performance of the algorithm. Walter et al. [4] propose a method based on mathematical morphology. The morphological Top-hat of closing by diameter is used to get candidates. This method will be described and
discussed in the following section, as it is used as starting point in the present work. After removing those candidates located close to retinal structures, a kNN classifier is used to obtain the final results.
Although many different algorithms have been proposed, the detection rate always remains unsatisfactory. Most of the algorithms were tested with small databases, or large databases with similar good quality images. The OPHDIAT database contains a huge amount of heterogeneous images. None of the algorithms in the literature are suitable. So a new method for MAs detection is proposed.
METHODS
The following sections will be illustrated thanks to Figure 4.a, which contains five MAs annotated by an ophthalmologist, as shown in Figure 2.
Preprocessing
As discussed before, the resolution of the images remains unknown. In order to determine the parameters of the algorithms, for example the size of the structuring element, we separate the region of interest (ROI), which is disk-shaped, from the dark image background. Given that all the images have been acquired with the same angle (45°), the width of the ROI is used to estimate the size of the pixels. For example, on an image of size 1440960 pixels, the maximal MA diameter is 10 pixels.
It should be noted that since the method proposed for the detection of MAs are mostly based on residues, the problem of global non-uniform illumination is largely avoided. Moreover, most non-uniform illumination correction methods would introduce or amplify the background noises, especially in dark regions. Here, we introduce a background noise removal method based on a morphological flooding.
The detection of MA is made difficult by the presence of dark noise (including compression artifacts), and dark anatomical structures, mainly vessels. Dark noise is similar to MAs, but normally has smaller size and lower contrast. Vessels can be removed from the image using a vessel detection method.
In order to remove dark noise, we have used a flooding approach. We denote the original green
channel image Iorig. The first operation is achieved by reconstructing Iorig h over Iorig . The result is denoted by Ifl h, . The depth h is empirically
determined. The minima which are not completely flooded are then restored with another reconstruction. We denote the result Ifl. This process is illustrated in Figure 3.a and 3.b, where we have four regional minimums, of which b and c represent background dark noise, while d is a MA. Region a is a MA-liked structure caused by bright regions, which will be discussed afterwards. After the first flooding, lakes b and c are no more regional minimums, while lakes a and d remain. Using a and d as markers, a second flooding will restore them to their original shapes.
Figure 3: a) Original image Iorig b) Minima filtering based on flooding Ifl
c) Maxima filtering based on opening by reconstruction Iop d) Final result pre
I
Some bright regions in retinal images (like reflections or bright lesions) can create structures similar to MAs. We filter these structures by means of an opening by reconstruction, as illustrated in Figure 3.c and 3.d. Figure 4.b shows the result of the preprocessing on our test image, denoted by Ipre. Candidate extraction
The first step is to roughly extract the MAs candidates. Several methods are compared and a new method is proposed, based on geodesic attribute thickenings, a new powerful morphological filter recently proposed by Morard et al. [3]
a b
c d
e f
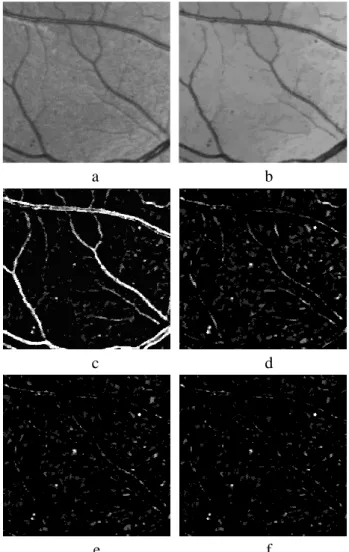
Figure 4: a) Original green channel image Iorig b) Results of preprocessing pre
I c) Difference between the Gaussian enhanced image and Ipre d)
Difference between the area closing and Ipre e) Residue between closing
by diameter and Ipre f) Difference between geodesic diameter thickening
and Ipre
Methods based on matched filters, such as 2D Gaussian filters, are commonly used to enhance certain shape structures, such as MAs [1] [2]. Figure 4.c shows the residue between the Gaussian enhanced image and the Ipre. We can see that MAs are well extracted, but that numerous spurious structures have been kept. Other commonly used methods include morphological filters [4] [5]. The advantage is that they can do a selection between the shapes and an analysis for connected components (CCs). Let us first see the opening by area and the opening by diameter in binary images. The area opening keeps all the CCs whose area is larger than a value :
|
A x X x x A C X (1)In this definition, A( ) is the area opening with size
. A( ) gives the area of the CC. Cx( ) is the CC of X containing x . Another similar operation is the opening by diameter. It will keep all the CCs whose b c d orig I h
Iorig orig I ero f
fl I Marker a b c d a pre I h
diameter is larger than a value . Here, by diameter we mean the maximal extension of a CC, defined by:
X maxx y X, x y (2)
Therefore the opening by diameter with size is given by:
|
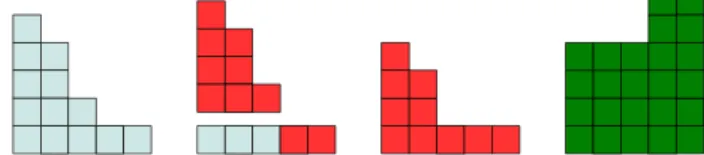
D x X x x C X (3)As shown in Figure 5, objects A and B have the same area, but different diameters. This means that the area opening cannot tell the difference between them, but the opening by diameter can. In our case, it means that using the area attribute will keep more vessels in the result, which is not desirable. Figure 4.d and 4.e show the difference between them.
Figure 5: Opening by different attributes: area, diameter and geodesic length
However, an elongated shape might have the same area and diameter as a round shape, as illustrated in Figure 5, where object C has the same area and diameter as A. Morard et al. [3] introduced a new attribute thinning, based on the geodesic diameter, to solve this problem. Consider a connected component X . For any two points x , y of X , dX x y( , ) is the geodesic distance between them inside X (i.e. the length of a geodesic arc linking x and y ). Then:
maxx y X,
,L X dX x y (4)
is the geodesic diameter of X . As previously, we can build an operator which deletes all connected components of a set X , whose geodesic length is smaller than a value:
|
L x X x x L C X (5)However, given that the criterion “geodesic length larger than ” is not increasing, we do not obtain an opening, but a thinning, denoted by L( ). Using this criterion, object C in Figure. 5 can be separated from the others. The binary operations can be extended to grey level images by stacking the result of each binary opening, calculated from each threshold of the image. For details the reader is referred to [3]. As shown in Figures 4.d, 4.e and 4.f, the residue of the geodesic diameter thickening (i.e. the dual of the thinning) provides the best result for our application. All MAs are
included in the result, while reducing the number of unwanted structures.
Ultimate Opening
Before starting the selection of candidates, we will use the ultimate opening in order to only keep candidates with appropriate contrast and shape.
The ultimate opening has been introduced by Beucher [6]. It analyses the evolution of each pixel of a gray scale image by using a family of openings of increasing sizes. The differences between consecutive openings are considered. For each pixel, it keeps the largest difference denoted R. It also keeps the size of
the opening corresponding to the largest difference, denoted q. If I is a gray scale image, an ultimate
opening can be defined as:
I I:
R I q I
,
(6)
max
, 1 R I r I (7) where r
I I 1
I
max{ 1
}, if
0 0, 0 |r R R q R I I I I (8)where ( ) {0,1, , }N is an increasing family of openings. Figure 6 illustrates this procedure.
Figure 6 Ultimate Opening. From left to right: profile I, differences between openings, R and q
Figure 7 Ultimate Opening with 1. From left to right: profile I , differences between openings, R and q
Retornaz et al. [11] [7] used it for text detection and combined the concept of attribute opening with the ultimate opening. Moreover, they proposed a generalization based on the accumulation of residues, named -attribute opening, which is used in our case. This accumulation integrates the residues corresponding to small attribute changes. From the original definition of the ultimate opening, small
a b c d e 5 4 3 2 1 5 3 2
Gray level Size of opening
a b c d e a b c d e a b c d e 1
( )A
variations of contrast will be replaced by the biggest difference of openings. But a attribute allows keeping the most contrasted structures, while accumulating the small changes, if they satisfy the criterion: the difference between the openings of size
i
and i1, with | i i1| , is not empty. The
definition of r (Equation 7) is replaced by:
1 0, ) ) ( ) ) ) ), if not ( ( ( ( ( I I r I I I r I (9)
Figure 7 shows the same profile of Figure 6 but with
-attribute, while 1. The differences of openings between 1 to 3 are not empty. So they are accumulated. But 4( )I 5( )I , the accumulation
stops. We can compare the R and q in two
different ultimate opening and see the difference. Hernández et al. [12] [8] used ultimate opening for facade segmentation and combined a shape factor function f( i, ref) within the residue computation to calculate the similarities between two shapes. i is the shape of CCi and ref is a reference shape. A shape here means a series of geometric features and their relations (height, width, fill ratio, circularity, etc.): The definition of r is replaced by:
( i, ref)
r f r (10)
where r is the residues operation with shape
information. If r here is replaced by r (see
Equation 9), ultimate opening can do a selection not only in contrast but also in shapes.
a b
c d
Figure 8 a) A MA in residue image IRes b) General profile of MAs c) and d)
Profile of MA and noise (blue) and corresponding result of ultimate opening ( )
R I with 2 (red)
Candidate selection
After the extraction of candidates, we get a residue image IRes containing all MAs and noise. Figure 8.a shows a MA in IRes with contrast enhanced for a good
vision. Figure 8.b shows a general MA profile, in red, and a quantified model in blue squares. Here, we can get two characterizations of MAs. Firstly, they should be circular, or at least symmetric with respect to their center. Secondly, they have a relatively sharp and gradually decreasing border. In ultimate opening, the shape attribute can be adapted to the shape of MAs and the accumulation attribute could enhance the gradually decreasing border of MAs, thus to select MAs in the candidates.
a b
c d
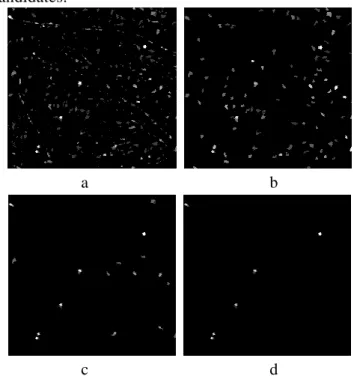
Figure 9 a) Residues of Top-hat by geodesic diameter thickening IRes b)
Result of ultimate opening IUO c) Result of removing one stage candidates S
I d) Final result IF
We take the image produced by the geodesic diameter thickening IRes , shown in Figure 9.a, and apply to it the ultimate opening. Here we only take the residues R I( ), shown in Figure 9.b, denoted by IUO . Some noise is removed and MAs-like structures are kept and enhanced. Figure 8.c and 8.d show the result of the ultimate opening on two similar structures. The first one is a MA profile. The second one corresponds to an artifact, which could come from a vessel fragment or background noise. Since the accumulation attribute can distinguish gradual changes, if we set 2, the differences of the first structure have been accumulated. But the second structure does not satisfy the criterion. So the residue of the second structure is totally flat, or we can say, it only has one stage. This kind of candidates are removed, as shown in Figure 9.c, denoted by IS. In the end, a threshold is applied to get a MA
I R2(IMA)
N
final result IF, as shown in Figure 9.d. Compared to Figure 2, the manual annotation of the MAs, all MAs are detected. The only false detection in the left up corner is created by vessels. Further improvement can be achieved by removing retinal vessels, once they are precisely segmented.
RESULTS AND CONCLUSIONS
In this paper, we have presented a new MA detection method, designed for clinical databases. Firstly, we have proposed a morphological flooding as preprocessing. Secondly, microaneurysms (MAs) candidates are obtained thanks to the combination of a geodesic attribute thickening with an ultimate opening.
Given the complexity of the database, we have not been able to find a single optimized set of parameters for the whole database. The main task still to be done is to develop an automatic parameterization method, based on the image to be processed. Several possibilities are currently being studied in order to achieve this goal, such as the estimation of the image quality, or normalization of the input images.
In parallel, a vessel segmentation method is being developed. Indeed, state of the art methods produce bad results on the OPHDIAT database, therefore a more robust method is needed.
ACKNOWLEDGEMENTS
This work has been financed by the French Agence Nationale de la Recherche, through the TECSAN program. The authors want to thank the TeleOphta partners: P. Massin, A. Chabouis and A. Erginay from Assistance Publique - Hôpitaux de Paris; G. Cazuguel, M. Lamard and G. Quellec from Telecom Bretagne; and B. Lay and R. Danno from ADCIS.
REFERENCES
[1] JH. Hipwel, F. Strachan, JA. Olson, KC. McHardy, PF. Sharp, JV. Forrester, “Automated Detection of Microaneurysms in Digital Red-free Photographs: a Diabetic Retinopathy Screening Tool”, Diabetic medicine, Vol.17, pp.588-594, 2000.
[2] B. Zhang, L. Zhang, J. You, F. Karry, “Microaneurysm (MA) Detection via Sparse Representation Classifier with MA and
Non-MA Dictionary Learning”, IEEE, International
Conference on Pattern Recognition, pp.277-280, 2010. [3] V. Morard, E. Decenciere, P. Doklada, “Geodesic Attributes
Thinnings and Thickenings”, Mathematical Morphology and
Its Applications to Image and Signal Processing, pp.200-211, 2011.
[4] T. Walter, P. Massin, A. Erginay, R. Ordonez, C. Jeulin, J.C. Klein, “Automatic Detection of Microaneurysms in Color Fundus Images”, Medical image analysis, Vol.11, pp.555-566, 2007.
[5] T. Spencer, J.A. Olson, K.C. McHardy, P.F. Sharp, J.V.
Forrester, “An Image-Processing Strategy for the
Segmentation and Quantification of Microaneurysms in Fluorescein Angiograms of the Ocular Fundus”, Computers and biomedical research, Vol.29, pp.284-302, 1996.
[6] S. Beucher, “Numerical residues, Mathmatical orphology: 40 years on”, pp.23-32, 2005.
[7] T. Retornaz, B. Marcotegui, “Scene Text Localization Based on the Ultimate Opening”, International Symposium on Mathematical Morphology, Vol.1, pp.177-188, 2007. [8] J. Hernandez, B. Marcotegui, “Segmentation of Facade
Images Using Ultimate Opening”, Technical report, CMM-Mines ParisTech, 2007.
[9] M. Niemeijer, B. Van Ginneken, J. Staal, M.S.A. Suttorp-Schulten, M.D. Abramoff, “Automatic Detection of Red Lesions in Digital Color Fundus Photographs”, IEEE Trans, Medical Imaging, Vol.24, pp.584-592, 2005.
[10] G. Guellec, M. Lamard, P.M. Josselin, G. Cazuguel, B. Cochener, C. Roux, “Optimal Wavelet Transform for the Detection of Microaneurysms in the Retina Photographs”, IEEE Trans, Medical Imaging, Vol.27, pp.1230-1241, 2008. [11] B. Marcotegui, J. Hernandez, T. Retornaz, “Ultimate Opening
and Gradual Transition”, Mathematical Morphology and Its Applications to Image and Signal Processing, pp.166-177, 2011.
[12] J. Hernandez, B. Marcotegui, “Ultimate Attribute Opening Segmentation with Shape Information”, Mathematical Morphology and Its Application to Signal and Image Processing, pp.205-214, 2009