HAL Id: hal-01737093
https://hal-mines-albi.archives-ouvertes.fr/hal-01737093
Submitted on 16 Aug 2018
HAL is a multi-disciplinary open access
archive for the deposit and dissemination of sci-entific research documents, whether they are pub-lished or not. The documents may come from teaching and research institutions in France or abroad, or from public or private research centers.
L’archive ouverte pluridisciplinaire HAL, est destinée au dépôt et à la diffusion de documents scientifiques de niveau recherche, publiés ou non, émanant des établissements d’enseignement et de recherche français ou étrangers, des laboratoires publics ou privés.
study on the mutual influences of the gases and their
effects on the char reactive properties
Chamseddine Guizani, Francisco Javier Escudero Sanz, Sylvain Salvador
To cite this version:
Chamseddine Guizani, Francisco Javier Escudero Sanz, Sylvain Salvador. Gasification of wood-char particles with CO2 and H2O : study on the mutual influences of the gases and their effects on the char reactive properties. 5th International Conference on Engineering for Waste and Biomass Valorisation (WasteEng 2014), Aug 2014, Rio de Janeiro, Brazil. pp.587-599. �hal-01737093�
Gasification of wood-char particles with CO
2and H
2O: study on the mutual
influences of the gases and their effects on the char reactive properties
C. GUIZANI*, F.J. ESCUDERO SANZ, S. SALVADOR
RAPSODEE, Mines Albi, Route de Teillet, 81013 ALBI CT Cedex 09, France *Corresponding author: guizani.c@gmail.com, 0033563493241.
Abstract
The effect of CO2 on the char gasification rate was investigated in the case of char particles. The conclusions on its effects on the char reactivity differ from a study to another [1] [2]. The aim of the study was to find more about the effects of CO2 as a gasifying media when introduced together with steam into a gasifier. The results show that the char reactivity at 900°C in mixed atmospheres of 20% H2O + 20% CO2 in nitrogen can be expressed as the sum of the single reactivities. Gas alternation gasification experiments (in which reactive atmosphere is switched at a certain conversion level from a gas to a second one) done with CO2 \ H2O showed no influence of a first gasification atmosphere on the char reactivity under the second one. Char reactivity always fits to the value under pure atmosphere at the same conversion level and it seems to be only “conversion dependent”.
This observation was valid in both directions, so that alternating the gasification medium during the gasification from CO2 to H2O and vice-versa, once or several times along the conversion, showed that the char reactivity to a specific gas at a certain conversion level was the same as if the gasification reaction was operated from the beginning with the same atmosphere composition. We analyzed this lack of influence of previous gasification conditions on the char reactivity through characterisation of the chars throughout the conversion as well as by means of transport limitation analysis based on the Thiele modulus. 1- INTRODUCTION
In contrast with the huge amount of work done in the last decades on the char gasification in a single atmosphere of H2O or CO2, very few studies deal with the gasification of biomass or coal char in a mixed atmosphere of carbon dioxide and steam. The related conclusions to the effect of such complex atmosphere differ from a study to another. Several authors assume that adding the carbon dioxide to the steam slows down the gasification reaction, whereas others think that it enhances it. Several models are proposed in accordance with these conclusions where in the two gases are whether reacting on separate active sites (additivity) or competing for the same ones (common active sites). Others found that there is an active cooperation (Synergy) between the two gases.
Groeneveld and Van Swaaij studied the wood char gasification reaction in a mixture of H2O and CO2. They proposed a simple additivity model [3]
Maria Barrio and co-workers [4] performed experiments of wood char gasification in a steam carbon dioxide mixture to check its effects on the reaction rate. They built a more complex model and conclude that the carbon conversion is mainly due to steam gasification meanwhile the carbon dioxide, which is less reactive, has potentially another role when it is injected as a co-reactant with steam but in any case would inhibit the gasification reaction.
In 2008, Tagoutchu et al. [5] observed a synergy between steam and the carbon dioxide when mixed together as a gasifying agent
The gasification of large variety of biomass samples was investigated in a TG apparatus with a heating rate of 10°C/min up to 1000°C using steam, carbon dioxide or a mixture of both reactant as a gasification medium [6]. The authors observed that regardless of the biomass type, introducing CO2 with a minimum amount of 30 % next to steam into the flow stream resulted in a complete char burnout with a light mineral film remaining in the crucible, whereas a black char residue remains when using only steam as a gasification medium. Similar findings are exhibited elsewhere [7] for the gasification of various biomass samples in a TG apparatus up to a temperature of 750°C with a heating rate of 10°C/min. The CO2-H2O gasification environment led to a more enhanced pore structure and surface area development than with only steam as a gasification medium.
Susana Nilsson et al. studied the gasification of dried sewage sludge (DSS) [8] and olive tree pruning [9] chars in a pilot fluidized bed reactor under CO2, H2O and their mixtures. In both cases an additivity model represented properly the results
Present work is focused on the influence of one reactive atmosphere on the char structure and properties, and how this affects its reactivity towards a second reactive atmosphere.
2- MATERIALS AND METHODS 2.1- Low Heating Rate chars preparation
The raw biomass samples are beech wood spheres of a 20 mm diameter. Low Heating-rate chars were prepared by a slow pyrolysis of the wood spheres under nitrogen. The pyrolysis was performed in a batch reactor. The wood spheres were placed in a Platinum disk spaced enough to avoid chemical and thermal interactions. The plateau was introduced in the furnace heated zone which was progressively heated under nitrogen from room temperature to 900°C at 5°C/min. The chars were kept for 1 h at the final temperature, cooled under nitrogen and stored afterwards in a sealed container. The low heating rate is expected to ensure a good temperature uniformity in the wood particle and to lead to a quite homogeneous wood-char, from the structural and chemical viewpoints, as demonstrated by [10][11]. During the pyrolysis reaction, the char particles shrink and get an ovoid form. The mean particle diameter, calculated as the average of the three particle dimensions was estimated at 13 mm. Some of the 13 mm char particles were afterwards ground with a mortar and a pillar. Several particle size fractions, on a wide particle size range from 0.04 mm to 13 mm, were retained for gasification experiments: char particles of 0.04 mm (char004), 0.2 mm (char02), 0.35 mm (char035) and 1 mm (char1) screen size.
2.2- Char gasification experiments in H2O, CO2 and their mixture
The Macro-TG experimental device:
The M-TG device is described in detail in our previous work on char gasification in mixed atmospheres of CO2 and H2O [12]. In general terms, the experimental apparatus consists of a 2-m long, 75-mm i.d. alumina reactor that is electrically heated, and a weighing system comprising an electronic scale having an accuracy of ± 0.1 mg, a metallic stand placed over the scale on which a 1 m long, 2.4 mm external diameter hollow ceramic tubes is fixed. The ceramic tube holds the platinum basket in which the biomass particles are placed. The gas flow rates are controlled by means of mass flowmeters / controllers. The gas flow inside the reactor is laminar and flowing at an average velocity of 0.20 m/s.
The gasification procedure:
The platinum support containing the char is introduced in the furnace under a nitrogen flow. The char is kept 5 min under nitrogen before starting the gasification. During this period the char loses mass, probably in the form of steam and light gases, which are released due to the thermal shock. The mass loss was less than 6%. This period is sufficient for the establishment of a thermal equilibrium between the weighing system, the furnace and the surrounding gases. Afterwards, the gasification medium is introduced. The char gasification experiments were performed with CO2, H2O and their mixtures.
Operating conditions:
The operating conditions in terms of temperature and atmosphere composition for the different char gasification reactions including single atmosphere gasification reactions, mixed atmosphere gasification and gas alternation experiments are listed in Table 1.
Samples CO2 gasification H2O gasification Mixed atmospheres Gas alternation
Char004 900°C-0.2atm 900°C-0.2atm - - Char02 900°C-0.2atm 900°C-0.2atm 900°C-
0.2+ 0.2 atm
900°C- 0.2/ 0.2 atm Char035 900°C-0.2atm 900°C-0.2atm - -
Char1 900°C-0.2atm 900°C-0.2atm - - Char13 900°C-0.2atm 900°C-0.2atm 900°C-
0.2+ 0.2 atm
900°C- 0.2/ 0.2 atm Table 1: Operating conditions
2.3- Reactivity modeling
In the present work, we adopted a reactivity modeling approach based on the Thiele modulus in order to characterise the gas diffusion inside the porous char and determine the class of pores (micropores, mesopores, macropores) which is the most influencing during the gasification with H2O and CO2.
The char apparent reactivity towards a gas can be expressed following: !(!)= − !1 !(!) !!!(!) !" = !1 1 − !! !!!(!) !" Where X is the conversion level given by:
!(!) =
!!(!)− !(!) !(!)− !(!"!)
Where m0, m(t) and mash are respectively the initial mass of char, the mass at any time “t” and the mass of the residual ash.
If the gasification reaction is performed in the chemical regime, (relatively low temperature and small particle size) the calculated reactivity would be the intrinsic one. The char reactivity depends on the operating conditions (temperature and reactant gas pressure), and char properties (texture, mineral content, structure). It is thus commonly expressed as the product of reference reactivity R !"#$ (!,!!) (depending on the temperature and reactant gas pressure) and a structural term f(X) accounting for the char properties evolution along the conversion. Owing to the difficulties in the monitoring of the intrinsic char properties along the conversion, the structural term is usually an empirical correlation where the conversion level appears as the sole variable. Changes in the char intrinsic properties are implicitly described by this empirical term. The reference reactivity corresponds to a specific conversion level. Reference reactivity at 10% or 50% of conversion has been used in the literature [13] [4]. The reactivity at 50% conversion level R (50) is the most frequently used as a reference value. The reactivity at any gasification stage can be thus expressed as:
!(!)(!,!!"# !) = !
(!")(!,!!)
!"# !!(!)
Where !(!")(!,!!"# !) is the intrinsic reactivity at X=50% and f(X) is the structural function describing the evolution of the char properties during the gasification. Nth-order kinetics are often used to express the temperature and CO2 pressure dependence of!!(!")(!,!!"# !). By assuming Arrhenius-type kinetics for the kinetic constant, the intrinsic reactivity can have the following expression:
!(!")(!,!!"# !) = !
!!!!!!(!)!!!!
Where M!! is the carbon molecular weight, S!!is the reactive surface (m2.kg−1), k(!)! the kinetic
rate constant of char gasification (mol.s−1 .m−2
.atm−n
) and P!!!the reacting gas partial pressure at
the particle surface (atm).
For macroscopic char particles, there exist diffusional limitations. One can no longer speak about a volumetric reaction rate (intrinsic), as the gas concentration inside the particle is not uniform. In this kind of situation there is a competition between gas diffusion and reaction inside the char particle. To model such a situation, one must solve the gas mass and energy conservation equations along the reaction to obtain the gas concentration profiles at any time and any location in the particle [14]. Although it is rigorous, numerical modeling requires too high computing capacities. There exist alternative methods for formulating the apparent gasification reaction rate. Amongst the alternatives, one can use the effectiveness factor approach to take into account the diffusion-reaction competition [15] [16] [17] [18]. We will use this method in the present work to account for diffusional limitations when varying the char particle size.
The effectiveness factor approach originates from the catalyst theory. To identify whether there’s a diffusion-reaction competition, Thiele [19] defined an effectiveness factor η. It is the ratio of the apparent reaction rate to the intrinsic one. It allows taking into account the consumption of the reactant gas while it diffuses inside the porous particle. It is equal to unity
in the absence of diffusional limitations and tends toward zero in the presence of high diffusional limitations. Using the effectiveness factor, the apparent reactivity reads:
!(!")(!,! !)
!"" = !!!
(!")(!,!!)
!"# !
Reaction order of biomass char gasification differs from a study to another. In Di Blasi’s review, CO2 char gasification reaction order varies between 0.36 and 1.2, and H2O char gasification reaction order is comprised between 0.4 and 1[20]. When using the effectiveness factor approach to model the effect of LHR char gasification, we will consider the gasification reactions as first order reactions. The definition of the effectiveness factor is rigorous only for a first order reaction. The effectiveness factor expression is obtained by volume integration of the reactant gas balance equation and has the following expression for spherical particles:
! = 3 ! 1 !"#ℎ !− 1 ! The Thiele modulus Φ has the following expression:
Φ =!!"#$ 2
!!!!!!(!)!!!
!!!!!""!!!
Where d!"#$ is the particle diameter (m), β is a stoichiometric coefficient equal to ratio
between the gas molar mass and that of carbon, Sv is a volumetric surface (m2 /m3
), M! is the
molecular weight of the reactant gas (kg.mol−1
), C! the bulk concentration of the reactant
gas(mol.m−3
), !D!""!is the effective diffusion coefficient (m2/s).
For a gas “i” (CO2 or H2O), !Di!"" is expressed through the molecular diffusion coefficient
!Di!"# and the Knudsen diffusion coefficient !Di!"#$:
!!!"## = 1 1 !!"!"#+ 1 !!"!"#$ !!!"#$ = !!!10!! 1 ! !.!" !!!"#$% = ! !!0.97 !!"#$ 2 ! !!! !.!"
Where !!! is a constant. It is 1.67 for CO2 and 2.1 for H2O [17], !!"#$ is the pore diameter (m), ! is the char porosity and ! is the char tortuosity.
The effectiveness approach renders the calculation of the char reactivity straightforward. Despite it does not gather all the physics of the gasification reaction; it is a simple method allowing predicting the char apparent reactivity without enormous computational effort.
Modeling procedure:
At 50% of conversion we adopted a char porosity of 0.95, a tortuosity of 3 and an apparent density of 250(kg/m3
) (the initial density after pyrolysis is around 500(kg/m3
)). We measured the Total Surface Area of char02 at X=0.5 by N2 adsorption at 77 K. The values were 1230 (m2
/g) for H2O gasification and 840 (m 2
/g) for the CO2 gasification. We used these values for the parameter Sr as well as in the calculation of Sv, which is the product of Sr by the apparent density.
In the Thiele modulus expression, there are two unknown parameters that will be determined by best fitting the model to the experimental data. These parameters are !!"#$ in the effective diffusivity expression, k(!)! in the rate constant expression; !!"#$ and k(!""°$)! are determined
first by fitting the experimental R(50) data obtained at 900°C for char004, char02, char035, char1 and char13 with the model.
!!"#$ and k(!""°$)!are determined by the minimisation of the following objective function:
!" = !(50)!!"# − !(50)!!"#$% ! !
!!!
The effectiveness factor approach was used to analyse the gas diffusion inside the porous char and try to determine the class of pores that is most participating to the gasification reactions under CO2 and H2O.
2.4- Evolution of the Active Surface Area during CO2 and H2O gasification reaction
During gasification experiments H2O or CO2 reacts on the char active sites whose number and types evolve along the gasification. When switching from a gas to another, the nature and number of these active sites would directly impact the char reactivity towards the second gas. In order to determine the active sites concentration during CO2 and H2O gasification, we stopped the gasification reactions at 20%, 50% and 70% of conversion and determined the Active Surface Area (ASA) of the chars. The Active Surface Area of the biomass chars was determined following the method of Laine and Co-workers [21] consisting on O2 chemisorption on the char sample at 200°C.
Near to 20 mg of char are placed in a quartz crucible inside a tubular reactor. The reactor is first outgassed in a primary vacuum down to 1 mm Hg of pressure, and then in a second step to a secondary vacuum down to 10−4 mm Hg of pressure by mean of a turbo-molecular pump. The char sample in the crucible is afterwards heated up to 900°C at constant rate of 5°C/min and kept at this final temperature during 1 h. The char sample surface is “cleaned” by this way. Afterwards, the char sample is cooled down to 200°C, keeping the reactor under vacuum. When the temperature stabilizes, Oxygen is introduced (pressure close to 0.5 mm Hg) and chemisorbed on the char surface for a period of 15 h leading to the formation of surface oxygen complexes. After the chemisorption step, a Temperature Programmed Desorption experiment is performed and the oxygenated char sample is heated up to 900°C with a constant heating rate of 10°C/min and kept for 20 min at this final temperature. CO and CO2 are emitted consequently and are analysed by mean of a Mass spectrometer. The ASA (m2
/g) of a char sample may be calculated using the equation: !"! =!!!!!!!!
!!!!"
n!!! is the total number of oxygen moles calculated from the relation: n!!! = ! n!"!!+ !2!n!"!!!
n!"!! and !n!"!!are obtained from the time integration of the TPD curves:
n!"!!= !!"!Q!"
!!
n!"!!!!! = !!"#Q!"!!!
!!
!dt
Q!"!and Q!"!!!are the molar emission rate of CO and CO! (mol/s).
! is the Avogadro number and σ! is the cross sectional area of an oxygen atom (0.083 nm2).
3- RESULTS AND DISCUSSION
3.1- Mixed atmosphere gasification experiments
Figure 1 shows the char reactivity at a temperature of 900°C, in mixed atmosphere of 20% H2O + 20% CO2 for the 0.02 mm (char02 and 13 mm (char13) char samples.
Figure 1: Mixed atmosphere gasification experiments for 0.2 mm and 13 mm char particles at 900°C in 20% H2O +20% CO2
Decrease in reactivity with size is related to mass transfer limitation. As it can be seen on the figure, the additivity model represents quite fairly the char reactivity in mixed atmospheres of H2O and CO2. For high diffusional limitations (char13) as well as for quite low ones (char02), the mixed atmosphere char reactivity in 20% H2O + 20% CO2 at 900°C can be fairly considered as the sum of the individual reactivity contributions.
3.2- Gas alternation gasification experiments
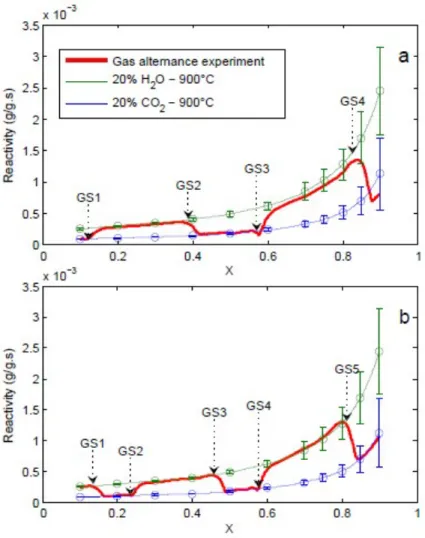
Gas alternation gasification experiments were done at two different scales: on char particles of 0.2 mm and on char particles of 13 mm. We believe that for the 0.2 m char particles, diffusional limitations are negligible while they are quite important for the 13 mm char particle. Indeed, increasing the particle size from 0.2 to 13 mm resulted in a decrease of the mean reactivity by almost 20 times. Gas alternation gasification experiments for the 0.2 mm char particles are shown in Figure 2. In this figure, the reference char reactivity with CO2 and H2O are shown with that obtained in the gas alternation experiments. Converting the char up to 20% conversion with CO2 does not modify its reactivity towards H2O. In the beginning, the char reactivity follows the pure CO2 gasification reactivity curve, then joins that obtained in
0 0.1 0.2 0.3 0.4 0.5 0.6 0.7 0.8 0.9 1 0 0.005 0.01 0.015 0.02 0.025 0.03 0.035 0.04 X R (g /( g .s )) R-exp Char02-900°C R-exp Char13-900°C R-additivity Char02-900°C R-additivity Char13-900°C
H2O after switching the gases. The active surface complex or free carbon sites formed during CO2 gasification would exhibit the same reactivity toward steam. !
!
Figure 2: Gas alternation gasification experiments for 0.2 mm char particles at 900°C (GS: Gas Shift)
!
!
Figure 3: Gas alternation gasification experiments for 13 mm char particles at 900°C (GS: Gas Shift) 0 0.1 0.2 0.3 0.4 0.5 0.6 0.7 0.8 0.9 1 0 0.005 0.01 0.015 0.02 X R (g /( g .s )) Char02 20% H2O 900°C Char02 20% CO2 900°C Char02 Gas alternation
The experiments were also done for the biggest char particles of 13 mm size. As the full gasification time was long, we were able to perform cyclic gasification experiments and alternating many times H2O and CO2 gases. Results are shown in Figure 3. In this figure, the char reactivity in single atmospheres (20% CO2 and 20% H2O) as well as the cyclic gasification experiments are plotted. The reactivity curves in the cyclic gasification experiment jump from a reference curve to the other one when switching the gases, whatever is the conversion level. The reactivity curve in the cyclic experiment superposes to the reference reactivity curves each time the gasification atmosphere is switched. Small deviations are observed in the advanced conversion level, but they still in the standard deviation zone of the experiments. It can be clearly observed that the char reactivity does not depend on previous gasification conditions. Gasifying the char with CO2 to a defined conversion level does not modify its reactivity towards H2O when switching the gases. This effect is reciprocal. Altogether, the char reactivity towards a gas is here only conversion dependent. It is as if there is a kind of a char “gasification memory loss”: at a defined conversion level the char reactivity is constant whatever is the gasification history. The char reactive surface would evolve similarly for the two gases to observe such kind of results. To the authors best knowledge such findings are not presented in the literature were the mutual influences of two gases on the char reactive properties are studied.
3.3- Why is the char reactivity only “conversion dependent”? 3.3.1- Gas transport inside the char!
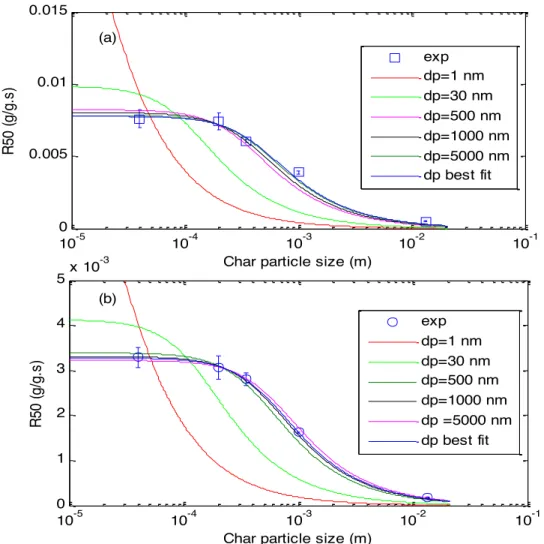
We adopted the Thiele approach to determine the size of pores that effectively participate to the gasification reaction with H2O and CO2. For this purpose, we performed the gasification of chars with different size going from 0.04 mm to 13 mm under CO2 and H2O and determined the experimental reactivities at 50% of conversion. The Thiele approach was then applied on the experimental results in order to determine the pore size for which the model fits the experimental results. Figure 4 shows the experimental R(50) as well as the Thiele model predictions for H2O (a) and CO2 (b) char gasification at 900°C.
As explained above, this modeling procedure allows determining the best average pore diameter to fit with experimental results. For both H2O and CO2 gasification, the pore size for which we obtain the best fit is in the macropore size range. For H2O gasification, we found that the best fit is given for a very high pore diameter (a value that has no physical meaning), but when plotting the sum of squared residuals between the experimental data and model prediction as a function of the pore diameter, we observed that this error is constant for pore sizes higher than 1μm. As shown on Figure 4, fixing the pore diameter to 1μm or 5μm gives quite satisfactory results. In the case of H2O gasification the pore size would be higher than 1μm. For CO2 gasification, the best fit was obtained for a pore size of 1.5μm. Similarly, when plotting the sum of squared residuals between the experimental data and model prediction as a function of the pore diameter, we obtained a minimum around this value but the experimental data still well represented for pore sizes in the range of 0.5 to 5 μm. This range of pores would be the most influencing during CO2 gasification. These results mean that the gasification reactions are mainly occurring in macropores. These results are in accordance with some authors thinking about the fact that mesopores and macropores are better indicators of the char reactivity [22].
Figure 4: Experimental R (50) and Thiele model for H2O (a) and CO2 (b) char gasification at
900°C." "
Contribution of micropores to the active surface area is thought to be negligible compared to that of macropores and large mesopores. To assess if the model captures the experimental data for other pore sizes, we fixed the pore size at some specific values: 1 nm (micropores), 30 nm (mesopores) and 1000 nm (macropores) and searched for k(T=900°C) that allows the best fitting to the experimental results. As shown in Figure 4, neither pore size representative of micropores nor one representative of mesopores allows to capture the experimental R(50). It can also be seen that for the char004, both gasification reactions are performed in the chemical regime. The experimental R50 points for the char004 are located in the plateau given by the model so that reducing further the char particle size will not modify the char reactivity. These results are of interest to analyse the mutual influences of both gases in the gas alternation experiments.
3.3.2- The number of active sites: evolution of the Active Surface Area along the conversion under H2O and CO2!
As a first attempt to understand what leads to such an observation, we measured the Active Surface Area (ASA) of the chars at 20%, 50% and 70% of conversion. The monitoring of the ASA was done on the 0.2 mm chars for both H2O and CO2 gasification reactions. The results
10-5 10-4 10-3 10-2 10-1 0 1 2 3 4 5x 10 -3
Char particle size (m)
R5 0 (g /g .s ) exp dp=1 nm dp=30 nm dp=500 nm dp=1000 nm dp =5000 nm dp best fit 10-5 10-4 10-3 10-2 10-1 0 0.005 0.01 0.015
Char particle size (m)
R5 0 (g /g .s ) exp dp=1 nm dp=30 nm dp=500 nm dp=1000 nm dp=5000 nm dp best fit (b) (a)
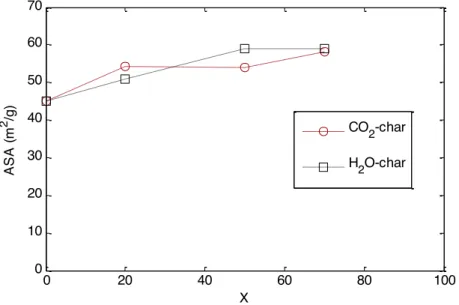
of ASA evolution are shown in Figure 5. We can see that for both gasification reactions the ASA evolves in a similar way.
Figure 5: ASA evolution during CO2 and H2O gasification of 0.2 mm char at 900°C
The ASA shows a global trend of increase with conversion for the three chars. It increased from 45m2
/g for the non-gasified char to 58m2
/g and 59m2
/g at 70% of conversion respectively for CO2-char and H2O-char. At a defined conversion level, the ASA values of the different chars were very close to each other. Reactivity of beech-chars increases along the reaction. The increase becomes very marked from 60-70% of conversion and beyond. The increase of reactivity may be caused in a part by the increase of ASA, but this latter would not be the sole governing parameter as the reactivity and ASA do not increase by the same proportions. The similarity in the ASA evolution (which is related to the number of active sites on the char surface) during both gasification reactions may explain the non-changing reactivity when switching from CO2 to H2O atmosphere. However, the ASA is an index of the char reactivity towards O2 as proposed by Laine et al. [21], that is why these explanations must be taken with cautions for H2O and CO2 gasification reactions. Nevertheless, the similarities in the number of active sites during gasification as well as the in nature of pores that are likely governing H2O and CO2 gasification reactions can explain the observations made for the gas alternation gasification experiments.
4- CONCLUSIONS
In the present work, we studied the mutual influence of CO2 and H2O on the char reactivity adopting gas alternation gasification experiments. For char particle size of 0.2 mm and 13 mm, the char reactivity was only conversion dependent. The char reactivity to H2O or CO2 at a defined conversion level is constant independently on previous gasification atmosphere. The ASA evolutions during the gasification of 0.2 mm chars were similar for both H2O and CO2 gasification reactions. The number of active sites is consequently similar and may explain the gas alternation experimental results. Besides, we adopted the Thiele approach to charactarise the gas diffusion inside the porous char during H2O and CO2 gasification reactions. We found that for both reactions, macropores are likely the pores in which the diffusion predominately occurs. Altogether these results can explain, at least partially, the
0 20 40 60 80 100 0 10 20 30 40 50 60 70 X ASA (m 2 /g ) CO2-char H2O-char
observed experimental results in the gas alternation gasification experiments and the “conversion-only” dependent char reactivity.
REFERENCES
[1] D. G. Roberts and D. J. Harris, “Char gasification in mixtures of CO2 and H2O: Competition and inhibition,” Fuel, vol. 86, no. 17–18, pp. 2672–2678, Dec. 2007. [2] H. C. Butterman and M. J. Castaldi, “CO2 as a carbon neutral fuel source via enhanced
biomass gasification.,” Environ. Sci. Technol., vol. 43, no. 23, pp. 9030–7, Dec. 2009. [3] Michiel J Groneveld and V. S. W.P.M., “Gasification of char particles with CO2 and
H2O,” Chem. Eng. Sci., vol. 35, pp. 307–313, 1980.
[4] M. Barrio, “Experimental investigation of small-scale gasification of biomass,” Norwegian University of Science and Technology,, 2002.
[5] Jean-Philippe Tagoutchou, “Gazéification du charbon de plaquettes forestières!: particule isolée et lit fixe continu,” Université de perpignan, 2008.
[6] M. J. C. Heidi C Butterman, “Influence of CO2 Injection on Biomass Gasification,” Ind. Eng. Chem. Res., vol. 46, no. 26, pp. 8875–8886, 2007.
[7] M. V. Minkova, S. P. Marinov, R. Zanzi, E. Bjornbom, T. Budinova and L. L.
Stefanova, “Thermochemical treatment of biomass in a flow of steam or in a mixture of steam and carbon dioxide,” Fuel Process. Technol., vol. 62, pp. 45–52, 2000.
[8] P. O. Susanna Nilsson, Alberto Gomez-Barea, “Gasification of char from dried sewage sludge in fluidized bed: Reaction rate in mixtures of CO2 and H2O,” Fuel, vol. 105, pp. 764–768, 2013.
[9] D. F.-C. Susanna Nilsson, Alberto Gomez-Barea and M. Campoy, “Gasification kinetics of char from olive tree pruning in fluidized bed,” Fuel, vol. 125, pp. 192–199, 2014.
[10] T. Pattanotai, H. Watanabe, and K. Okazaki, “Experimental investigation of intraparticle secondary reactions of tar during wood pyrolysis,” Fuel, vol. 104, pp. 468–475, Feb. 2013.
[11] T. Pattanotai, H. Watanabe, and K. Okazaki, “Gasification characteristic of large wood chars with anisotropic structure,” Fuel, vol. 117, pp. 331–339, Jan. 2014.
[12] C. Guizani, F. J. E. Sanz, and S. Salvador, “The gasification reactivity of high-heating-rate chars in single and mixed atmospheres of H2O and CO2,” Fuel, vol. 108, pp. 812– 823, 2013.
[13] a. Gómez-Barea, P. Ollero, and C. Fernández-Baco, “Diffusional Effects in CO 2 Gasification Experiments with Single Biomass Char Particles. 1. Experimental Investigation,” Energy & Fuels, vol. 20, no. 5, pp. 2202–2210, Sep. 2006.
[14] F. Mermoud, F. Golfier, S. Salvador, L. Vandesteene, and J. Dirion, “Experimental and numerical study of steam gasification of a single charcoal particle,” Combust. Flame, vol. 145, no. 1–2, pp. 59–79, Apr. 2006.
[15] K. Umeki, S.-A. Roh, T.-J. Min, T. Namioka, and K. Yoshikawa, “A simple expression for the apparent reaction rate of large wood char gasification with steam.,” Bioresour. Technol., vol. 101, no. 11, pp. 4187–92, Jun. 2010.
[16] A. Gómez-Barea, “Modelling of diffusional effects during gasification of biomass char particles in fluidised-bed,” University of Seville, 2006.
[17] W. Huo, Z. Zhou, F. Wang, Y. Wang, and G. Yu, “Experimental study of pore diffusion effect on char gasification with CO2 and steam,” Fuel, vol. 131, pp. 59–65, Sep. 2014.
[18] T. Mani, N. Mahinpey, and P. Murugan, “Reaction kinetics and mass transfer studies of biomass char gasification with CO2,” Chem. Eng. Sci., vol. 66, no. 1, pp. 36–41, Jan. 2011.
[19] E. W. Thiele, “Relation between Catalytic Activity and Size of Particle,” Ind. Eng. Chem., vol. 31, no. (7), pp. 916–920, 1939.
[20] C. Di Blasi, “Combustion and gasification rates of lignocellulosic chars,” Prog. Energy Combust. Sci., vol. 35, no. 2, pp. 121–140, Apr. 2009.
[21] N. . Laine, F. . Vastola, and P. . Walker, “The importance of active surface area in the carbon-oxygen reaction,” J. Phys. Chem, vol. 67, pp. 2030–2034, 1963.
[22] F. Mermoud, S. Salvador, L. Vandesteene, and F. Golfier, “Influence of the pyrolysis heating rate on the steam gasification rate of large wood char particles,” Fuel, vol. 85, no. 10–11, pp. 1473–1482, Jul. 2006.