HAL Id: hal-03164252
https://hal.archives-ouvertes.fr/hal-03164252
Submitted on 19 Apr 2021HAL is a multi-disciplinary open access archive for the deposit and dissemination of sci-entific research documents, whether they are pub-lished or not. The documents may come from teaching and research institutions in France or abroad, or from public or private research centers.
L’archive ouverte pluridisciplinaire HAL, est destinée au dépôt et à la diffusion de documents scientifiques de niveau recherche, publiés ou non, émanant des établissements d’enseignement et de recherche français ou étrangers, des laboratoires publics ou privés.
Recrystallization at high temperature of two tungsten
materials complying with the ITER specifications
M. Richou, A. Durif, M. Lenci, M. Mondon, M. Minissale, L. Gallais, G.
Kermouche, G. de Temmerman
To cite this version:
M. Richou, A. Durif, M. Lenci, M. Mondon, M. Minissale, et al.. Recrystallization at high temperature of two tungsten materials complying with the ITER specifications. Journal of Nuclear Materials, Elsevier, 2020, 542, pp.152418. �10.1016/j.jnucmat.2020.152418�. �hal-03164252�
1 Recrystallization at high temperature of two tungsten materials complying with the ITER
specifications
M. Richou1, A. Durif1, M. Lenci2, M. Mondon2, M. Minissale3, L. Gallais4, G. Kermouche2, G. De
Temmerman5
1CEA, IRFM, F-13108 Saint-Paul-Lez-Durance, France
2 Mines Saint-Etienne, Univ Lyon, CNRS, UMR 5307 LGF, Centre SMS, F - 42023 Saint-Etienne France 3Aix Marseille Univ, CNRS, PIIM, Marseille, France
4Aix Marseille Univ, CNRS, Centrale Marseille, Institut Fresnel, France
5ITER Organization, Route de Vinon-sur-Verdon, CS 90 046, 13067 St Paul Lez Durance Cedex, France
Keywords: Recrystallization, tungsten, thermal loading at high temperatures Highlights
- Recrystallization kinetics of temperature processed tungsten is studied for the first time above 1350°C and up to 2000°C
- Recrystallization fractions of tungsten batches, from two manufacturers, were studied.
- At 1600°C, recrystallization fraction of 50% is reached after 200 s thermal loading for one batch and after 500 s for the other one.
Abstract
Estimating the lifetime of W-armoured divertor components is of great importance for ITER. During heat loading, one of the mechanisms inducing tungsten microstructure modification is recrystallization. As tungsten recrystallization induces a decrease of the mechanical properties, the knowledge of the recrystallization kinetics of the ITER tungsten material is necessary over the entire divertor PFU operational temperature window (up to 2000 °C). Some data exist for temperature loading lower than 1350 °C. For higher temperatures, some constraints due to the heating system and its impact on recrystallization process limit the possibility of high temperature studies. For this reason, in this study, a laser heating device and related diagnostics are used for the determination of the recrystallization kinetics. The Johnson Mehl-Avrami Kolmogorov (JMAK) equation is used to model the recrystallization process. Recrystallization kinetics for annealing temperatures higher than 1400 °C are provided for two tungsten materials produced according to the ITER specifications. At 1600 °C (rep. 1800 °C), recrystallization fraction of 50% is obtained after 200 s (rep. 50 s) thermal loading for one batch and after 500 s (rep. 10 s) for the other one.
1
Introduction
The ITER divertor is made of 54 cassettes comprising plasma-facing units (PFU). These components are constituted with a chain of W (tungsten) monoblocks bonded to a copper alloy (CuCrZr) tube. Between W and CuCrZr, a pure Cu interlayer is present [1] [2]. Shaping of the front monoblock surface [3] using a single toroidal bevel and tilting of the individual vertical targets [3] [4] for leading edge protection lead to an increased surface heat flux, compared to that on a toroidally continuous axisymmetric surface. This implies an increased surface temperature and a reduced margin to remain below temperatures at which recrystallization and grain growth occur. Mechanical properties changes linked with recrystallization, such as decrease in hardness and strength, strongly affect the W thermal shock resistance and can favour the appearance of deep macrocracks [5][6][7]. Different recrystallization temperatures have been reported in the literature for pure W [5][8][9]. It typically depends on the level of cold deformation applied during manufacturing and values in the range 1100-1500 °C have been found. Since, recrystallization is a time and temperature-dependent phenomenon, the kinetics of the process need to be accounted for in any attempt to define an operational budget for the divertor, i.e. the time the divertor material can be operated at a given temperature before a significant fraction of the material is recrystallized [10]. For this, a good knowledge of the recrystallization kinetics of ITER material is necessary over the entire divertor PFU operational
2 temperature window (up to 2000 °C with some excursions above possible). Recrystallization kinetics for W material produced according to ITER specifications were determined in the literature up to 1350 °C [11]. There are few references and it has to be noted that results are heterogeneous since manufacturing process and producers may differ among studied samples.
When recrystallization kinetics have to be studied over 1500 °C, some additional constraints appear. Indeed, 1500°C is the limit for the use of ampoule in which samples are embedded to prevent oxidation during heating operated by an oven. When annealed at temperatures higher than 1600 °C, material recrystallization occurs in a few minutes [12] so that time to reach annealing temperature may have a non-negligible impact on results. This is the case for conventional facilities, for which heating speed is 5 °C/min. For these reasons, a new test bed was developed using a laser heating system [13]. The sample could be heated with a speed of 200 °C/s in low vacuum environment (10-2 mbar). In this
case, the time to reach 1600 °C is 8 s. With this speed, the time to reach Ta may be neglected for the estimates of annealing time (ta).
The objective of this paper is to describe the recrystallization kinetics obtained above 1350 °C for two batches of W materials produced according to the ITER specifications. Our paper is organized as follows: the laser-heating system used in this work is described, then the characterization (hardness measurements, optical micrographs and EBSD (Electron Back Scatter Diffraction) maps) of as-received W microstructure is presented. In the following, recrystallization kinetics are presented and analyzed.
2
Experimental methods and procedures
2.1 Materials
Two W plates, complying with the W ITER specifications [2] were provided by two different manufacturers, while no information about manufacturing process was delivered. One plate, called “Batch A”, is 170 mm wide, 180 mm long, 13mm thick, the Rolling Direction (RD) being along the 180 mm side. The second plate, called “Batch B”, is 200 mm wide, 200 mm long and 12 mm thick. Samples are extracted from the middle of the plate to avoid any microstructure heterogeneity from the sides of the plates. Sample dimension is 4*4.45*5.25 mm for batch A and 4*4*5 mm for batch B. The dimensions are different for batches A and B due to EDM (Electro Discharge Machining) device programing which was different from the two batches.
2.2 Laser heating system
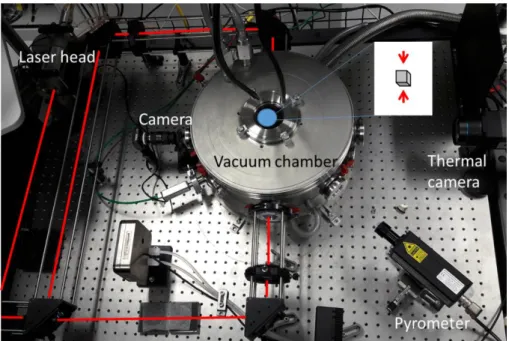
To heat the samples at high temperatures with minimal thermal transient, a laser heating approach is used. The experiment is based on the ChauCoLase facility (Chauffage Contrôlé par laser, laser-controlled heating in english) which is described in details in [13]. In the present work, samples are annealed at temperature called Ta for duration called ta. The heating rate to reach Ta was set to 200 °C/s. Samples are thermally loaded by the laser from two sides (Fig. 1). The temperature distribution in the sample has been estimated with Finite Elements Methods simulations [13]. During steady state loading, the temperature gradient across the material at Ta=1727 °C is below 20 °C and 30°C for batch A and batch B, respectively. At Ta=1427°C it is below 10 °C and 11°C for batch A and batch B respectively Temperature deviations in the sample during the heating and cooling sequence were estimated to be below 2% compared to set Ta [13]. The experimental chamber is configured as shown in Fig. 2. The laser beam diameter is 4 mm. The sample is mounted on a graphite rod, supported by an alumina post. An infrared camera is used to monitor in real time the annealing sequence. The sample temperature is controlled with a feedback loop relying on optical pyrometry. Tungsten emissivity has, however, a strong spectral and temperature dependence. Therefore, we have used for this work a monochromatic pyrometer designed for W (1.27 µm), for which the emissivity is constant as a function of temperature [14][15][16]. The pyrometer has been calibrated on a reference black body source. The emissivity of the pyrometer is set to a constant value of 0.32 for measurements. Based on
3 preliminary tests on clean W samples done with several measurement systems (bichromatic pyrometer and thermocouple measurements), the uncertainty on the emissivity value was estimated to be less than 3%. A conservative value of 5% has been taken to estimate temperature errors for the different Ta (0.305<ε<0.345). The relative error on the temperature measurement (eT
T) is related on the uncertainty on the emissivity (eεε), and can be estimated with Eq (1).
Eq (1) 𝑒𝑇 𝑇 ≈ | 𝜆𝑇 𝐶2| 𝑒𝜀 𝜀 ≈ 0.0001𝑇 𝑒𝜀 𝜀
with C2=1.44.x 10E-2; λ the pyrometer operating wavelength,
Laser heating sequences are started once the pressure in the vessel is below 5x10⁻² mbar. In order to
ensure a clean surface for temperature monitoring by thermal radiation measurements, a first “cleaning” sequence is applied to the sample (5 min at 1127 °C) (Fig. 3). From past studies [12], W hardness drop is observed after 80 h annealing at 1100 °C, as a consequence this last sequence is considered has having a negligible impact on recrystallization process. The laser is stopped after the sequence and the sample is cooled down by natural conduction/radiation (100 °C/s)
Fig. 1. Sketch of the laser heating (left) sample before annealing (middle) and during annealing (right). Thermal
loading is done on the 4x4mm² faces (orthogonal to RD direction).
4 Fig. 3. Schematic of the laser heating sequence used in this study
2.3 Recrystallization kinetics
Recrystallization is a time and temperature-dependent process that involves nucleation and growth of nuclei. The Johnson Mehl-Avrami Kolmogorov (JMAK) [17] equation is typically well suited to describe such a phenomenon, especially when quasi-isothermal heat treatment are conducted as shown in Fig 3. The JMAK model is described by the equation (2). It relates the evolution of the recrystallized fraction (X) with time at a given temperature.
(2) X(t) = 1 − exp(−BnA(t − t
inc)nA)
Note that the Avrami exponent, nA, has been set to 1.098 as proposed in [12]. Parameters such as the
incubation time, t_inc, and parameter B are temperature dependent. Recrystallization being a thermally activated process, relationships between JMAK parameters and Ta are usually described by Arrhenius laws [17]. B and t_inc are estimated at specific Ta loadings and Arrhenius relationships are identified for these parameters on the studied temperature range. For that, X has to be estimated over different annealing times and temperatures. According to equation (3) [18], X can be estimated from hardness measurements, with HV the measured hardness of the studied annealing condition (ta, Ta), HVrecr the
measured hardness on fully recrystallized material and HV0 the measured hardness on initial material.
(3) X(t) =HVHV0− HV(t)
0− HVrecr
For each Ta, recrystallization kinetics parameters (B, t_inc) are estimated from equation (2) thanks to least square optimization method. Once parameters are defined for each Ta, Arrhenius relationship is used to approximate each of them on the entire explored temperature range. R² of Arrhenius plots provides the accuracy of JMAK parameters estimation.
2.4 Hardness and EBSD measurements
For hardness measurements, indents are performed using a load of 10 kg and a dwell time of 10 s [12]. The hardness related to specific annealing condition is the mean value of ten measurements performed
5 on one sample. The standard deviation is also evaluated. Analyses of the microstructure by optical and scanning electron microscopy are performed to verify the grain orientation and aspect ratio. EBSD is used to determine grain misorientation and low and high angle grain boundaries. All of these parameters are known to highly affect the recovery and recrystallization kinetics [17]. A grain boundary is defined by a misorientation between grains higher than 15° whereas for sub-grains the boundary misorientation criterion is 2°[12]. The presence of Low Angle Boundaries (between 2°and 15°) inside a grain is characteristic of the stored energy that is a driving force for recrystallization. Hence grains containing no LAB can be considered as recrystallized grains. The EBSD measurement procedure requires the reconstruction of 4 maps each one at magnification x500 and step size 0.5 µm.
3
Characterization of as-received tungsten
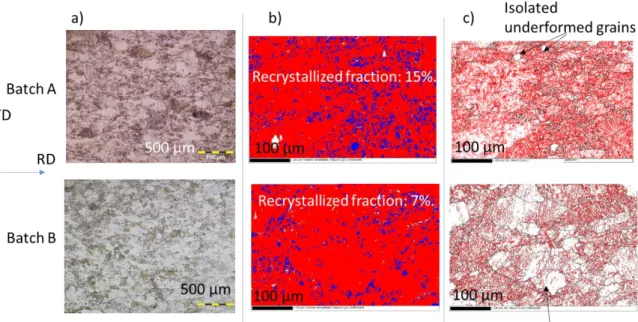
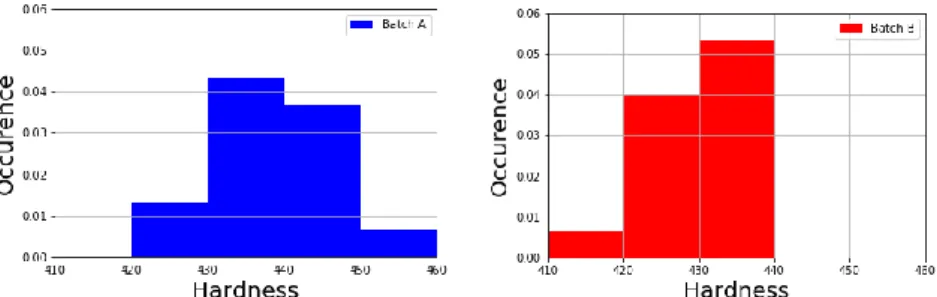
The two W batches were first characterized in the as-received state. Per batch, three samples were analyzed. For batch A and B, representative OM (Optical micrographs) and EBSD maps are presented in Fig. 4. A significant part of the grains are recrystallized (batch A: 15 %; batch B: 7%). Most of the recrystallized grains are small (< 10 µm) and located at grains boundaries and triple points. For batch A, a high density of sub grain boundaries is observed over the whole microstructure except for isolated non-deformed grains which present a lower density of sub grain boundaries. The as-received material B is made of two types of areas: 1/ deformed grains with a low density of LAGB (Low Angle Grain Boundary) and 2/ areas similar to the microstructure of batch A. The hardness distribution for both materials is plotted in Fig. 5. For batch A, the hardness mean value is HV10=435±7 while for batch B it is HV10=427±8. Batches A and B show elongated grains (> 200 μm) representative of a rolled material, with a high density of sub-grains.
Fig. 4. As received materials for batches A and B on (Rolling Direction (RD), Transversal direction (TD)) plane:
Optical micrographs (a), EBSD maps presenting the recrystallized grains (Recrystallized grains in blue and deformed grains in red) (b) EBSD maps presenting the grains boundaries in black and sub grain boundaries in red (c).
6 Fig. 5. Hardness distribution for Batches A and B in the as-received condition
4
Recrystallization kinetics
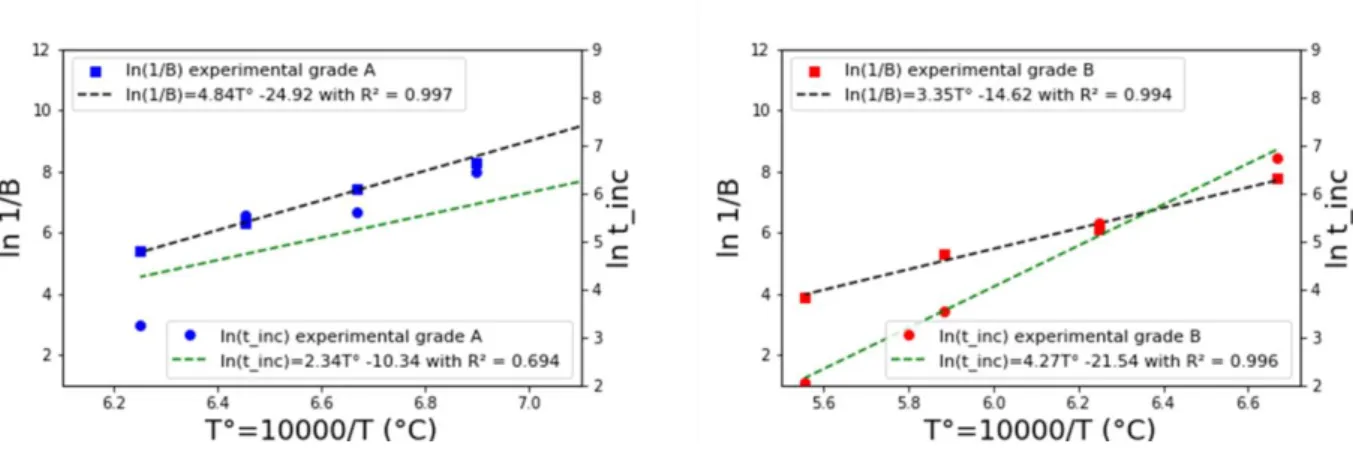
Fig. 6 shows the evolution of the recrystallization fractions as a function of ta for Ta in the range 1400°C to 1600°C for batch A. As expected, the higher the temperature, the faster the recrystallization kinetics. Table 1 shows the obtained values of B and t_inc. Arrhenius plots for 1/B and t_inc are presented in Fig. 8. Since R²= 0.997, the parameter B is well described by an Arrhenius relationship. However for t_inc, R²= 0.694. The points are not perfectly aligned on standard kinetics curves. t_inc estimated at 1400 °C is not consistent with the t_inc estimated at other temperature, as t_inc should decrease with temperature. This might stem partly from the number of samples and annealed times used for the JMAK parameters adjustment and probably due to the standard deviation of the hardness measurements, on one individual sample, that is in the range 2-19 Hv. It has to be compared with the difference between the minimum (fully recrystallized) and the maximum (initial state) hardness values; in this case 76 Hv.
The evolution of the measured recrystallization fractions as a function of ta and Ta in the range 1500-1800 °C is shown in Fig. 7 for batch B. The standard deviation of the hardness measurements is in the range 6-18 Hv. The hardness standard deviation has to be compared with the difference between the minimum (fully recrystallized) and the maximum (initial state) hardness values; in this case 66 Hv. Estimates of B and t_inc parameters are shown in Table 1. Arrhenius plots for 1/B and t_inc are presented in Fig. 8. Since the R² values are high (0.994 and 0.996), the parameters B and t_inc are well described by Arrhenius plot.
7 Fig. 6. Recrystallization kinetics for batch A (1400 °C (a), 1450 °C (b), 1500 °C (c), 1550 °C (d), 1600 °C (e))
and related JMAK fit (f)
a) b)
c) d)
f) e)
8 Fig. 7.: Recrystallization kinetics for tungsten batch B (1500 °C (a), 1600 °C (b), 1700 °C (c), 1800 °C (d)) and
related JMAK fit (e)
Table 1
Estimation of JMAK parameters for Batches A and B Ta / °C B x 10-3 t_inc / s Batch A 1400 0.05 245 1450 0.26 625 1500 0.59 270 1550 1.82 250 1600 4.59 25 Batch B 1500 0.43 844 1600 2.24 213 1700 5.08 34 1800 20.7 6.8 a) b) c) d) e)
BATCH B
9 Fig. 8. Arrhenius plots for batches A and B
5
Discussion
The recrystallization kinetics of batch A are significantly faster than the ones of batch B (Fig. 9). Indeed, for a given annealing temperature, B (Table 1) is higher for batch A than for batch B. Recovery is more important for batch B than for batch A (Fig. 9). Indeed, for a given annealing temperature, t_inc (Table 1) is higher for batch A than for batch B. From the JMAK parameters derived in this study, the annealing time to reach X=0.5 for each Ta is estimated for batches A and B (Fig. 10) for this, extrapolation of JMAK parameters from Arrhenius plot is used. At 1600°C, 50% of hardness drop is obtained after 200 s heat loading for batch A, and 500 s for batch B and after 100 s for the W batch studied in [12]. At 1800 °C, is the required times are 30 s and 10 s for batch A and batch B, respectively. The difference may be due to microstructure heterogeneity from batch to batch and to the heating system (oven) used to provide [12] data.
Fig. 11 provides a comparison between the recrystallization fractions estimated from EBSD maps and hardness measurements for batch A at 1500°C. As expected the formation and growth of recrystallized grains, leading eventually to an equiaxial microstructure, is observed as a function of time. Yet, a difference between the recrystallized fraction measured by EBSD and the expected recrystallized fraction from the kinetics plot (determined from the hardness measurements) can be noted (Fig. 12). For example, X at ta= 1030 s, estimated by hardness measurement is 45%, but the values measured by EBSD is significantly lower (20%). This is the case for all recrystallization fractions estimated by EBSD measurements. It is worth noting that hardness measurements are affected by several factors such as grain and sub grain size, dislocation density and fraction of recrystallized grains and thus direct comparison of the recrystallization fraction provided by hardness measurements and EBSD has to be taken with caution. It also has to be noted that, due to indenter size, hardness value is a value averaged over several grains. With the obtained results, one can say that at early stages of the heat treatments, a part of the energy is used to lower the dislocation density (recovery). For longer annealing times, recovery and recrystallization processes happen simultaneously and are competing in a way that the driving force for grain boundary migration is the intra-grain stored energy (dislocation density). This implies that hardness changes cannot be ascribed uniquely to recovery or recrystallization. Identification of the recrystallization kinetics might be questionable given the competition between recovery and recrystallization. However, the incubation time in the JMAK model can be considered as a good indicator of the recovery time. Therefore, a first order approximation of the recrystallization kinetics can be obtained through JMAK model. However, the development of a mean field approach to model the recrystallization of W is an alternative way to take into account physical parameters such as dislocation density, grain size distribution and grain boundary mobility. Such an approach would explore in a deeper way the competition between recovery and recrystallization phenomena.
10 Fig. 9. Recrystallization kinetics for batches A, B at Ta=1500 °C and 1600 °C
Fig. 10. Annealing time to achieve a recrystallization fraction of 0.5 for batches A, B and W batch presented in
11 Fig. 11. EBSD maps and recrystallization fraction provided by EBSD and hardness measurements (in bold character) for annealing temperature (Ta) of 1550°C and different annealing times for tungsten batch A
Fig. 12: Recrystallization fractions provided by EBSD maps and hardness measurements for annealing temperature (Ta) of 1550°C and different annealing times for tungsten batch A
6
Conclusions
The study of tungsten recrystallization kinetics over its expected operational temperature window (up to 2000 °C) is of great importance for ITER. Some references exist for annealing temperatures lower than 1350 °C. In this study, a laser heating setup has been used to obtain recrystallization kinetics data up to 1800°C. The Johnson Mehl-Avrami Kolmogorov (JMAK) equation is used to model the recrystallization process. Recrystallization kinetics for annealing temperatures higher than 1400 °C are now available for two tungsten batches (A and B) produced by two manufacturers according to the
12 ITER specifications. Significant differences are observed between both batches. At 1600°C, recrystallization fraction of 50% is reached after 200 s thermal loading for one batch and after 500 s for the other one. For the investigated annealing temperatures, at early stages of heat treatment, a competition between recovery and recrystallization is observed. A first approximation of the recrystallization kinetics can be obtained through the JMAK model, which takes recovery process into account through the incubation time parameter. However, development of a mean field approach, which takes into account physical parameters such as dislocation density, grain size distribution and grain boundary mobility, will lead to model tungsten recrystallization more accurately.
Acknowledgements
This work has been carried out within the framework of the contract IO/CT/18/4300001734 with ITER Organization. The views and opinions expressed herein do not necessarily reflect those of the of the ITER Organization
[1] M. Merola, F. Escourbiac, R. Raffray, P. Chappuis, T. Hirai, and A. Martin, “Overview and status of ITER internal components,” Fusion Eng. Des., vol. 89, no. 7–8, pp. 890–895, 2014. [2] T. Hirai et al., “Use of tungsten material for the ITER divertor,” Nucl. Mater. Energy, vol. 9,
no. 2016, pp. 616–622, 2016.
[3] R. A. Pitts et al., “Physics conclusions in support of ITER W divertor monoblock shaping,” Nucl. Mater. Energy, vol. 12, pp. 60–74, 2017.
[4] S. Carpentier-Chouchana et al., “Status of the ITER full-tungsten divertor shaping and heat load distribution analysis,” Phys. Scr., vol. T159, 2014.
[5] S. Panayotis et al., “Self-castellation of tungsten monoblock under high heat flux loading and impact of material properties,” Nucl. Mater. Energy, vol. 12, pp. 200–204, 2017.
[6] M. Wirtz, J. Linke, T. Loewenhoff, G. Pintsuk, and I. Uytdenhouwen, “Transient heat load challenges for plasma-facing materials during long-term operation,” Nucl. Mater. Energy, vol. 12, pp. 148–155, 2017.
[7] A. Durif, M. Richou, G. Kermouche, M. Lenci, and J.-M. Bergheau, “Impact of tungsten recrystallization on ITER-like components for lifetime estimation,” Fusion Eng. Des., vol. 138, 2019.
[8] J. W. Davis, V. R. Barabash, A. Makhankov, L. Plöchl, and K. T. Slattery, “Assessment of tungsten for use in the ITER plasma facing components,” J. Nucl. Mater., vol. 258–263, no. PART 1 A, pp. 308–312, 1998.
[9] X.-X. Zhang, Q.-Z. Yan, C.-T. Yang, T.-N. Wang, M. Xia, and C.-C. Ge, “Recrystallization temperature of tungsten with different deformation degrees,” Rare Met., vol. 35, no. 7, pp. 566–570, 2016.
[10] G. De Temmerman, T. Hirai, and R. A. Pitts, “The influence of plasma-surface interaction on the performance of tungsten at the ITER divertor vertical targets,” Plasma Phys. Control. Fusion, vol. 60, no. 4, 2018.
[11] A. Alfonso, D. Juul Jensen, G. N. Luo, and W. Pantleon, “Recrystallization kinetics of warm-rolled tungsten in the temperature range 1150-1350 °c,” J. Nucl. Mater., vol. 455, no. 1, pp. 591–594, 2014.
[12] A. Alfonso, D. J. Jensen, G. Luo, and W. Pantleon, “Thermal stability of a highly-deformed warm-rolled tungsten plate in the temperature range 1100 – 1250 ◦ C,” Fusion Eng. Des., vol. 98–99, pp. 1924–1928, 2015.
13 [13] M. Minissale, A. Durif, P. Hiret, T. Vidal, J. Faucheux, and M. Lenci, “A high power laser
facility to conduct annealing tests at high temperature,” pp. 1–9.
[14] M. Diez et al., “Tungsten coatings repair: An approach to increase the lifetime of plasma facing components,” Fusion Eng. Des., 2019.
[15] W. B. C. Cagran, G. Pottlacher, M. Rink, “Spectral Emissivities and Emissivity X-Points of Pure Molybdenum and Tungsten,” Int. J. Thermophys., vol. 26, no. 4, pp. 1001–1015, 2005. [16] J. C. DeVos, “No Title,” Physcia XX, pp. 69. – 714, 1954.
[17] F. J. H. and M. Hatherly, Recrystallization and Related Annealing Phenomena. 2004.
[18] P. Baral, M. Laurent-Brocq, G. Guillonneau, J. M. Bergheau, J. L. Loubet, and G. Kermouche, “In situ characterization of AA1050 recrystallization kinetics using high temperature nanoindentation testing,” Mater. Des., vol. 152, pp. 22–29, 2018.
![Fig. 10. Annealing time to achieve a recrystallization fraction of 0.5 for batches A, B and W batch presented in [12]](https://thumb-eu.123doks.com/thumbv2/123doknet/11492048.293039/11.892.224.630.170.446/fig-annealing-achieve-recrystallization-fraction-batches-batch-presented.webp)

