HAL Id: hal-00561951
https://hal.archives-ouvertes.fr/hal-00561951
Submitted on 2 Feb 2011HAL is a multi-disciplinary open access
archive for the deposit and dissemination of sci-entific research documents, whether they are pub-lished or not. The documents may come from teaching and research institutions in France or abroad, or from public or private research centers.
L’archive ouverte pluridisciplinaire HAL, est destinée au dépôt et à la diffusion de documents scientifiques de niveau recherche, publiés ou non, émanant des établissements d’enseignement et de recherche français ou étrangers, des laboratoires publics ou privés.
Quantifying how the combination of blur and disparity
affects the perceived depth
Junle Wang, Marcus Barkowsky, Vincent Ricordel, Patrick Le Callet
To cite this version:
Junle Wang, Marcus Barkowsky, Vincent Ricordel, Patrick Le Callet. Quantifying how the combi-nation of blur and disparity affects the perceived depth. SPIE Electronic Imaging, Jan 2011, San Francisco Airport, California, United States. pp.10. �hal-00561951�
Quantifying how the combination of blur and disparity affects the
perceived depth
Junle Wang, Marcus Barkowsky, Vincent Ricordel and Patrick Le Callet
IRCCyN UMR no 6597 CNRS, University of Nantes, France
ABSTRACT
The influence of a monocular depth cue, blur, on the apparent depth of stereoscopic scenes will be studied in this paper. When 3D images are shown on a planar stereoscopic display, binocular disparity becomes a pre-eminent depth cue. But it induces simultaneously the conflict between accommodation and vergence, which is often considered as a main reason for visual discomfort. If we limit this visual discomfort by decreasing the disparity, the apparent depth also decreases. We propose to decrease the (binocular) disparity of 3D presentations, and to reinforce (monocular) cues to compensate the loss of perceived depth and keep an unaltered apparent depth. We conducted a subjective experiment using a two-alternative forced choice task. Observers were required to identify the larger perceived depth in a pair of 3D images with/without blur. By fitting the result to a psychometric function, we obtained points of subjective equality in terms of disparity. We found that when blur is added to the background of the image, the viewer can perceive larger depth comparing to the images without any blur in the background. The increase of perceived depth can be considered as a function of the relative distance between the foreground and background, while it is insensitive to the distance between the viewer and the depth plane at which the blur is added.
Keywords: 3DTV, Depth perception, Stereoscopic display, Gaussian blur, Subjective experiment
1. INTRODUCTION
Recently, stereoscopic image and video production is gaining an increasing amount of attention. The displays nowadays used to show these 3D productions are usually planar so that binocular disparity on the display plane becomes a pre-eminent depth cue enabling viewers to perceive depth. As a binocular cue, disparity is stable, but on the current planar displays, it induces a conflict between accommodation and vergence of the eyes. This conflict is usually considered as one main reason for visual discomfort, especially when the disparity is large. If we decrease this binocular cue, disparity, to limit the visual discomfort, the apparent depth also decreases.
Several other depth cues besides binocular disparity affect also the apparent depth. We propose to decrease the (binocular) disparity of 3D presentations, and to reinforce (monocular) cues to compensate the loss of perceived depth and keep an unaltered apparent depth. The limitation of depth-of-field of human eyes causes blur in the retinal image which is known as an important monocular depth cue. Some previous investigations have shown clear contributions of blur to depth perception1-4, while others showed that blur has either no effect5 or only some qualitative effects on perceived depth ordering6-8.
However, most of the previous literature measures the influence of the blur cue by adding blurriness only at the screen plane, while the depth cues’ magnitude varies as a function of distance. Another limitation in most of the previous studies was the experiment apparatus. CRT monitors were used and this type of displays has some limitations: (1) the surface containing stimuli was slightly curved, (2) the stimuli’s virtual distance was affected by refraction due to the front glass plate, and (3) the screen was usually not large enough to cover a favorable field-of-view. Depending on the monitor used, the speed of the phosphor changes might also have caused crosstalk.
In our study, we conducted the subjective experiment using a state-of-art stereoscopic display system, the Samsung SyncMaster 2233RZ which is a 22.5-inch 1680*1050@120Hz wide-screen LCD monitor working with active shutter glasses from NVidia. The stimuli used in the experiment contained a background plane and a single object in the foreground, both of which were chosen closer to natural content compared to the stimuli used in previous publications. The image of a butterfly was used as the foreground object, since it is spatially complex enough, containing regions with both low and high frequency.
In our experimental observations, observers viewed stimuli in a two alternative forced choice (2AFC) task, being required to select the stimulus with largest depth interval between foreground and background. Two sources of perceived depth are used: disparity and blur. The perceived depth from disparity stems from the difference of disparity between the foreground object and the background. The perceived depth from blur stems from the amount of blur introduced to the background by convolution with a Gaussian kernel. Both the absolute position and relative distance between the foreground and background stay as a free parameter. This setup is able to evaluate how the combination of disparity and blur affects the perceived depth of objects located at different distance.
This paper is organized as follow: Section 2 introduces the geometry about how the binocular disparity and the defocus blur are created. Section 3 describes the experimental methods. Section 4 presents the results and the analyses of the experiments. Some general conclusions are presented in Section 5.
2. DISPARITY AND DEFOCUS BLUR
When people fixate an object in a three-dimensional scene, they can perceive defocus blur and binocular disparity simultaneously. Actually, the creations of defocus blur and binocular disparity in the retinal image have the same fundamental geometry. We first consider blur.
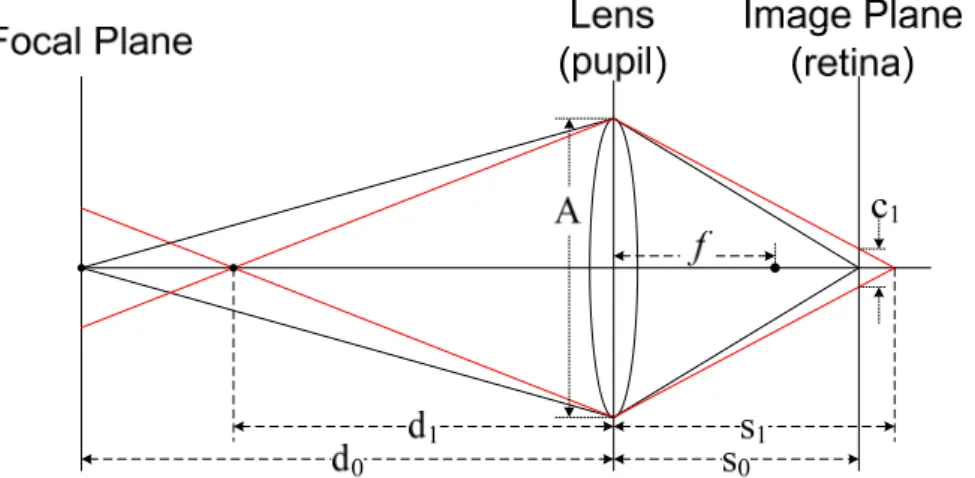
An ideal thin lens focuses parallel rays to a point on the opposite side of the lens. The distance between this point and the lens is the focal length, . Light rays emanating from a distance in front of the lens will be focused to another point at distance at the opposite side of the lens. The relationship between these distances derives from the thin-lens equation:
1 1
1 ,
When the lens focuses at an object at distance , the image of this object will be formed at the image plane at distance . This object is now in focus, while objects at other distance become out of focus and hence generate blurred images on the image plane (Figure 1). We express the amount of blur in the image plane by the blur circle diameter , which can be computed by the equation:
1 ,
where A is the diameter of the lens (pupil) and is the posterior nodal distance (approximately the distance from the pupil to the retina). Note that the human eyes have imperfect optics, and this equation does not incorporate any of the eye’s aberrations. Nevertheless, previous researches showed that this equation can provide an accurate approximation of blur when the eye is defocused 9. Based on this calculation, blur of the retinal image can be modeled as a two-dimensional Gaussian function. We consider the blur circle radius (c1) as the radius of decay to exp(-0.5), i.e. the
standard deviation sigma of the Gaussian function.
Thus, given A and S0, the magnitude of blur varies according to the focus distance and the distance between the object
focused and the object defocused . The magnitude of blur increases as the distance from the fixated object increases. When an object is located outside of the depth of field, this object will be projected in the eye with a perceivable magnitude of blur. This relation enables blur as a cue of depth.
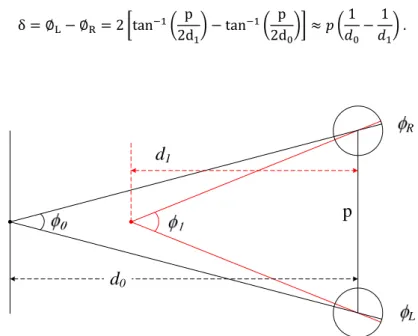
Based on the same geometry (Figure 2), disparity provides also depth information to the human brain. When the two eyes separated by a distance p converge on an object at distance do, another object at distance d1 creates images with an
angular disparity δ which can be obtained by the following equation using small-angle approximation: δ L R 2 tan 2dp tan 2dp 1 1 .
d
0d
1 L Rp
Figure 2: Schematic diagram of the generation of binocular disparity.
We can consider that disparity is caused by differing two vantage points of two cameras (eyes), while blur is caused by differing the vantage point at two positions of one camera (eye). By converting the equation of blur circle radius into angular units, and rearranging both equations, we can find the relationship between the magnitudes of disparity and blur:
|δ| .
Therefore, the magnitudes of blur and disparity created by objects in a three-dimensional scene are proportional to each other. This relationship generally holds because accommodation and vergence are coupled in the real world, namely the eyes accommodate and converge to the same distance. It suggests that the human visual system might use information from both the two factors in correlating the two eyes’ images. However, when people watch 3D images or videos displayed on a planar stereoscopic display, there exists a conflict between accommodation and vergence. No matter how the vergence changes, the image is always perceived sharpest when the eyes accommodate on the screen plane. This conflict suggests that a manual creation of blur on the focal plane (the screen) might inhibit the conflict and affect the perceived depth.
3. EXPERIMENT 3.1. Method
3.1.1. Subjects
Thirty-five subjects participated in the experiment. Twelve subjects are male, twenty-three are female. The subjects did not know about the purpose of the experiment. Subjects ranged in age from 17 to 40 years. All had either normal or
corrected-to-normal visual acuity. They were tested for visual acuity using a Snellen Chart, for depth acuity using a Randot Stereo Test and for color vision using Ishihara plates.
3.1.2. Apparatus and stimuli
Stimuli were displayed on a Samsung 22.5-inch LCD screen (1680 * 1050 at 120 Hz). Each screen pixel subtended 65.32 arcsec. The display yielded a maximum luminance of about 50 cd/m2 when watched through the activated shutter glasses. Stimuli were viewed binocularly through the Nvidia active shutter glasses (Nvidia 3D Vision kit) at a distance of approximately 90 cm. The peripheral environment luminance was adjusted to about 44 cd/m2. When seen through the eye-glasses, this value corresponded to about 7.5 cd/m2 and thus to 15% of the screen's maximum brightness as specified by ITU-R BT.500.
Each stimulus consisted of one single object in the foreground and a background. A 400 * 400 pixels butterfly image was used as the foreground object. This stimulus was easy to accommodate because it was spatially complex and therefore contained a wide range of spatial frequencies from low to high. The butterfly was shown with a horizontal offset between the left and the right view in order to create a disparity cue. The magnitude and direction of this offset varied to supply a variety of near or far disparity. At the 90 cm viewing distance, the background plane subtended 29.8 * 18.9 arcdeg, and the foreground object subtended 7.2 arcdeg. The background plane was a photo of a flowerbed. The background contained a great amount of textures, contained no distinct region of interest distracting the observers, and looked natural. When required, the background was spatially blurred by applying a Gaussian blur kernel with a 5-pixel radius. This amount of blur equals to the blur created by supposing that the focused object (foreground) and the defocused object (background) are at a distance of 13.7 cm in front of the screen and 19.8 cm behind the screen respectively, both of which are the limitations of the comfortable viewing zone derived from the 90 cm viewing distance. Note that all the blurred background were with the same amount of blur.
3.1.3. Design and procedure
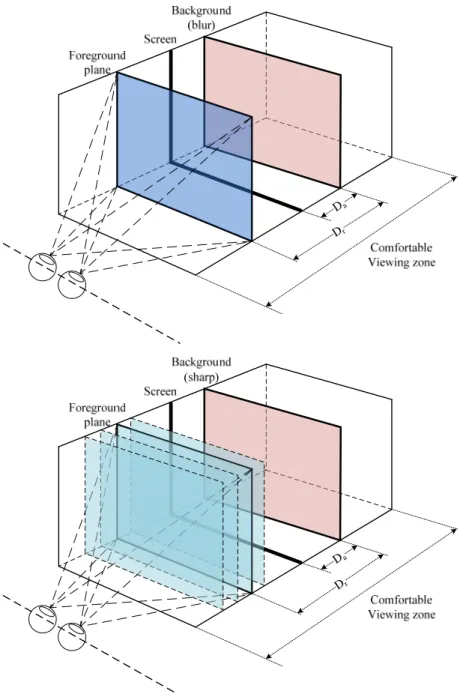
In each trial, a pair of stimuli were shown to the subjects. One stimulus contained a blurred background (BB) and a sharp foreground object, while the other stimulus contained a sharp background (SB) and also a sharp foreground object (Figure 3). The backgrounds of both stimuli were positioned at the same depth. Two parameters of the stimuli were varied: the absolute position (Da) of the background plane and the relative distance (Dr) of the foreground object to the
background. The selection of absolute distance ranged from -19.7 cm to 6.6 cm in steps of 6.6 cm (negative values denote the positions behind the screen plane, and positive values denote the positions in front of the screen plane). The relative distance ranged from 0 cm to approximately 33 cm. All the positions of both background and foreground objects are selected considering the limitations of the comfortable viewing zone 10. There are thus twenty combinations of absolute position and relative distance in total for the BB-stimuli.
Figure 3: Example stimuli: the left views of an SB-stimulus and a BB-stimulus.
Once the absolute position and the relative distance were selected for each BB-stimulus, then we paired the BB-stimulus with a set of 7 or 8 SB stimuli which are with relative distances ranging from 4 cm less than the BB stimulus to 8 cm larger than the reference stimulus. These steps were chosen considering both the depth rendering ability of the screen and the depth perception ability of the observers. One trial contains one BB-stimulus and one SB-stimulus. We had 155 trials in the experiment. This setup is shown in Figure 4, and the parameters are shown in Table 1.
Da
Dr
Da
Dr
Figure 4: Schematic diagram of the experiment setup. The blue planes represent the (foreground) depth planes in which the butterfly is located. The red plane represents the depth plane in which the background is located. We named the distance between background plane and the screen as Absolute Position (Da), while the interval between the
foreground plane and the background plane as the Relative Distance (Dr). Both these two distances were free
parameters of the design of stimuli. The variation range of these two planes always stayed in the comfortable viewing zone. The first figure shows the BB-stimulus case, while the second shows the SB-stimulus case. Each BB-stimulus is paired with one of 7 or 8 SB-stimuli to create one trial. The selection of the parameters Da and Dr for both BB-stimuli
and SB-stimuli are presented in Table 1.
The subjective experiment was conducted using a two-alternative forced choice task. For each trial, one of the 155 conditions was chosen randomly and a pair of stimuli were displayed. Observers were asked to look at the butterfly and then determine in the trial whether the BB stimulus contained a larger depth interval between the butterfly and the background than the SB stimulus. As a two monitor screen setup was technically not possible, observers were able to control the displaying of stimuli by means of a key press to switch from one stimulus to the other. When the observer switched between the stimuli, a 700 ms grey interval was shown in order to avoid memorization by the observers of the
“exact” positions of the foregrounds. For each trial, the total observation time and the number of switches were not limited. Da (cm) Dr_BB (cm) Dr_SB (cm) -19.7 0 0 1.2 2.3 3.4 4.5 5.6 6.6 -19.7 6.6 3.4 6.6 7.6 8.6 9.6 10.6 11.5 13.4 -19.7 13.2 11.1 13.2 14.3 15.6 16.9 18.1 19.7 21.7 -19.7 19.7 17.3 19.7 20.9 22 23.5 24.9 26.6 28.3 -19.7 26.3 24.9 26.3 27 28 29.3 30.5 32 33.4 -19.7 32.8 30.5 32.8 34 35.1 36.2 37.5 38.7 39.9 -13.2 0 0 1 2 3 4 4.9 5.9 -13.2 6.6 4.5 6.6 7.7 8.6 9.8 11.1 12.7 14.3 -13.2 13.2 11.5 13.2 14.3 15.4 16.5 17.6 18.7 19.7 -13.2 19.7 18.3 19.7 20.7 21.4 22.3 23.3 24.5 26 -13.2 26.3 24.5 26.3 27.1 27.9 29 30.1 31.4 32.6 -6.6 0 0 0.9 1.8 2.7 3.5 4.4 5.2 -6.6 6.6 3.5 6.6 8 9.1 10.2 11.6 13.4 15.4 -6.6 13.2 12 13.2 14.4 15.4 16.3 17.3 18.5 19.6 -6.6 19.7 16.9 19.7 20.8 21.6 22.7 23.8 25.3 26.8 0 0 0 0.8 1.6 2.3 3.4 4.5 5.6 0 6.6 4.5 6.6 7.6 8.6 9.5 10.8 12.3 14.3 0 13.2 11.4 13.2 13.7 14.3 15.1 15.9 17.2 18.7 6.6 0 0 1 2 2.9 3.9 4.8 6.3 6.6 6.6 4.2 6.6 7.1 8 8.8 9.9 11.2 12.9
Table 1: The selection of parameters Da and Dr for both BB-stimuli and SB-stimuli. Note that there are only 7 possible
selections with the Dr_BB = 0 cm cases, because putting the foreground behind the background will cause trouble
of fusion.
3.2. RESULT AND ANALYSIS
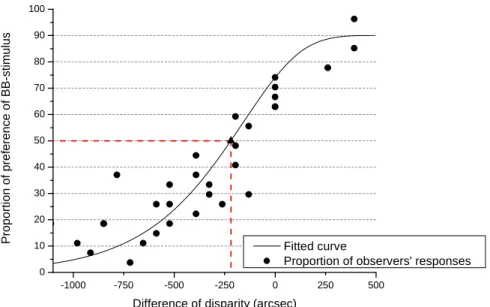
For each condition, some observers considered the BB-stimulus as having a larger depth interval (between the foreground and the background), while the other observers chose the SB-stimulus. We measure the proportion of ‘BB-stimulus contains a larger depth interval’ responses, and plot the data as a function of the disparity difference between the Dr in the BB-stimulus (D_BB) and the Dr in the SB-stimulus (D_SB). The cumulative Weibull function was used as
the psychometric function. The disparity difference corresponding to the 50% point can be considered as the Point of Subjective Equality (PSE). When measuring the disparity difference at that point, the increase of perceived depth is obtained. In total, by filtering out the data of 7 observers who made decisions in the test quite differently from other observers, 28 observations of each conditions were included in the computation. An example pattern of response and the fitted psychometric function is shown in Figure 5.
Figure 5: An example pattern of the proportion of observers’ responses and the fitted psychometric function. In this trial, we consider Dr_BB = 6.6 cm and Da = -19.7 cm, -13.2 cm, -6.6 cm, 0 cm, 6.6 cm. An equal apparent depth is
reached at -220 arcsec, which corresponds to the second point in Figure 7 (right).
According to the setup of the experiment, blur was added to the backgrounds located at different absolute depth positions in different trials, while the depth interval between the background and the foreground object stayed also as a free parameter. We thus plot the curve of the PSE as a function of the background disparity representing the depth of the blurred background in Figure 6. Each of the five points on the curve is obtained by considering all the possible depth intervals (D_BB) which are with the same background depth (Da). The steps are slightly different because the same
distances equal to various disparity in angular units depending on the viewing distance.
As we can see in the Figure 6, the PSE curve shows a clear offset from the unit slope, indicating an increase of perceived depth caused by blur in binocular vision. Note that the increase is almost constant (approximately 180 arcsec) regardless of the change of absolute depth of the background. This means that the increase of perceived depth caused by blur is insensitive to the disparity of the blurred background, e.g. the absolute position. This phenomenon makes sense because all the blur actually exists only on the screen plane where human eyes accommodate.
Figure 6: The PSE curve shows subjective matches between SB-stimuli and BB-stimuli. Negative values denote far disparities. The dashed line at unit slope indicates physically correct disparity matches.
-1000 -750 -500 -250 0 250 500 0 10 20 30 40 50 60 70 80 90 100 P ropor ti on of pref erence of BB -stimulus
Difference of disparity (arcsec) Fitted curve
Proportion of observers' responses
-1500 -1000 -500 0 500 1000 -1500 -1000 -500 0 500 1000 M a tc hing S B -s ti m u li Disp arit y (arc sec )
Disparity of BB-stimuli (arcsec)
Unit slope
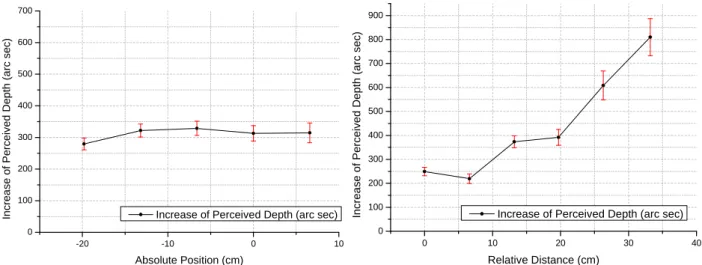
We plot also the curve of the PSE as a function of the depth interval (in length unit) between the foreground and background in Figure 7 (left). Each of the six points on the curve is obtained by considering all the possible background depth (Da) which are with the same depth interval (D_BB). 0 cm means that the foreground and the background are at the
same depth without any difference of disparity between them. According to the viewing geometry, the same depth intervals stand for slightly different disparity, therefore we plot the increase of perceived depth in disparity as a function of depth interval in length unit.
Figure 7 (right) shows also a clear increase of perceived depth created by the influence of blur. In the figure, we can find that the enhancement of perceived depth increases with increasing depth interval between the fixated sharp foreground object and the defocused blurred background. When the foreground object is close to the background (the relative distance is 0 cm or 6.6 cm), the influence of blur is relatively small. The 0 cm depth interval comes with a slightly larger increase of perceived depth than 6cm depth interval. The reason might be because when the depth interval is 0cm, it seems to the observers that they are looking at a planar image with a sharp foreground and blurred background. For this kind of image, intentional blur has been introduced by photographers for a long time to induce some illusions of the existence of depth between the foreground and the background. When disparity differences appear in the image, observers start to notice that they are facing a stereoscopic image. This might be the reason why the 0cm depth interval shows a slightly larger increase of perceived depth than the 6cm depth interval. Starting from the second point (6.6 cm depth interval), the enhancement is monotonic.
Figure 7: Results from the experiment. The left figure shows the increase of perceived depth as a function of absolute position, while the right figure shows the increase of perceived depth as a function of relative distance. Note that each point on the curves might be obtained from different number of observations.
As shown by the curves in Figure 7, the overall tendency of how the depth interval (D_BB) and the absolute position of
the background (Da) affect the perceived depth seems easy to understand. However, we split the data from Table 1 and
computed the PSEs of every combination of D_BB and Da, we then found that the variations of PSEs are with some
uncertainties. In Figure 8, we plot a surface (consisting of blue points) which is obtained from the curve in Figure 7 (right), while the red points come from the PSEs which are computed individually by each combination of D_BB and Da.
The figure shows that the changes of perceived depth do not vary strictly according to the tendency we described previously. There exists a lot of variability at certain points. Namely, despite the overall tendency of how the blur affects perceived depth at different relative distance and absolute position is known, the predictions of perceived depth of objects at certain positions or the perceived depth of certain observers remain uncertain. Several types of analysis were performed in order to learn about the source of these aberrations. However, there was no indication found concerning a bi- or multimodal distribution of the observers. So the variance that is found in our experiment concerning the individual data points has to be considered as measurement noise for the moment.
-20 -10 0 10 0 100 200 300 400 500 600 700 Increa se of Perceiv ed Depth (a rc sec) Absolute Position (cm)
Increase of Perceived Depth (arc sec)
0 10 20 30 40 0 100 200 300 400 500 600 700 800 900 In crea s e of Perceived De pt h (arc sec ) Relative Distance (cm)
Figure 8: The surface consisting of blue points is generated from the curve in Figure 7 (right). We ignore the variance in the curve in Figure 7 (left), because the variance is relatively small. The red points are obtained from the PSEs which are computed individually by each combination of relative distance (D_BB and absolute position (Da).
4. CONCLUSIONS
The influence of defocus blur on the perceived depth in a stereoscopic scene and its relationship with binocular disparity were studied in this paper. The experimental result indicates that image blur makes contributions to the impression of depth perceived in stereoscopic images, when measured against depth perceived in stereoscopic images without blur. The increase of depth can be considered as a function of the relative distance between the fixated foreground ground object and the blurred background, while this increase is insensitive to the distance between the viewer and the depth plane at which the blur is added.
The feasibility of enhancing the perceived depth by reinforcing a monocular cue, namely defocus blur, provides an interesting way to deal with the conflict between accommodation and vergence when 3D images are shown on a planar stereoscopic display. Generally, the foreground object popping out of the screen is the most important object in the scene, while the large disparity of the object may lead to visual discomfort when it is actually fixated by the observer. Our results show that it is feasible to decrease the disparity of this object without losing its pop-out effect by adding some blur on its background.
5. REFERENCE
[1] A. PENTLAND, “A new sense for depth of field,” IEEE Transactions on Pattern Analysis and Machine Intelligence, 9(4), 523-531 (1987).
[2] S. Watt, K. Akeley, M. Ernst et al., “Focus cues affect perceived depth,” Journal of Vision, 5(10), (2005). [3] D. Hoffman, and M. Banks, “Focus information is used to interpret binocular images,” Journal of Vision, 10(5),
(2010).
[4] R. Held, E. Cooper, J. O'Brien et al., “Using blur to affect perceived distance and size,” ACM Transactions on Graphics (TOG), 29(2), 1-16 (2010).
[5] G. Mather, and D. Smith, “Depth cue integration: stereopsis and image blur,” Vision research, 40(25), 3501-3506 (2000).
[6] J. Marshall, C. Burbeck, D. Ariely et al., “Occlusion edge blur: a cue to relative visual depth,” Journal of the Optical Society of America A, 13(4), 681-688 (1996).
[7] G. Mather, “Image blur as a pictorial depth cue,” Proceedings: Biological Sciences, 263(1367), 169-172 (1996).
-20 -10 0 10 0 10 20 30 40 0 200 400 600 800 1000 Absolute Position (cm) Relative Distance (cm) In c rea s e of perc e iv ed dep th ( a rc s e c )
[8] S. Palmer, and J. Brooks, “Edge–Region Grouping in Figure–Ground Organization and Depth Perception,” Journal of Experimental Psychology, 34(6), 1353-1371 (2008).
[9] H. Cheng, J. Barnett, A. Vilupuru et al., “A population study on changes in wave aberrations with accomodation,” Journal of Vision, 4(4), (2004).
[10] W. Chen, J. Fournier, M. Barkowsky et al., "New requirements of subjective video quality assessment methodologies for 3DTV." Fifth International Workshop on Video Processing and Quality Metrics for Consumer Electronics - VPQM 2010.