UNIVERSITÉ DU QUÉBEC À MONTRÉAL
RÔLE DU BIOFILM EPIPHYTIQUE DANS L'ACCUMULATION, LA MÉTHYLATION ET LA DÉMÉTHYLATION DU MERCURE
THÈSE
PRÉSENTÉE
COMME EXIGENCE PARTIELLE
DU DOCTORAT EN BIOLOGIE
PAR
STÉPHANIE HAMELIN
UNIVERSITÉ DU QUÉBEC À MONTRÉAL Service des bibliothèques
Avertissement
La diffusion de cette thèse se fait dans le respect des droits de son auteur, qui a signé le formulaire Autorisation de reproduire et de diffuser un travail de recherche de cycles supérieurs (SDU-522 - Rév.01-2006). Cette autorisation stipule que «conformément à l'article 11 du Règlement no 8 des études de cycles supérieurs, [l'auteur] concède à l'Université du Québec à Montréal une licence non exclusive d'utilisation et de publication de la totalité ou d'une partie importante de [son] travail de recherche pour des fins pédagogiques et non commerciales. Plus précisément, [l'auteur] autorise l'Université du Québec à Montréal à reproduire, diffuser, prêter, distribuer ou vendre des copies de [son] travail de recherche à des fins non commerciales sur quelque support que ce soit, y compris l'Internet. Cette licence et cette autorisation n'entraînent pas une renonciation de [la] part [de l'auteur] à [ses] droits moraux ni à [ses] droits de propriété intellectuelle. Sauf entente contraire, [l'auteur] conserve la liberté de diffuser et de commercialiser ou non ce travail dont [il] possède un exemplaire.»
REMERCIEMENTS
Je tiens à remercier sincèrement ma directrice Dolors Planas et mon co -directeur Marc Amyot pour m'avoir tous deux accueillie au sein de leur laboratoire respectif, pour m'avoir formée, dirigée tout au long de mon doctorat, et surtout pour m'avoir poussée au-delà de mes limites. Sans votre aide précieuse, jamais cette thèse de doctorat n'aurait pu se concrétiser, et je vous en suis très reconnaissante.
Je dois aussi remercier chaleureusement Tamar Barkay, pour avoir contribué à mon instruction sur le monde des microbes ainsi que sur les techniques de microbiologie moléculaire. Mon apprentissage chez Tamar a dépassé de beaucoup mes attentes. Autant sur le plan des connaissances scientifiques, que sur le plan de mon évolution personnelle, je lui dois énormément.
Merci aux membres du jury de ma thèse : Jean-Claude Bonzongo, Catherine Jumarie et Paul Elliot Drevnick, qui ont contribué à faire progresser ma réflexion et à améliorer les manuscripts par leurs commentaires constructifs.
Merci à tous mes valeureux assistants de terrain, qui ont sacrifié de nombreuses heures de sommeil, notamment lors des expériences de méthylation et déméthylation. Je n'oublierai jamais nos heures de délire sur les flots du lac St-Pierre ...
Merci à mes collègues de laboratoire, autant Planassiens que Amyotiens, et plus particulièrement à Mélanie Desrosiers, Alexandre Poulain, Fabien Cremona et John Chételat. Merci pour toutes les discussions, les critiques, les séances de remise en question, les suggestions et les conseils ... et bien sûr aussi pour toutes les bonnes soirées passées entre amis pour épurer tout ça.
Merci à Serge Paquet, pour m'avoir aidée à comprendre mes analyses statistiques, pour m'avoir dépannée chaque fois que j'en ai eu besoin, et tout
Ill
simplement pour sa générosité et sa gentillesse au quotidien. Serge, une source de connaissances incommensurables ...
Merci à Dominic Bélanger pour son aide à résoudre les problèmes lors des analyses de mercure et de méthylmercure, mais aussi pour avoir égayé de sa présence les nombreuses heures passées devant les appareils.
Merci à mes parents, Diane Plante, Jean Hamelin et Lise Nicolas pour m'avoir encouragée et soutenue tout au long du parcours. Merci d'avoir été présents dans les moments difficiles, pour les bons mots, pour les petits plats maison et pour la résolution de tous les problèmes informatiques qui surviennent toujours au moment où il ne faut pas ... Merci énormément à vous trois.
Merci à tous mes amis et partenaires de défis sportifs. L'adrénaline a été sûrement le stimulant le plus important pour m'aider à rédiger cette thèse de docotorat, et je vous en suis redevable. Que ce soit avec mon Argon, les raquettes ou le canot, je suis maintenant prête à reprendre la course avec vous ...
Merci enfin à mon compagnon de vie, Tuan Nguyen, qui a su m'épauler pendant les derniers moments de ma thèse. Merci pour ta patience face à mes horaires de fous entre la rédaction des articles et l'enseignement, pour ta discrétion en période de stress, et pour t'être occupé de tout lorsque j'étais trop absorbée par ma thèse pour penser à autre chose. Merci Tuan d'être l'amoureux extraordinaire que tu es.
AVANT -PROPOS
Cette thèse de doctorat regroupe trois chapitres sous la forme d'articles destinés à être publiés dans des journaux scientifiques. Afin d'en faciliter la publication, ces articles ont été rédigés en anglais, et sont précédés d'une introduction et suivis d'une conclusion générales, toutes deux écrites en français. Le premier chapitre porte sur les variations spatio-temporelles de la biomasse et des concentrations en mercure et méthylmercure des épiphytes et des macrophytes, qui sera soumis à la revue Environmental Pollution. Le deuxième chapitre, quant à lui traite des taux de méthylation et de déméthylation du mercure par les biofilms épiphytiques et sera soumis à la revue Science of the Total Environment. Finalement, dans le troisième chapitre, il a été question d'identifier les principaux groupes de micro-organismes responsables de la méthylation du mercure au sein du biofilm épiphytique. Ce dernier article a été publié en 2011 dans la revue Environmental Science and Technology.
En ce qui concerne la contribution relative des différents auteurs de ces articles, personnellement en tant qu'auteur principal, j'ai rédigé le projet de recherche avec l'encadrement de ma directrice Delors Planas et de mon co-directeur Marc Amyot. J'ai ensuite préparé et effectué l'échantillonnage au lac St-Pierre avec l'aide d'assistants de recherche. J'ai réalisé l'ensemble des analyses de laboratoire (à l'exception des analyses d'isotopes de mercure qui ont été faites au laboratoire d'Holger Hintelmann, à l'université de Trent), des analyses de données et de la rédaction de la thèse. Pour le dernier chapitre, j'ai bénéficié de l'aide de Tamar Barkay et de Yanping Wang qui m'ont formée, puis encadrée afin que je puisse faire moi-même les analyses microbiologiques menant au séquençage d'ADN. Ma directrice Delors Planas et mon co-directeur Marc Amyot ont collaboré tous deux à l'écriture des trois articles en commentant et en corrigeant chacun de mes manuscripts.
TABLE DES MATIÈRES
AVANT -PROPOS ... iv
LISTE DES FIGURES ... ix
LISTE DES TABLEAUX ... xi
RÉSUMÉ ... xii INTRODUCTION GÉNÉRALE ... l CHAPITRE 1 SPATIO-TEMPORAL VARIATIONS IN BIOMASS AND MERCURY CONCENTRATIONS OF EPIPHYTIC BIOFILMS AND THEIR HOST IN A LARGE RIVER WETLAND (LAKE ST. PIERRE, QC, CANADA) ... 10
1 .1 Abstract ... 11
1.2 Introduction ... 12
1. 3 Materials and methods ... 14
1.3.1 Study site ... 14
1.3.2 Sampling ... 15
1.3.3 Biomass (chlorophyll-a, dry weight and ash free dry weight) ... 16
1.3.4 Total mercury and methylmercury analysis ... 17
1.3.5 Statistical analyses ... 18
1.4 Results ... 18
1.4.1 Biomass ... 18
1.4.2 THg and MeHg concentrations ... 19
1.4.3 Factors influencing THg and MeHg in epiphytes and macrophytes ... 20
1.5 Discussion ... 21
1. 5.1 Spatial variability ... 21
1.5.2 Hg and MeHg concentrations ... 22
1.5.3 Factors affecting THg and MeHg concentrations in epiphytes and macrophytes ... 25
1.6 Conclusion ... 27
1. 7 Acknowledgments ... 27
1.8 Figure captions ... 32
CHAPITRE Il
MERCURY METHYLATION AND DEMETHYLATION BY EPIPHYTIC BIOFILMS AND THEIR HOST IN A FLUVIAL WETLAND OF THE ST. LAWRENCE RIVER
Vl (QG, CANADA) ... 44 2.1 Abstract ... 45 2.2 Introduction ... 46 2.3 Methodology ... 47 2.3.1 Study site ... 47 2.3.2. Sampling ... 48 2.3.3 Methylation/demethylation assays ... 49
2.3.4 THg and MeHg Analyses ... 51
2.3.5 Statistical analyses ... 51
2.4 Results ... 52
2.4.1 Hg methylation and MeHg demethylation rates: effect of depth, substrate (macrophyte species) and station ... 52
2.4.2 Seasonnal and inter-annual variations of methylation and demethylation rate constant. ... 53
2.5 Discussion ... 54
2.5.1 Hg methylation and MeHg demethylation ... 54
2.5.2 Factors controlling Km and Kct in Lake St. Pierre ... 56
2.6 Conclusions ... 59
2. 7 Acknowledgements ... 59
2.8 Figure captions ... 60
2.9 References ... 65
CHAPITRE Ill METHANOGENS: PRINCIPAL METHYLATORS OF MERCURY IN LAKE PERIPHYTON ... 71
3.1 Abstract ... 72 3.2 Introduction ... 73 3.3 Methods ... 74 3.3.1 Study site ... 74 3.3.2 Sampling ... 75 3.3.3 Methylation/demethylation assays ... 75
- - - --- - - -- -- -- - - -- - - ,
Vll
3.3.4 Biomass determinations ... 77
3.3.5 THg and Me Hg analyses ... 77
3.3.6 Algal and microbial production ... 78
3.3.7 Microbial community characterization ... 78
3.4 Results ... 80
3.4.1 Periphyton biomass, total and methylmercury concentrations ... 80
3.4.2 Mercury methylation and demethylation rates ... 81
3.4.3 Effect of inhibitors on primary production and microbial production ... 81
3.4.5 Effect of inhibitors on mercury methylation and demethylation rates ... 81
3.4.6 Characterization of the active microbial community ... 82
3.5. Discussion ... 82
3.5.1 Mercury methylation and demethylation rates in periphyton ... 83
3.5.2 Effect of metabolic inhibitors on mercury methylation and demethylation .... 84
3.6 Acknowledgements ... 88
3.7 Supporting information Available ... 88
3.8 Figure captions ... 89
3.9 References ... 92
CONCLUSION GÉNÉRALE ... 98
ANNEXE A PHYSICO-CHEMICAL PROPRIETIES OF THE WATER IN LAKE ST.PIERRE (2002-2004, DATA FROM 2002 ARE ADAPTED FROM CARON, ET AL. 2008) ... 106
ANNEXE 8 PHYSICO-CHEMICAL PROPRIETIES OF THE WATER MEASURED IN STATIONS GIRODEAU AND BSF WHEN METHYLATION AND DEMETHYLATION WERE COMPARED BETWEEN 80TH STATIONS (SEPTEMBER 2004, 30 CM DEPTH) ... 107
ANNEXE C PHYSICO-CHEMICAL PROPRIETIES OF THE WATER AT GIRODEAU STATION DURING THE METHYLATION AND DEMETHYLATION MEASUREMENTS WITH AND WITHOUT INHIBITORS, AUGUST 2004 ... 108
ANNEXE D SUPPLEMENTARY INFORMATIONS FOR WA TER SAMPLES COLLECTION AND ANAL YSIS ... 109
ANNEXEE
CLONES REPRESENTING ACTIVE BACTERIA AND ARCHAEA IN PERIPHYTON SAMPLES FROM MHG/DHG INCUBATIONS WITH AND WITHOUT METABOLIC INHIBITORS. BACTERIAL CLONES WERE OBTAINED FROM BACTERIAL LIBRARY WITH PRIMERS 27F/519R AND ARCHAEAL CLONES WERE OBTAINED FROM ARCHAEAL LIBRARY
Vlll
WITH PRIM ERS 344F/ 907R ... 110 ANNEXE F
COURSE OF ISOTOPIC MEHG (MEAN± STANDARD ERROR) DURING 48H METHYLATION/DEMETHYLATION INCUBATION USING ME200HG
AND ME199HG ... 112 ANNEXE G
MEAN MERCURY METHYLATION AND DEMETHYLATION RATES FOLLOWING 48H INCUBATION WITH AND WITHOUT ADDITION OF
METABOLIC INHIBITORS ... 113 RÉFÉRENCES DE L'INTRODUCTION ET DE LA CONCLUSION
Figure 1.1 1.2 1.3 1.4 1.5 2.1
LISTE DES FIGURES
Maps of Canada and Lake St. Pierre (St. Lawrence River, Québec, Canada) with the four sampling stations Girodeau Island (GIR), Maskinongé Bay (MASK), St. François Bay (BSF) and
Anse-du-Page
Fort (ADF) ... 33
Mean (±standard error) of seasonnal variations observed in four stations of Lake St.Pierre. A) epiphyte biomass (chlorophyll-a) B)macrophyte biomass, C) [THg] in epiphytes, D) [THg] in
macrophytes, E) [MeHg] in epiphytes, F) [MeHg] in macrophytes. Repeated time analysis of variance indicate very high significant differences between month (p < 0.0001) and stations (p < 0.0001), * marks significant difference between stations in a given month. Open symbols represent south shore stations, black symbols north shore stations, dash line indicate a successional change in august in the dominant macrophyte specie for 3 out of 4 stations (from Potamogeton perfo/iatus in ali stations at the beginning of the summer to Elodea canadensis in GIR, Val/isneria americana in Mask and Ceratophyllum demersum in BSF). N=9 for each
point in the graph ... 34
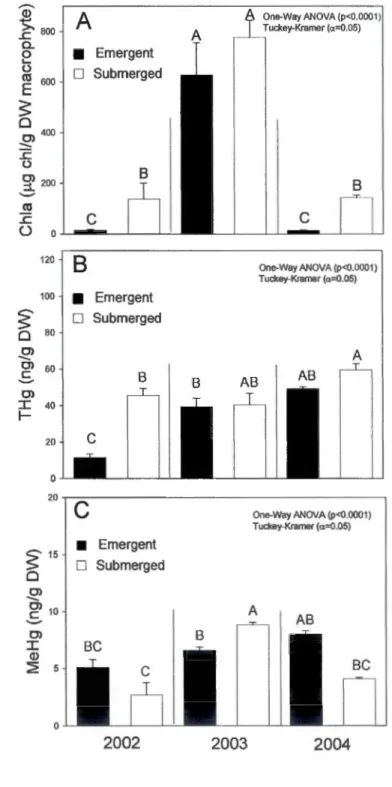
lnterannual mean (±standard error) variations in epiphytes from BSF between 2002 and 2004 (August data) a) Chlorophyll-a; b) [THg] and c) [MeHg]. One-Way ANOVA found significant (p < 0.0001) differences between years. Significant differences between years (Tukey-Kramer test, a <O. 05) are marked by
capital letters. For each bar, N=9 ... 35
Relationship between [THg] in epiphytes from different macrophyte species and the Autotrophic Index at the Baie
St. François in 2002 (N=39) ... 36
Principal component analysis of environmental descriptors and A) and B) [THg] and [MeHg] in epiphytes, the first 3 principal axes explained 68% of the variance; C) and D) [THg] and [MeHg] in macrophytes, the first 3 principal axes
explained 69% of the variance (N=41 ) ... 37
Mean Hg methylation and MeHg demethylation rates (± standard error) in epiphytes; A) on Ceratophyllum demersum at 3 different depths (0, 30 and 60 cm) in BSF, July 2003 B) on 3 different macrophytes at their in situ depth (Macroalgae at 0 cm, Ceratophyllum demersum at 30 cm and
Vallisneria americana at 60 cm) in BSF, July 2003; C) on Potamogeton perfoliatus at 3 different depths {0, 30 and 60 cm) in GIR, June 2004 D) on Potamogeton perfoliatus and Scirpus fluviatilis at 30 cm depth in GIR, June 2004; E) on Elodea canadensis at 30 cm depth in BSF and GIR, September 2004.
x
For each bar, N=3 replicates ... 61 2.2 Mean (± standard error) Hg methylation rates (black dots), MeHg
demethylation rates (white dots) and net MeHg production (grey bars) in epiphytes growing on dominant submerged macrophytes, in GIR from May to September 2004. Repeated time analysis of variance showed significant differences between months (Km: p=0.0124;
Ki:
p
= 0.0054 and Net MeHg production : p = 0.0118). Dash line indicate a successional change in August in thedominant macrophyte species (from P. perfoliatus at the
beginning of the summer to E. canadensis in August). For each
point or bar, N= 3 ... 62 2.3 Linear regression of MeHg concentrations in epiphytes in
function of Hg methylation rate and linear regression of inorganic Hg concentrations in epiphytes in function of MeHg demethylation rates ... 63 2.4 lnter-annual variations of mean (±standard error) Hg methylation
and MeHg demethylation in epiphytes from C. demersum in BSF, September 2002-2003-2004. For each bar, N= 3; MeHg
demethylation was not measured in 2002 ... 64 3.1 Effect of inhibitor addition (mean± standard error) on epiphytie
community as compared to control treatment during 48h
incubation A) Photosynthesis production, B) Microbial production, C) Mercury methylation rate constants (Km d-1) D) Mercury
demethylation rate constants (Kd d-1). *shows treatments that are
significantly different from control (Dunnett's test, a =0,05) ... 90 3.2 Proportion of each taxa representing active Bacteria and Archaea
in periphyton samples from MHg/DHg incubations with and without metabolic inhibitors. Clone identification is based on DNA sequences and groups established by RFLP patterns. The libraries obtained with primer sets targeting archaeal (344f/ 907r) and bacterial (27f/519r) were combined for presentation of each treatment results. The decaled portions and the associated percentage correspond to the methanogens. Archaeal orders are denoted by bold italie font and bacterial orders by italie font
Tableau
1.1
1.2
1.3
LISTE DES TABLEAUX
Mean Biomass (in g DW m-2), [THg] and [MeHg] (both in ng Hg g DW-1) ±standard error in epiphytes and their host at the BSF in
Page
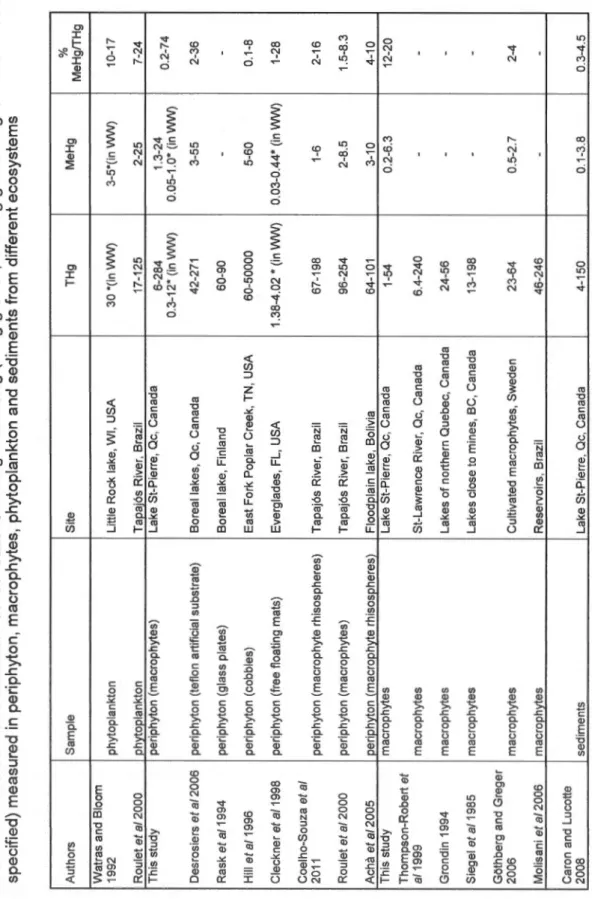
August 2002 (nd= non-detectable) ... 29 Means and ranges of [THg] and [MeHg] in epiphytes and macrophytes. Data are pooled from 2002 to 2004, and separated by stations and dominant macrophyte species (nd= non detectable) ... 30 Minimum and maximum concentrations of THg and MeHg (in ng g DW-1, or in ng g wet weighf1 when WW is specified) measured in periphyton, macrophytes, phytoplankton and sediments from
RÉSUMÉ
Au sein des écosystèmes aquatiques, la contamination des organismes vivants
par le mercure (Hg) continue à être un sujet de préoccupation pour la santé humaine
et les écosystèmes dans de nombreux pays. Il est généralement admit que les
milieux humides et les herbiers de plantes aquatiques jouent un rôle important dans
les processus de filtration et de stockage des contaminants. Cependant, en ce qui
concerne le Hg, le rôle des communautés littorales, particulièrement des épiphytes
(biofilms périphytiques recouvrant les plantes aquatiques) et des macrophytes, dans l'accumulation et la méthylation du Hg (transformation du Hg en méthylmercure,
MeHg) est mal connu. En effet, il existe très peu de données sur leurs
concentrations en Hg et en MeHg en zone tempérée froide ainsi que sur les variables environnementales influençant les variations spatio-temporelles de ces concentrations, ainsi que sur la production nette de MeHg dans les épiphytes et les
macrophytes. Considérant le fait que ces organismes se trouvent à la base de la
chaîne alimentaire et qu'ils peuvent potentiellement transférer le Hg et le MeHg
accumulés aux autres organismes des maillons trophiques supérieurs, le but global
de cette étude était de vérifier la contribution des complexes épiphytes/macrophytes
dans les processus de méthylation, déméthylation et d'accumulation du Hg et du
MeHg afin d'assurer une meilleure gestion du de ces polluants dans les
écosystèmes aquatiques. Les objectifs étaient: 1) mesurer les concentrations de Hg
et MeHg dans les épiphytes et les macrophytes; 2) évaluer l'effet de la saisonnalité
(température et lumière), de la proportion d'organismes autotrophes au sein du
biofilm, de l'espèce de macrophytes et des carctéristiques chimiques du site sur les concentrations de Hg et MeHg dans les épiphytes et les macrophytes; 3) mesurer in situ les taux de méthylation et de déméthylation du Hg des complexes épiphytes/macrophytes; 4) évaluer l'influence de la lumière, de la température et de l'espèce de macrophyte sur les taux de méthylation, déméthylation et de production
nette de MeHg des complexes épiphytes/macrophytes; 5) identifier les principaux
microorganismes méthylateurs au sein du biofilm épiphytique par l'ajout d'inhibiteurs métaboliques spécifiques et par la charactérisation des microorganismes actifs
(séquençage de gènes 16S rRNA), le tout simultanément aux mesures de
méthylation/déméthylation. Cette étude a été réalisée dans les herbiers aquatiques
du lac St-Pierre, un élargissement du fleuve St-Laurent (Québec, Canada). Lors du
suivi saisonnier des concentrations de Hg et de MeHg, celles-ci étaient
généralement un ordre de grandeur plus élevées dans les épiphytes que dans les
macrophytes. Les concentrations en Hg dans les épiphytes diminuaient linéairement en fonction de l'indice d'autotrophie du biofilm épiphytique, et les proportions de
MeHg/THg dans les épiphytes ont atteint des valeurs aussi élevées que 74%. Les
variables ayant une plus grande influence sur les variations spatio-temporelles de
concentrations en Hg et MeHg observées dans les épiphytes et les macrophytes
étaient la température de l'eau, le % de lumière disponible, l'espèce de macrophyte, le niveau d'eau, ainsi que le carbone organique. Les mesures des taux de méthylation et de déméthylation avec ajout d'isotopes stables de 199Hg0 et de
X Ill
site important de méthylation du mercure, à des taux semblables à ce qui a été mesuré en milieu tropical et subtropical. Par contre, la méthylation n'a pas été détectée dans les macrophytes. La production nette de MeHg (normalisée par unite de masse d'épiphytes) varie au cours de la saison de croissance et semble être influencée par la lumière disponible, la température, la productivité du milieu ainsi que par la structure des communautés. Finalement, les mesures de taux de methylation et déméthylation du Hg effectuées avec ajout d'inhibiteurs ont révélé que que différents microorganismes au sein des épiphytes ont un rôle à jouer dans les processus de méthylation. Les résultats suggèrent que les méthanogènes seraient les principaux organismes méthylateurs des biofilms épiphytiques du lac St-Pierre, conclusion qui est supportée par la détection de séquences de gènes ) 6S rRNA propres au méthanogènes.
INTRODUCTION GÉNÉRALE
Le mercure (Hg) est naturellement présent dans les écosystèmes aquatiques à
de faibles concentrations. L'usage industriel de ce métal, la combustion du charbon
et du pétrole, l'épandage de produits organomercuriels en agriculture, ainsi que la
propriété du Hg à être transporté par l'atmosphère à grande échelle ont contribué à
augmenter mondialement les concentrations de Hg dans les systèmes d'eau douce,
les sédiments et les organismes vivants, et ce, même dans les régions éloignées de
toute influence anthropique (Rada, et al., 1989; Lindqvist, et al. 1991 ). La toxicité du
Hg en milieu aquatique dépend des espèces chimiques présentes et de leur
solubilité dans l'eau (Ciarkson, 1998). Le méthylmercure (MeHg), une des formes les
plus toxiques (produit par la méthylation du Hg inorganique), a la capacité de se
bioaccumuler et d'être bioamplifié au long du réseau trophique (Bioom, 1992;
Boening, 2000).
Dans les environnements ·aquatiques où les sources ponctuelles de Hg sont
inexistantes, les dépositions atmosphériques, le ruissellement, et la percolation sont
les principales voies d'entrée du Hg (Andersson, 1979; Rada, et al., 1989; Mierle,
1990; Wiener, et al., 1990; Aastrup, et al., 1991). Le Hg atmosphérique est
principalement inorganique, le Hg élémentaire (Hg0
) comptant pour 95 % de sa
composition. Il voyage dans l'atmosphère jusqu'à ce qu'il soit oxydé, puis il se
dépose, loin des sources, dans l'écosystème terrestre ou aquatique sous forme de
précipitations sèches ou humides (Poissant et Casimir, 1998). En présence d'acides humiques dissous, le Hg s'y lie (Meili, et al., 1991; Mierle et Ingram, 1991 ), ce qui contribue à augmenter sa persistance dans les sols et dans l'eau (Sorensen, et al., 1990). Les concentrations de Hg retrouvées dans les organismes vivants sont le résultat de processus de méthylation du Hg s'effectuant au sein du milieu aquatique.
En effet, le Hg qui rentre dans le système aquatique par voie atmosphérique ou terrestre est majoritairement sous forme inorganique (Fitzgerald et Clarkson, 1991 ). Alors, la question suivante se pose : Où et comment cette transformation de Hg à MeHg se produit-elle ?
2
Il est généralement admit que les milieux humides et les herbiers de plantes aquatiques jouent un rôle important dans les processus de filtration et de stockage des conta minants (Westling, 1991 ). Les plantes aquatiques agissent comme support pour le périphyton (Godward, 1937; Burkholder, 1996) et constituent une source d'alimentation pour les organismes herbivores (Sheldon, 1987; Eiger et Lemoine,
2005). Les lits de macrophytes sont des sites d'alimentation ou de refuge pour le zooplancton, les macroinvertébrés et les poissons (Lodge et Lorman, 1987; Burks, et al., 2001). Pour quelques espèces de poissons, (e.g. brochet, esturgeon), les herbiers sont l'habitat choisi pour frayer. Il a été démontré que les macrophytes réduisent la vitesse du courant, ce qui a pour effet d'augmenter la sédimentation des particules auxquelles les métaux sont associés. Les macrophytes agissent aussi sur le cycle diurne de l'oxygénation de l'eau, ce qui influence la biodisponibilité des métaux dissous. En effet, les conditions oxiques ont tendance à favoriser l'adsorption du Hg et du Me Hg par les sédiments, alors que les conditions anoxiques en favorisent le relargage vers la colonne d'eau (Reg nell et Tunlid, 1991 ). Les macrophytes sont souvent utilisées comme organismes indicateurs afin de mesurer la contamination en métaux dans les milieux aquatiques (Campbell, et al., 1985; Coquery et Welbourn, 1994; Hudon, 1998). La capacité des complexes épiphytes/macrophytes à accumuler les métaux et leur position à la base de la chaîne alimentaire suggèrent qu'ils jouent un rôle important dans le cycle des métaux au sein des lacs, en les transférant aux organismes qui les consomment,
comme c'est le cas avec le Hg (Cremona, et al., 2009), en les excrétant dans la
colonne d'eau via leurs stomates (Kraus, et al., 1986), ou ou encore en les relargant
lors de leur décomposition (Larsen et Schierup, 1981). Les concentrations en
métaux des plantes aquatiques varient en fonction des espèces, de leur stade de
croissance et de leur activité métabolique (Mudroch et Capobianco, 1979; Hudon,
1998). Ainsi elles devraient varier tout au long de la succession estivale.
Dans la zone littorale des lacs, on retrouve le périphyton. La communauté périphytique est une matrice complexe composée d'algues, de bactéries, de
3
champignons, de micro-invertébrés, de détritus et dépôts inorganiques (Young, 1945; Sand-Jensen et Wetzel, 1983). Ce biofilm constitue un microenvironnement où l'on peut trouver des variations spatiales (selon les différentes couches d'épaisseur) et temporelles du potentiel d'oxydo-réduction (J0rgensen, et al., 1983; Revsbech, et al., 1983). Le gradient de concentration d'oxygène crée des niches spécifiques permettant à différents groupes de microorganismes (autotrophes et hétérotrophes) de co-exister au sein du consortium périphytique. Le périphyton peut être attaché à une variété de substrats (sédiments, roches, macrophytes, etc.). Celui qui croît sur des plantes aquatiques est appelé épiphyton (ou épiphytes). Les épiphytes sont les contributeurs principaux de la production primaire des milieux humides, des rivières et des lacs (Cattaneo et Kalff, 1980; Loeb, et al., 1983; Goldsborough et Robinson, 1996) et sont à la base de la chaîne alimentaire littorale (Vadeboncoeur, et al., 2002), les organismes s'alimentant dans les herbiers les consommant préférentiellement (Cremona, et al., 2009). Les variables ayant un effet sur la biomasse des épiphytes sont la température, les éléments nutritifs et l'abondance des organismes brouteurs (Kairesalo, 1983; Wetzel, 1983b; Lowe, 1996). La quantité de lumière est tout aussi importante puisqu'elle régule la photosynthèse et la croissance (Hill, 1996), la composition spécifique des algues (Steinman et Mclntire, 1986) au sein du biofilm ainsi que leur succession saisonnière (Tuji, 2000). L'architecture de la plante elle-même va aussi influencer la biomasse des épiphytes, soit par l'altération du régime lumineux en créant de l'ombrage, soit par sa structure même: les macrophytes ayant des feuilles finement découpées tendent à développer une plus grande biomasse épiphytique, due à leur plus grande surface de colonisation disponible (Gosselain, et al., 2005)
Le périphyton est situé à l'interface des milieux aquatiques et terrestres et est capable de retenir les éléments chimiques, incluant le Hg inorganique, transporté par les eaux de ruissellement et de percolation. En raison de sa position à la base du réseau trophique, il peut influencer l'ensemble des maillons supérieurs du réseau (Hill, et al., 1996). L'accumulation de Hg par le périphyton a été mesurée dans quelques études. Cependant, la plupart d'entre elles ont été réalisées en région
4
tropicale et subtropicale (Cieckner, et al., 1998; Guimaraes, et al., 2000; Roulet, et al., 2000; Mauro, et al., 2002; Huguet, et al., 201 0), alors que celles faites en milieu tempéré sont rares (Rask, et al., 1994; Desrosiers, et al., 2006b). De plus, il n'y a présentement que peu d'informations disponibles sur les variations saisonnières des concentrations de Hg et de MeHg des épiphytes et macrophytes sous nos latitudes. Considérant l'importance des milieux humides dans les écosystèmes aquatiques de l'hémisphère nord (Keddy, et al., 2009), et en particulier au Canada où ils couvrent 14 % de la surface terrestre (Mike Arts, communication personnelle), il apparaît crucial d'obtenir davantage de données sur les concentrations en Hg et en MeHg des épiphytes et des macrophytes en région tempérée froide, ainsi que sur les facteurs environnementaux influençant ces concentrations, afin de pouvoir mieux prédire la contamination potentielle des poissons, puis des êtres humains.
La méthylation des métaux, incluant le Hg, a été proposée comme un mécanisme de détoxification par les microorganismes (Gadd et Griffiths, 1978). Il semblerait que le MeHg soit synthétisé à l'intérieur de la cellule via la voie de synthèse de l'acétyi-CoA par un transfert du groupe méthyl de la méthylcobalamine (un corrinoïde) à un ion Hg (Choi et Bartha, 1993; Choi, et al., 1994). La méthylcobalamine est utilisée par les microorganismes lors de la synthèse des acides aminés tandis que l'acétyi-CoA intervient dans la formation de glucose (cycle du glyoxylate), des acides gras et dans le cycle de Krebs lors de la respiration (Horton, et al., 1994). Jusqu'à présent, les recherches sur la méthylation du Hg se
sont surtout concentrées sur les sédiments, et en particulier sur les bactéries sulfata
-réductrices, identifiées comme les principaux microorganismes méthylateurs (Compeau et Bartha, 1985; Callister et Winfrey, 1986; Matilainen, et al., 1991). Il y a
peu de données sur les organismes, autres que les bactéries, qui peuvent méthyler le Hg (Kerry, et al., 1991; Matilainen, 1995). La production de MeHg a aussi été
mesurée dans les sols terrestres (Rogers, 1977), la colonne d'eau (Furutani et Rudd,
1980; Xun, et al., 1987), dans les sédiments (Compeau et Bartha, 1985; Gilmour et Riedel, 1995) et dans le périphyton. Les études effectuées sur l'importance du
5
nombreuses (Cieckner, et al., 1999; Guimaraes, et al., 2000; Mauro, et al., 2002; Acha, et al., 2005; Desrosiers, et al., 2006a) et les incubations sont généralement réalisées en conditions contrôlées en laboratoire plutôt qu'in situ. Mais, lorsque les compartiments épiphytes et sédiments sont comparés, il semble que les épiphytes soient plus importantes que les sédiments comme site de méthylation du Hg (Cieckner, et al., 1999; Guimaraes, et al., 2000). En région tempérée, les marécages sont reconnus pour être des sites de production de MeHg pour les écosystèmes aquatiques (Hurley, et al., 1995; St. Louis, et al., 1996; Waldron, et al., 2000), la méthylation du Hg par les épiphytes de ces écosystèmes doit être quantifiée.
La déméthylation du Hg est le processus inverse de la méthylation et elle se produit simultanément, d'où l'importance de mesurer ensemble la méthylation et la déméthylation du Hg afin d'évaluer la production nette de MeHg. La déméthylation vise à séparer le groupement CH3 de l'ion Hg qui peut ensuite être excrété à l'extérieur de la cellule. Il existe deux voies métaboliques possibles à la déméthylation, la voie de l'enzyme organomercurielle MerB (Robinson et Tuovinen, 1984) et la voie oxydative (Oremland, et al., 1991). Plusieurs groupes de bactéries sont capables de méthyler et déméthyler le Hg, mais la contribution de ces différents groupes n'est pas encore bien définie. Jusqu'à présent, les seules études effectuées simultanément sur la méthylation et la déméthylation du Hg par les épiphytes n'ont été faites qu'en milieu sub-tropical (Acha, et al., 2005).
Au sein d'un même lac, les taux de méthylation du Hg peuvent varier de façon spatiale et saisonnière. La méthylation ne dépend pas seulement des concentrations initiales de Hg biodisponible, mais aussi de certaines variables du milieu: l'activité biologique microbienne, la température de l'eau (Wright et Hamilton, 1982) (Callister et Winfrey, 1986; Bodaly, et al., 1993), le pH (Miskimmin, et al., 1992), le potentiel redox (Matilainen, et al., 1991), les formes de soufre présentes, et les concentrations de matière organique (UIIrich, et al., 2001).
6
Le but général de cette thèse de doctorat était de vérifier l'importance des communautés littorales en tant que sites de méthylation du Hg et source potentielle de Hg pour les réseaux trophiques aquatiques. Les objectifs de cette étude étaient de: 1) mesurer les concentrations de Hg total (HgT) et Me Hg dans les épiphytes et les macrophytes submergés et émergentes ; 2) évaluer l'effet de la saisonnalité (température et lumière), de la proportion d'organismes autotrophes au sein du biofilm épiphytique, de l'espèce de macrophytes et des caractéristiques chimiques du site sur les concentrations de HgT et de MeHg dans les épiphytes et les macrophytes; 3) mesurer in situ les taux de méthylation et de déméthylation du Hg des complexes épiphytes/macrophytes; 4) évaluer l'influence de la lumière, de la température et de l'espèce de plante hôte sur les taux de méthylation, déméthylation et de production nette de MeHg des complexes épiphytes/macrophytes; 5) identifier les principaux microorganismes méthylateurs au sein du biofilm épiphytique par l'ajout d'inhibiteurs métaboliques spécifiques et par la charactérisation des microorganismes actifs (séquençage de gènes 16S rRNA), le tout simultanément aux mesures de méthylation/déméthylation.
L'une des hypothèses de ce projet était d'observer un effet de la lumière et la température sur les concentrations en HgT, MeHg, ainsi que sur les taux de production nette de MeHg. En effet, comme ci-haut mentionné, la quantité de lumière disponible régule la photosynthèse et la croissance des épiphytes (Hill, 1996), la composition spécifique des algues (Steinman et Mclntire, 1986) au sein du biofilm ainsi que leur succession saisonnière (Tuji, 2000). La lumière pourrait donc influencer l'accumulation de Hg ainsi que les taux de méthylation et de déméthylation du Hg, soit en stimulant le métabolisme des algues (et conséquemment aussi des autres microorganismes inclus dans dans le périphyton), soit en induisant des changements d'espèces présentes au sein du biofilm épiphytique. La lumière a aussi un effet sur la disponibilité du Hg et du MeHg de l'eau pour les processus de méthylation et de déméthylation, soit en photodégradant le MeHg (Sellers, et al., 1996) ou en photoréduisant le Hg(ll) (Amyot, et al., 1997).
7
En ce qui concerne la température, il a été démontré en laboratoire, avec les sédiments, que les taux de méthylation du Hg sont directement proportionnels à la température, jusqu'à un seuil de == 35°C (Callister et Winfrey, 1986) (Korthals et Winfrey, 1987). Par exemple, Wright et Hamilton (1982) ont observé que la quantité de MeHg relarguée par les sédiments à 4°C n'était que 50-70% de celle mesurée à 20°C. Cependant, les effets synergiques et antagonismes des autres variables reliées à la température ne doivent pas être écartés. Or, il est admit que les faibles températures ralentissent généralement la productivité microbienne (Bisogni et Lawrence, 1975). Puisque les concentrations de MeHg sont le résultat net du bilan de méthylation/déméthylation, une augmentation de la méthylation nette peut être aussi partiellement due à une baisse des taux de déméthylation plutôt qu'à une réelle augmentation des taux de méthylation. En effet, les taux de déméthylation semblent être inversement proportionnels à la température, alors que c'est le contraire pour les taux de méthylation, ce qui peut mener à une plus large production nette de MeHg durant les périodes chaudes (Ramlal, et al., 1986; Bodaly, et al., 1993).
Une autre hypothèse était d'observer des concentrations de HgT et de MeHg différentes dans les épiphytes et les macrophytes en fonction de l'espèce de macrophyte. Les macrophytes enracinées peuvent absorber le Hg de l'eau, et aussi des sédiments (Campbell, et al., 1985; Crowder, 1991). Tout dépendant de leur morphologie (i.e. une plus grande surface de contact au niveau racinaire par rapport à la tige et aux feuilles), les macrophytes absorberont davantage le Hg de l'une ou l'autre des 2 sources (sédiments ou colonne d'eau), ceci ayant pour effet d'induire des différences de concentrations en Hg selon les espèces. Bien que le sujet soit controversé, les macrophytes ne sont pas un support inerte pour les épiphytes, et des échanges d'éléments chimiques peuvent avoir lieu entre l'hôte et le biofilm (Wetzel, 1983a). Ces échanges ont été démontrés, notamment, avec les éléments nutritifs (Allen, 1971; Moeller, et al., 1988), et ceux-ci diffèrent selon le stade de croissance de la plante. L'espèce de macrophyte, de par sa morphologie, a aussi un impact sur la biomasse et l'activité métabolique des épiphytes (Gosselain, et al.,
8
2005) ainsi que sur leur composition spécifique (Pipet Robinson, 1984), notamment en interférant dans le régime lumineux disponible pour les épiphytes, toutes ces conditions pouvant influencer leurs concentrations en Hg et MeHg ainsi que leur activité de méthylation et déméthylation du Hg.
La productivité du milieu devrait aussi influencer positivement les taux de méthylation du Hg puisqu'il augmente l'activité métabolique des microorganismes (Cieckner, et al., 1999). En effet, Cleckner et al. (1999) ont mesuré des taux de méthylation plus élevés dans le périphyton situé dans les zones les plus eutrophes des Everglades par rapport aux autres stations moins productives. L'état trophique du milieu a une influence, non seulement sur l'activité métabolique, mais sur la structure de la communauté. En effet, le type de microorganismes présents dans la communauté (espèces de bactéries et/ou algues) peut influencer, par différentes voies métaboliques impliquées (aérobie/anaérobie; autotrophes/hétérotrophes), les taux de méthylation et de déméthylation du Hg (Macalady, et al., 2000).
L'échantillonnage pour ce projet a été réalisé dans les herbiers aquatiques du lac St-Pierre, un élargissement du fleuve St-Laurent (Québec, Canada). Les travaux de recherche qui en découlent ont fait partie des activités d'un réseau de recherche pan-canadien supporté par le CRSNG, le Réseau Collaboratif de Recherche sur le Mercure (COMERN), plus précisément de l'étude de cas du fleuve St-Laurent.
Le premier chapitre de cette thèse est consacré essentiellement aux objectifs 1 et 2. Les concentrations de HgT et de MeHg des épiphytes et des macrophytes ont été mesurées mensuellement dans quatre stations ayant des caractéristiques physico-chimiques distinctes. Des échantillons prélevés sur différentes espèces de macrophytes à trois profondeurs ont été comparés (article à soumettre à la revue Environmental Pollution).
Dans le deuxième chapitre il a été question de mesurer les processus de méthylation et de déméthylation du Hg dans les épiphytes et les macrophytes afin
9
d'établir ce qui contrôle la production nette de MeHg (objectifs 3 et 4). Des complexes macrophytes/épiphytes ont été incubés in situ pendant 48h dans les herbiers du lac St-Pierre avec ajout d'isotopes stables de 199Hg0 et de Me200Hg comme traceurs. Les mesures ont été effectuées dans 2 stations ayant des caractéristiques physico-chimiques distinctes (article à soumettre à la revue Science of the Total Environment).
Finalement dans le troisième chapitre (objectifs 3 et 5), l'emphase a été mise sur les consortiums de microorganismes hétérotrophes et autotrophes peuplant le biofilm épiphytique afin de déterminer lesquels parmis eux sont actifs dans les processus de méthylation et de déméthylation du Hg. Des complexes macrophytes/épiphytes ont été incubés in situ pendant 48h avec ajout d'isotopes stables de 199Hg0 et de Me200Hg comme traceurs en absence et en présence d'inhibiteurs métaboliques. Le chloramphenicol a été utilisé comme bactériostatique, le molybdate comme inhibiteur de la réduction des sulfates, le BESA (2-bromoethane sulfonic acide) pour inhiber la méthnogénèse et enfin le DCMU (3-(3,4-dichlorophenyl)-1, 1 dimethyl urée) afin d'inhiber la photosynthèse. Des sous-échantillons de biofilm épiphytiques ont été prélevés à la fin des incubation afin de caractériser la communauté des microorganismes actifs lors des mesures de méthylation et déméthylation du Hg à l'aide du séquençage des gènes du 16S rRNA (article publié, (Hamelin, et al., 2011)).
CHAPITRE 1
SPATIO-TEMPORAL VARIATIONS IN BIOMASS AND MERCURY
CONCENTRATIONS OF EPIPHYTIC BIOFILMS AND THEIR HOST IN A LARGE
RIVER WETLAND (LAKE ST. PIERRE, QC, CANADA)
Stéphanie Hamelin, Dolors Planas et Marc Amyot
11
1.1 Abstract
Within wetlands, epiphytes and macrophytes play an important role in storage and transfer of metals, such as Hg, through the food web. However, there is a lack of information about spatial and temporal changes in their mercury levels, a key priority contaminant of aquatic systems. The objectives of our study were to assess total mercury (THg) and methylmercury (MeHg) concentrations of epiphyte/macrophyte complexes in Lake St.Pierre, a large fluvial lake of the St. Lawrence River (Québec, Canada). THg and MeHg concentrations were ten fold higher in epiphytes than in macrophytes. THg concentrations in epiphytes linearly decreased as a function of the autotrophic index and % of MeHg in epiphytes reached values as high as 74%. Spatio-temporal variability in THg and MeHg concentrations in epiphytes and macrophytes were influenced by water temperature, available light, host species, water level, dissolved organic carbon and dissolved oxygen.
12
1.2 Introduction
Many lakes are affected by mercury (Hg) contamination which can alter human health, mainly through exposure by fish consumption. Wetlands are often seen as sinks for nutrients and metals, such as Hg, but sources for methylmercury (St. Louis, et al., 1996). Furthermore, methylmercury (MeHg) concentrations in lakes and rivers have been shown to be correlated to the percentage of wetland within the drainage basin (Mierle and Ingram, 1991). A perturbation of these ecosystems (e.g., dredging or water leve! fluctuations) can have dramatic consequences on the release of these stored materials in the environment (Westling, 1991 ).
Although aquatic plants in wetlands can accumulate Hg, the periphytic biofilm that covers them (epiphytes) has a more rapid tournover rate than its host, and is the main food sources for macroinvertebrate herbivors (Cieckner, et al., 1998; Cremona, et al., 2009; Molina, et al., 2010). Furthermore, it is known that epiphytes can methylate Hg (Cieckner, et al., 1999; Mauro, et al., 2001; Hamelin, et al., 2011) and that MeHg concentrations within biofilm matrix can reach high levels (e.g., 3 to 55 ng gDW-1 for periphyton growing on rocks, (Desrosiers, et al., 2006c)). Hg and MeHg accumulation in aquatic primary producers could be an important pathway of Hg transfer from the watershed to the aquatic foodweb (Rask, et al., 1994; Hill, et al.,
1996; Cremona, et al., 2009).
Few studies have focused on periphytic biofilms as a potential source of Hg to food webs. Most of them were conducted in tropical and subtropical regions (Cieckner, et al., 1998; Guimaraes, et al., 2000; Roulet, et al., 2000; Mauro, et al., 2002; Huguet, et al., 2010), whereas those in temperate regions are sparse (Rask, et al., 1994; Desrosiers, et al., 2006b in boreal lakes). Considering the extensive presence of wetlands in northern hemisphere (Keddy, et al., 2009), it is crucial to investigate the importance of Hg and MeHg concentrations in epiphytes and macrophytes in temperate regions, in order to better predict fish contamination and human exposure.
13
Epiphyte biomass is not only related to nutrients and light availability, but is also closely related to its macrophyte host as the latter will determine the available surface for colonisation (Cattaneo and Kalff, 1980; Engelhardt and Ritchie, 2001), and specifie composition of epiphyte biofilms (Pip and Robinson, 1984). Functional differences in community composition of microorganisms are known to influence Hg methylation and demethylation rates, as weil as Hg and MeHg concentrations in biofilms (Macalady, et al., 2000; Hamelin, et al., 2011 ). Th us, indicators of biofilm composition, such as the proportion of autotrophes vs heteotrophes, known as the autotrophic index (see section 1.3.3), should be linked to epiphytes Hg contamination.
Physico-chemical characteristics of the water (pH, dissolved oxygen concentrations, nutrients, temperature) have been shown to affect Hg bioavailability and methylation in biota (Callister and Winfrey, 1986; Mauro, et al., 1999; Ullrich, et
al., 2001; Le Faucheur, et al., 2011 ). These physico-chemical variables may vary through the growing season of primary producers, as weil as the dominant macrophyte species that will change by following seasonnal succession. Thus, fluctuations in epiphyte and macrophyte Hg and MeHg concentrations are expected from the beginning to the end of the summer. There are currently no published seasonal trends of THg and Me Hg concentrations in epiphytes or macrophytes of the northern hemisphere.
The aim of the present study was to measure THg and MeHg concentrations in epiphytes/macrophytes complexes, evaluating the effect of: (i) host specificity (macrophytes species and habitat), (ii) temperature and light (related to depth and season), (iii) the proportion of autotroph organisms in biofilms (autotrophic index), and (iv) chemical characteristics of sites (stations).
14
The study has been conducted in, a large fluvial lake (Lake St. Pierre), characterized by high spatial variability in water physico-chemical proprieties, as it is formed by three distinct water masses that flow side by side without mixing (Centre Saint-Laurent, 1996).
1.3 Materials and methods
1.3.1 Study site
Lake St. Pierre (46°12'N, 72°49'W) is an enlargement of the St. Lawrence River downstream of Montreal, Québec, Canada (figure 1.1 ). This long (30 km) lake is relatively shallow (mean depth -3 m, excluding the navigation channel) and supports large emergent marshes and extensive beds of submerged aquatic vegetation (Hudon, 1997). From mid- to late summer, submerged aquatic plants cover 260 km2 (85%) of the lake's area (mean biomass 54 g dry mass.m-2) and represent an annual production of 8700 tonnes of carbon (Vis, et al., 2007). This lake is one of the most valuable sites in Canada for freshwater sport and commercial fisheries, with over 1 ,400 tons of fish caught annually (Caron and Lu cotte, 2008). Water residence ti me is 20 to 120 days, and inter-annual water level fluctuations can reach up to 2 m (Hudon and Carignan, 2008). Large spatial variations in physical and chemical water characteristics can be found in Lake St. Pierre, arising from the presence of distinct water masses, which may flow side by side without mixing (Centre Saint-Laurent, 1996). The central water mass (which includes the navigation channel) is composed of relatively clear and hardwaters, with low dissolved organic carbon (DOC) and suspended matter concentrations coming from the Great Lakes (Cossa, et al., 1998; Vis, et al., 2007). These waters represent 80% of discharge, and are restricted to the central portion of the lake (Vis, et al., 2003). The north shore water mass cornes from the Ottawa River and north shore tributaries (L'Assomption, Chicot, Yamachiche, Maskinongé and Du Loup rivers). These humic-brown waters are relatively rich in nutrients and suspended particles and have comparatively high DOC concentrations
15
derived from humic and fulvie acids (Frenette, et al., 2003). Tributaries (Richelieu,
Yamaska, Nicolet and St. François rivers) draining farmlands discharge in the south
shore and bring turbid brown-clay and nutrient rich waters (Vis, et al., 2003). The
upstream section of Lake St. Pierre, around the Sorel archipelago, is heavily
impacted by nearby industries from Sorel-Tracy (metallurgy and chemistry) and
agricultural loadings (nutrients and pesticides (La Violette, et al., 2003)).
Over 60 aquatic plants species have been recorded in Lake St. Pierre during the
3-year study (2002-2004). Dominant macrophytes species in our sampling sites
were Scirpus fluviatilis and Typha angustifolia Linné (emergent); Nymphea tuberosa
Paine (floating leaves); Ceratophyllum demersum Linné, Potamogeton perfoliatus Linné, Vallisneria americana Michaux and Elodea canadensis Michaux (submerged).
Floating macroalgae form a significant part of the biomass in the middle of the
summer, particularly when water levels were low.
1.3.2 Sampling
Four stations were chosen for their contrasting physico-chemical characteristics,
but a Iso for their interest as commercial fishing sites (figure 1.1 ). Two were located
on the north shore, one close to the Girodeau Island (GIR, 46° 09' 82" N; 72° 59' 1 0"
W) and the other in the Maskinongé Bay (MASK, 46° 11' 56" N; 72° 56' 63" W). The
two other stations were situated on the south shore, one in the Anse-du-Fort (ADF,
46° 08' 24" N; 72° 54' 87" W) and the other in a large eutrophie bay, St. François
Bay, (BSF, 46° 06' 97" N; 72° 55' 87" W), which receives agricultural inputs from the
Yamaska and St. François Rivers.
Sampling was carried out once a month for 3 years (in July and August 2002, from June to August 2003 and from May to September 2004), and at 3 different depths from the surface (0 cm, 30 cm and 60 cm). At each depth and station, three field replicates of macrophyte/epiphyte complexes per dominant macrophyte species were sampled by scuba divers using 0.68 L Pac-man boxes, (a smaller cylindrical
16
version of the 6 L Downing box (Downing, 1986), modified by C. Vis (Parks Canada, Cornwall). Great care was taken during sampling by scuba divers to keep the integrity of the biofilm.
ln the laboratory, epiphytes were separated from macrophytes by mechanical shaking (9 min in a Red Devil® paint shaker), a method previously tested in our laboratory for removing periphyton without destroying algal cells (Hamelin et al., unpublished data). 100 ml of epiphyte suspension was subsampled for each measurement: chlorophyll-e (chi, x2), dry weight (DW, x2), ash free dry weight (AFDW, x2), THg (x3) and MeHg (x3). Aliquots for chi, DW and AFDW were filtrated on GF/C filters that were pre-combusted (90 minutes at 500°C) and pre-weighed for DW and AFDW. Filters were kept frozen (-80°C) until analysis.
Physicochemical characteristics of the water within macrophytes beds were measured with specifie probes: pH (Chekmite 4 pH meter), light (Biospherical QSL-1 0QSL-1 quantum meter), temperature and dissolved oxygen (WTW Oxi340 oximeter). Water grab samples were also taken in each macrophyte bed for DOC, THgwater. MeHgwater and major ions. Water chemistry data for these last samples are presented in the Supporting Information (Annexes A and C).
1.3.3 Biomass (chlorophyll-u, dry weight and ash free dry weight)
Chlorophyll-e (chi) was extracted with hot ethanol (Nusch, 1980) and measured by spectrophotometry (Spectronic Unicam UV300) with correction for phaeopigments (Sartory and Grobbelaar, 1984 ). Dry weight (DW) was measured after drying the filters at 45°C to constant weight, and ash free dry weight (AFDW) was measured after combustion at 500° F for 2 hours, (APHA, 1989). Macrophyte biomass was estimated with 10 quadrats of 1 rn x 1 m, randomly sam pied in each station, in which ali the macrophyte species were identified and weighed (wet and dry). The autotrophic index (Al) of the epiphyte community was calculated as the ratio of AFDW by chi (Biggs and Close, 1989).
17
1.3.4 Total mercury and methylmercury analysis
Ali sampling materials for Hg measurements were carefully acid-washed and rinsed with nanopure water. Prior to THg and MeHg analysis, periphyton samples were freeze-dried and weighed. THg concentrations were measured by thermal decomposition using a direct mercury analyzer (DMA 80; Milestone, MLS). 0.05 to 0.10 g of samples were dried, combusted and further decomposed on a catalytic column at 750°C. Hg vapors were collected on a gold amalgamation trap and subsequently desorbed by heat and then measured by atomic absorption spectrometry at 253.7 nm (Boylan and Kingston, 1988; Cizdziel, et al., 2000). MeHg samples were extracted in KOH/methanol (25%) and analyzed by Cold Vapour Atomic Fluorescence (Bioom and Fitzgerald, 1988; Bloom, 1989). The working detection limit was 0.01 ng g-1 of Hg for DMA 80 and 0.1 ng g-1 for CVFAS (three times the standard deviation of 10 procedural blanks). Blanks and certified reference materials (Tort-2, S0-2 and IAEA, CNRC) were analyzed every 10 samples to ensure the reproducibility of the analysis and to assess quality assurance/quality control. Hg concentrations in reference material varied slightly over time (CVFAS:
TORT-2 CV=1.9%; DMA: TORT-2 CV=2.3%, S0-2 CV=1.6% and IAEA CV=2.1%)
but were not significantly (p > 0.05) different from certified values. No substantial Hg contamination was detected in the blanks.
Estimates of THg and MeHg burdens in epiphytes and macrophytes for the
whole lake were been calculated by multiplying minimum and maximum [THg] and
[MeHg] measured throught the growing season by minimum and maximum epiphyte biomass by seasonal maximum macrophyte biomass (ali species) calculated for the
18
1.3.5 Statistical analyses
Results of biomass, THg and MeHg concentrations between stations, depths, and macrophytes species were compared with one-way or two-way ANOVA (previously Log10 transformed to meet normality requirements as verified by Shapiro-Wilk test). When significant differences were found, Tukey-Kramer HSD (honestly significant difference) test for multiple mean comparisons was applied. When testing for seasonality effect, comparisons between different sampling periods were performed with repeated measures analyses of variance. A principal components analysis (PCA) on environmental descriptors was used to identify the variables that are correlated to the variance of [THg] and [MeHg] in epiphytes and macrophytes. Statistical analyses were performed with JMP 7 statistical package (SAS lnstitute lnc. 1991, a set at 5%) and Canoco for Windows 4.54 (ter Braak and Smilauer 1998).
1.4 Results
1.4.1 Biomass
Through the season, epiphyte DW varied from 8.2 to 3188.3 mg g DW macrophyte-1 (data not shown). Similar range of variability was observed with autotroph biomass as estimated by chi, going from 27.3 to 2432.3 IJgchl gDWmacrophyte-1 (figure 1.2 A). Epiphyte biomass differed between macrophyte species (table 1.1 ), and was significantly higher in submerged macrophytes than in emergent ones (one-way ANOVA, p=0.0049, N=36).
Macrophytes biomass also differed between species and sites, ranging from
43.7 to 1458.2 gDW m-2 (figure 1.2 8). Highest values for both epiphytes and macrophytes were reached during the summer months (i.e. between June and August). While macrophytes had higher densities in BSF (south shore), epiphytes
19
biomass per gDW macrophytes was more abundant in Girodeau (north shore; figure 1.2 A and 8).
1.4.2 THg and MeHg concentrations
Within sites, THg and MeHg in epiphytes and macrophytes varied as a function of macrophyte species and seasonality (table 1.2 and figure 1.2 C, D, E, F). Higher THg concentrations were found in epiphytes (from 2 to 284 ng gDW-1) than in
macrophytes (from 1 to 54 ng gDW-1; table 1.1 ). THg in epiphytes were
approximately 10 fold higher than in macrophytes (One-Way ANOVA, p<0.0001,
N=63).
MeHg concentrations were 2 to 17 fold higher in epiphytes (from 0.1 to 24.0 ng gDW-1; table 1.1 and 1.2) than in macrophytes (from 0.2 to 6.3 ng gow-\ One-Way
anova, p<0.0001, N=63). The highest [MeHg] was measured in epiphytes growing on floating filamentous macroalgae (table 1.2).
No significant differences in [THg] or [MeHg] in epiphytes were observed as a function of substrate type (emergent vs submerged macrophytes). Higher [THg] in epiphytes were found in June on the north shore and in May on the south shore.
Greater [MeHg] in epiphytes were found in May for MASK and ADF, and from June
to July in BSF and GIR. The station with the highest [MeHg] was BSF, while the one with the maximum [THg] was GIR (figure 1.2 C, E).
Whole lake THg burden estimates for the maximum seasonal macrophyte biomass represent 25 to 1400 g in macrophytes and can reach higher values in epiphytes, from 1 to 23 000 g. MeHg burdens varied from 0.02 to 1950 gand from 5 to 160 g, for epiphytes and macrophytes respectively. The huge variation between minimum and maximum estimates reflects the differences in [THg] or [MeHg]
20
lnter-annual variations were observed for epiphytes, with biomass 5 fold higher
(one-way ANOVA, p<0.0001, N=54) in 2003 than in 2002 or 2004 (figure 1.3 A). No
corresponding inter-annual change was observed for [THg] (emergent and submerged) or [THg] in water, suggesting that biodilution does not occur in these
biofilms (figure 1.3 8). [MeHg] remained stable for epiphytes on emergent
macrophytes, but they were higher in 2003 than in 2002 or 2004 for epiphytes on
submerged macrophytes (figure 1.3 C).
1.4.3 Factors influencing THg and MeHg in epiphytes and macrophytes
No significant relationship was observed between THg and chi (~=0.02;
p=0.1794, N=39), THg and DW (~=0.04; p=0.0973, N=39) or between THg and
AFDW (~=0.04; p=0.0717, N=39) measured in epiphytes. However, THg in
epiphytes linearly decreased as a function of the autotrophic index (figure 1.4, ~= 0.53; p < 0.0001, N=39). This implies that a higher proportion of autotroph organisms in a biofilm may lead to higher THg, suggesting a role of algae in epiphyte Hg accumulation.
ln the PCA of THg and MeHg in epiphytes (figure 1.5 A and 8), 67% of the total variance was explained by the 3 first principal components. [THg] in epiphytes was positively correlated with Axis 1 and Axis Ill while [MeHg] in epiphytes was negatively correlated to Axis 1 and Axis Il. Axis 1, which explained 27% of the variance, was positively correlated to water level , and to a lesser extent, negatively correlated with temperature and DOC. Axis Il, which explained 22% of the variance, was highly correlated with [02], and to a lesser extend to [S04], and [THg]water· Axis Ill explained 18% of the variance and was correlated with % light, and to a lesser extend, negatively correlated to DOC.
ln the PCA of THg and MeHg in macrophytes, the three principal components explained 69% of the total variance (figure 1.5 C and D). [THg] in macrophytes was negatively correlated with Axis Il and Ill while [MeHg] in macrophytes was negatively
- - - --
-21
correlated with Axis Il. Axis 1 explained 28% of the variance and was positively correlated with water level, and negatively correlated with [02], temperature, and to a lesser extend to [THg]water Axis Il explained 22% and was slightly correlated with
[02] and water level. Axis Ill explained 19% of the variance, was highly correlated
with % light, but negatively correlated with DOC.
1.5 Discussion
1.5.1 Spatial variability
Macrophyte biomass was highest in the south shore whereas epiphytes biomass reached its maximum in the north shore. This contrast can be explained by the physico-chemical proprieties of the water in the two sections of the lake. Stations on the south shore receive important loads of suspended particles carried from tributaries which decrease water transparency (Hudon and Carignan, 2008). Also,
large amounts of nutrients are fou nd in water and sediments of this area, supporting high macrophyte growth, further decreasing light penetration by shading. As a result, epiphyte growth is light-limited on the south shore compared to the north shore.
THg concentrations of epiphytes are the highest in the North-East section of the lake, close to the Girodeau station. This area is under the influence of the plume from Sorel-Tracy industrial area and the discharge of waste water from the Montreal
Urban Community (Langlois and Sloterdijk, 1989; Laviolette, et a/., 2003). These
waters have a more acidic pH, lower DOC concentrations, and as mentioned before,
are characterized by deeper light penetration when compared to south stations. Light
may increase Hg bioavailability by photodegrading organic matter in waters (Sellers,
et al., 1996). Ali these factors are known to increase Hg bioavailability in
microorganisms and should therefore favour Hg absorption by epiphytie biofilms. On
the contrary, total mercury in macrophytes was the highest in BSF station on the
22
exposed to low light intensity, would accumulate more metals from sediments, than fast-growing plants with high light intensity (Hudon, 1998).
ln contrast, MeHg concentrations tend to be higher on the south shore, particularly in BSF. Higher DOC found in BSF may act as a substrate for methylating organisms (Gill and Bruland 1990) and provide binding sites, thus simply increasing the total Hg dissolved in water (Lee and Hultberg 1990). This station is the most productive area of Lake St. Pierre, receiving large inputs of nutrients from agricultural lands drained by the Yamaska and St-François rivers. lt is known that local productivity can increase microbial metabolic activity, and changes community composition (Cieckner, et al., 1999; Macalady, et al., 2000), leading to higher Hg methylation rates and higher accumulation in biofilms when Hg biodilution does not occur.
1.5.2 Hg and MeHg concentrations
THg in epiphytes from Lake St.Pierre were in the same range than levels observed in periphyton from different substrata and climatic regions (table 1.3): glass plates from a boreal Finland lake (Rask, et al., 1994); epilithon from boreal lakes in northern Que bec (Desrosiers, et al., 2006c), in epiphytes from Amazonia, Brazil (Roulet, et al., 2000; Coelho-Souza, et al., 2011 ), epiphytes from macrophyte rhizospheres in Bolivia (Acha, et al., 2005) and free-floating mats of periphyton from
the Everglades, USA (Cieckner, et al., 1998). This suggests th at the global range of [THg] in algal biofilms is similar in northern than in tropical or subtropical regions, and that only spatio-temporal variations within that range can be predicted by physico-chemical variables in a given site. Higher values were reported in highly Hg
contaminated sites such as periphyton from the East Fork Poplar Creek in
Tennessee, that reached Hg(ll) concentrations up to 50 000 ng g DW-1, caused by
23
[THg] measured in macrophytes were in the same range of concentrations than cultivated macrophytes in Sweden (Gëthberg and Greger, 2006), macrophytes close to mines in BC, Canada (Siegel, et al., 1985) and macrophytes from uncontaminated lakes of northern Qc, Canada (Grondin, 1994). They were slightly lower than those sam pied in reservoirs from Brazil (Molisani, et al., 2006) and those measured in the same macrophyte species (Potamogeton sp., Myriophyllum sp. and Elodea sp.), upstream in the St. Lawrence River near Cornwall (Thompson-Roberts, et al., 1999). This section of the river, distant from the study site by 200 km, has historically received important loads of mercury from the surrounding industries that persist in the sediments. Moreover, differences in Hg concentrations could also be explained by methodological differences: macrophytes from Cornwall have been cleaned from epiphytes with deionized water, without brushing or shaking, which may have leave sorne periphyton on the plants that might have slightly increased macrophytes concentrations.
Epiphytes from Lake St. Pierre appear slightly more contaminated in Me Hg ( 1 to 2 fold) than epiphytes from the Tapajos, in Amazon Brasil (Roulet, et al., 2000). They are in the same range than periphyton from the Everglades, Florida (Cieckner, et al., 1998), epiphytes from free floating macrophyte rhisospheres in Bolivia (Acha, et al., 2005) and epiphytes from Tapajos Amazonia, Brazil (Coelho-Souza, et al., 2011) and slightly less contaminated (1 to 2 fold) than periphyton on rocks (epilithon) from Boreal lakes (Desrosiers, et al., 2006c) or periphyton from the contaminated East Fork Poplar Creek in Tennessee (Hill, et al., 1996).
Usually the average proportion of Me Hg over total Hg increases from about 1 0%
in the water column to 15% in phytoplankton, 30% in zooplankton, and 95% in fish
(Watras and Bloom, 1992). ln the studies previously cited for [THg] and [MeHg] in epiphytes, %MeHg over THg vary from 0.1 to 36% (table 1.3). But in Lake St-Pierre,
ratios up to 74% MeHg/THg were measured. These high ratios were found in BSF
during July, when the water temperature and the nutrient inputs were utmost, enhancing bacterial productivity, and thus, mercury methylation. These
![Table 1.1: Mean Biomass (in g DW m-2), [THg] and [MeHg] (both in ng Hg g ow-1) ±standard error in epiphytes and their host at the BSF in August 2002 (nd = non-detectable)](https://thumb-eu.123doks.com/thumbv2/123doknet/3308530.95259/43.902.282.516.206.1028/table-mean-biomass-mehg-standard-epiphytes-august-detectable.webp)
![Table 1.2: Means and ranges of [THg] and [MeHg] in epiphytes and macrophytes](https://thumb-eu.123doks.com/thumbv2/123doknet/3308530.95259/44.902.165.770.273.1043/table-means-ranges-thg-mehg-epiphytes-macrophytes.webp)