PhD thesis
Fish assemblages dynamic in the tropical flood-pulse
system of the Lower Mekong River Basin
Peng Bun NGOR
Jury composition
Anna Vila-Gispert Adjunct Professor Referee
Stefan Schmutz Professor Referee
Thierry OBERDORFF Research director Jury member
Sébastien BROSSE Professor Jury member
Gaël GRENOUILLET Senior lecturer Jury member
Nam SO Researcher Jury member
Christine AGRILLIER Research Director Jury member
Marta MUÑOZ Professor Jury member
Sovan LEK Professor PhD supervisor
This research was performed at:
Laboratoire Evolution & Diversité Biologique, UMR 5174, Université Paul Sabatier – Toulouse III, 118 route de Narbonne, 31062 Toulouse cédex 4 – France.
Cite this document as:
Ngor P. B., 2018. Fish assemblages dynamic in the tropical flood-pulse system of the Lower Mekong River Basin. Thesis submitted in fulfilment of the requirements for the Degree of Doctor of Philosophy, University of Toulouse 3 Paul Sabatier, Toulouse, France.
The author and the supervisor give the authorization to consult and to copy parts of this work for personal use only. Every other use is subject to the copyright laws. Permission to reproduce any material contained in this work should be obtained from the author.
Acknowledgements
First and foremost, my sincerest gratitude goes to Professor Sovan Lek, my supervisor, for his kindest support, valuable guidance and encouragement from the beginning to the completion of my PhD Program. This thesis would be impossible without his continuous assistance and constructive advice. I would like to profoundly thank Associate Professor Sithan Lek-Ang, my supervisor’s wife, for her warm welcome and kindness to offer the homestay during my first arrival, and indeed both of whom offer both academic and personal supports during my entire stay in Toulouse. I am wholeheartedly thankful for their heartfelt support and care-taking.
I am also very grateful to His Excellency Eng Cheasan, Director General of the Fisheries Administration for his support to undertake my PhD Program. Sincere thanks are also given to Mr. Chheng Phen, acting director of the Inland Fisheries and Development Institute, Dr. So Nam, Chief of Environment Division of the Mekong River Commission for his cooperation and support in supplying the data for this study.
I am grateful to Dr. Thierry Oberdorff, Research Director at the French Research Institute for Development; Professor Gaël Grenouillet, Professor Sébastien Brosse and Dr. Loïc Tudesque at the Laboratoire Evolution et Diversité Biologique, Université de Toulouse; Professor Pierre Legendre, Département de Sciences Biologiques, Université de Montréal; Professor Kevin McCann, University of Guelph and Professor Bailey McMeans, University of Toronto Mississauga for their technical advice, comments and supports during data analyses and manuscript preparations. Last, but not least, my sincerest thanks go to Mr. Peter Degen who is always available for helping edit my writing and Mr. Kunthea Nuon for his technical support in GIS mapping.
I am indented to my PhD colleagues, Seng Ratha, Sor Ratha, Chea Ratha, Chan Bunyeth and Heng Kong for their academic, social and personal sharing, support and assistance especially during my stay in Toulouse. My sincere thanks are also given to Ms. Catherine Stasiulis, Ms. Romy Duchesne, Ms. Aurore Berthier and Ms. Dominique Pantalacci for their administrative support.
My deepest thanks go to my beloved parents and wife as well as my brothers and sisters for their unconditional company, endless love and support.
Finally, my special thanks are given to the Erasmus Plus Program, Belmont Forum (TLSCC project), CONCEA Program and Laboratoire Evolution & Diversité Biologique (EDB), Université de Toulouse for funding this study and support, Mekong River Commission (Fisheries Programme), the Inland Fisheries Research and Development Institute of the Fisheries Administration in Cambodia for giving the required datasets for the study.
PART I: SYNTHESIS Table of Contents
I. Introduction ... 1
1.1 A brief about the Mekong system ... 1
1.1.1 The Mekong River ... 1
1.1.2 The 3S Rivers ... 2
1.1.3 The Tonle Sap system ... 3
1.2 The Mekong fisheries ... 4
1.2.1 Fish community structure ... 4
1.2.2 Fish migration system ... 6
1.2.3 Socio-economic importance of fisheries in the Lower Mekong Basin ... 7
1.3 Challenges of inland capture fisheries in the Lower Mekong Basin ... 9
1.3.1 Water infrastructure development in the Mekong ... 9
1.3.2 Habitat loss ... 13
1.3.3 Open-access fisheries ... 14
II. Objectives ... 14
III. Materials and methods ... 15
3.1 Study area ... 15
3.2 Data collection ... 16
3.3 Statistical analysis ... 18
3.3.1 Seasonal partitioning ... 18
3.3.2 Data preparation ... 18
3.3.3 Flow seasonality and predictability ... 19
3.3.4 Spatial and temporal description of fish community ... 19
3.3.5 Species diversity ... 20
3.3.6 Linear regression models ... 20
IV. Results ... 21
4.1 Summary of recorded catches in the Lower Mekong Basin ... 21
4.2 Overall fish assemblage structure and diversity ... 23
4.2.1 The Lower Mekong River ... 23
4.2.3 The Tonle Sap system ... 25
4.3 Spatial variation in fish abundance distribution ... 27
4.3.1 The Lower Mekong River ... 27
4.3.2 The Mekong-3S system ... 28
4.3.3 The Tonle Sap system ... 28
4.4 Temporal dynamics of fish community ... 31
4.4.1 Temporal variation of fish community in the Tonle Sap River and Lake ... 31
4.4.2 Temporal dynamics of fish communities in the Lower Mekong system ... 40
V. Discussion ... 50
5.1 Fish species richness and diversity ... 50
5.2 Spatial variation in fish community structure ... 52
5.3 Temporal variation in fish community structure ... 55
5.3.1 Flow variation in the Lower Mekong system ... 55
5.3.2 Intra-annual variation in fish community structure ... 55
5.3.3 Inter-annual variation in fish community structure ... 57
VI. Conclusion and implications for fisheries management and conservation ... 59
6.1 Conclusion ... 59
6.2 Implications for fisheries management and conservation ... 60
VII. Further research ... 62
References ... 64
Annexes ... 75
Annex 1. List of indicator species in each cluster in the Lower Mekong River ... 75
PART II: PUBLICATIONS
Article 1. Large-scale patterns of fish diversity and assemblage structure in the longest-tropical river in Asia.
Ratha Chea, Sovan Lek, Peng Bun Ngor, Gaël Grenouillet 2016
Ecology of Freshwater Fish, 2016, 1–11
Article 2. Spatial and temporal variation in fish community structure and diversity in the largest tropical flood-pulse system of Southeast Asia.
Peng Bun Ngor, Gaël Grenouillet, Nam So, Sea Phem, Sovan Lek
Ecology of Freshwater Fish (accepted, in press)
Article 3. Evidence of indiscriminate fishing effects in one of the world's largest inland fisheries. Peng Bun Ngor, Kevin McCann, Gaël Grenouillet, Nam So, Bailey McMeans,
Evan Fraser, Sovan Lek
Scientific Reports 2018 (in revision)
Article 4. Flow alterations by dams shaped fish assemblage dynamics in the complex Mekong-3S river system.
Peng Bun Ngor, Pierre Legendre, Thierry Oberdorff, Sovan Lek
Ecological Indicators, 88 (2018), 103-114.
Article 5. Fish assemblage responses to flow seasonality and predictability in a tropical flood pulse system.
Peng Bun Ngor, Thierry Oberdorff, Phen Chheng, Christophe Baehr, Gaël Grenouillet, Sovan Lek
I. Introduction
Inland waters cover lakes, reservoirs, rivers, wetlands and coastal transitional waters (Welcome 2001, Welcomme et al. 2010), extending over an area of about 7.8 million km2 (de Graaf et al. 2015).
Inland waters cover only about 0.01% of the world’s water and about 0.8% of the earth surface (Revenga and Kura 2003, Dudgeon et al. 2006), yet support humankind countless environmental goods and services, of which fish are among the most important resources, supplying food, nutrition, income, livelihoods and recreation to tens of millions of people on earth (Béné et al. 2015, de Graaf et al. 2015, Lynch et al. 2016). Some 13,000 inland fishes from 170 families strictly live in freshwaters (Lévêque et al. 2008), making up around 41% of all fish species and 20% of all vertebrate species (Helfman et al. 2009). Inland capture fisheries employ about 61 million people 50% of whom are women (Bartley et al. 2015). Globally, catches in inland waters yielded 11.9 million tonnes in 2014 (11.3% of the world total capture fish production) (FAO 2016), with an average annual growth between 2 and 3% since 1950 (Allan et al. 2005, Bartley et al. 2015). Albeit positive trends, fisheries data reported by FAO member states are of major concern in terms of its reliability (Watson and Pauly 2001, Bartley et al. 2015). World fisheries catches are shown declining when corrective measures are considered in its fish catch estimation (Watson and Pauly 2001, Pauly et al. 2002). Evidence suggests that inland wild fish are declining or overharvested particularly in the tropical Asia (Allan et al. 2005, Welcomme et al. 2010), the region exceptionally rich in flora and fauna, yet attract comparatively little ecological research and lesser conservation effort on biodiversity (Dudgeon 2000, Allen et al. 2012). A typical example of this is the Mekong River Basin and its fisheries, one among the world’s most biodiverse rivers and has been designated to be part of the world’s 35 biodiversity hotspots (Baird 2006, Mittermeier et al. 2011, Vaidyanathan 2011). Arguably, Tonle Sap, among the world’s largest tropical floodplains, has been studied the least with regards to its hydrology-ecology interactions (Junk et al. 2006, Kummu et al. 2006, Arias et al. 2013, Sabo et al. 2017, Ngor et al. 2018a).
1.1 A brief about the Mekong system 1.1.1 The Mekong River
The Mekong River originating in Tibetan plateau and running for some 4,350 km through China, Myanmar, Lao PDR, Thailand and Viet Nam is the largest in Southeast Asia, the 12th longest on
the planet, the 8th world’s largest in terms of flows having a mean annual discharge of approximately
475 km3 and the world’s 21st largest in terms of area draining around 795,000 km2 (van Zalinge et al.
2004, Gupta and Liew 2007). The Upper Mekong which is called Lancang Jiang contributes around 16% to the total annual mean flow while the Lower Mekong Basin (LMB) which begins at the Golden Triangle marking the borders of Thailand, Lao PDR, China and Burma, and consists of Cambodia, Lao PDR, Thailand and Viet Nam shares the remainder of the total flow (~84%). The Mekong’s major tributaries systems develop in the LMB. Among these, the Sekong, Sesan, Srepok Rivers together
known as the 3S system, contributing ~20% of flow and the Tonle Sap River and Lake (~9% of flow) are among the largest tributaries and constitute significant parts of the LMB (MRC 2005, 2010).
The Lower Mekong River (LMR) forms the Lao-Thai border for a river reach of approximately 900 km (van Zalinge et al. 2004). There is an inland delta at the geological fault line which forms the 21-meter high Khone Falls on the Lao-Cambodian border. At Kratie ~545 km from the sea, the river becomes a lowland river. At Phnom Penh, ~330 km from the sea, the Mekong River is joined by the Tonle Sap River, where it splits into the Mekong proper and the Bassac forming a large estuarine delta before discharging into the South China Sea.
The Mekong annual flood pulse takes place between June and October. It is influenced by the tropical monsoonal climate and flood runoff which converges and accumulates into a single seasonal flow. This results in a distinct seasonality in the annual hydrological cycle: flood (wet) season and low-flow (dry) season. During the flood season, the discharge is 30 times greater than in the dry season at Pakse and up to 53 times at Kratie (van Zalinge et al. 2004). The hydrological cycle (Fig. 1) is a main ecological driver structuring up- and downstream aquatic communities in the Mekong including fishes that seasonally migrate for spawning, feeding/rearing and refuge (Valbo-Jorgensen and Poulsen 2000, Poulsen et al. 2002, Baran 2006).
Fig. 1. Observed hydrological cycle patterns, based on daily water levels over nine-year period (2007-2015) on the Mekong mainstream in Stung Treng Province. Thick red line curve represents the nine-year mean daily water levels.
1.1.2 The 3S Rivers
The 3S Rivers drain northeastern Cambodia, southern Lao PDR, and Viet Nam’s Central Highlands. Their sources originate in the Central Highlands of Viet Nam, from where the Sekong (SK)
River begins its flow toward southern Lao PDR and then northeastern Cambodia where it merges with the Sesan (SS) and Srepok (SP) Rivers. The Sesan and Srepok flow directly from Viet Nam to Cambodia, and the three rivers meet over an approximate distance of 40 km before forming the confluence with the Mekong mainstream at the provincial town of Stung Treng in Cambodia (MacQuarrie et al. 2013).
The 3S Basin covers a surface area of about 78,650 km2 of which 33%, 29% and 38% is shared
by Cambodia, Lao PDR and Viet Nam, respectively (Piman et al. 2013, Constable 2015). The basin’s annual discharge contributes about 20% to the total annual flow of the Mekong mainstream (91,000 × 106 m3 or an average of 2,886 m3/s), making the 3S the largest tributary of the Mekong Basin (MRC
2005, Adamson et al. 2009), and the main hydrological contribution to the Mekong mainstream between Pakse, Lao PDR and Kratie, Cambodia. The 3S flow contribution indeed exceeds that from the upper Mekong in China (16%) (MRC 2005, Adamson et al. 2009) and plays a significant part in the seasonal reverse flow of the Tonle Sap River (MRC 2005). Therefore, flow regulations resulting from hydropower development in the 3S system could have significantly adverse effects, not only on flow regimes, ecosystems and overall biological integrity of the 3S system itself, but also on the Mekong-3S system, the downstream Tonle Sap system and the Mekong delta (Ziv et al. 2012, Arias et al. 2014b). 1.1.3 The Tonle Sap system
The Mekong River, roughly 4,300 km from its source (Halls et al., 2013a), meets with the Tonle Sap River on the right bank at the Chaktomuk junction in the capital city of Phnom Penh. The Tonle Sap Lake which is situated in the heart of Cambodia contains the largest continuous areas of natural wetland habitats remaining in the Mekong system (van Zalinge et al. 2004), and the largest wetlands in Southeast Asia. The lake was formed some 5 - 6000 years ago (Carbonnel 1963), is located at the apex of the Tonle Sap River around 130 km to the northwest of Chaktomuk junction. The Tonle Sap River and Tonle Sap Lake form the Tonle Sap River and Lake System (TSRL) which is of high biological productivity and considered as one of the world’s largest tropical inland fisheries (Baran 2005, Baran et al. 2013b). It has become a world Biosphere Reserve approved by the United Nations Educational, Scientific and Cultural Organization (UNESCO) since 1997, given the wetlands of global significance for its biodiversity conservation value (Davidson 2006). The TSRL catchment covers an area of 85,790 km2 or 11% of the Mekong Basin (MRC, 2003). The waters for the system originates mainly from the
Mekong River (54%) while the lake tributaries contribute 34% and the rest is from precipitation (M. Kummu et al., 2014). During the wet season (June-October), Tonle Sap River flows from the Mekong River to the Tonle Sap Lake (inflow) when the Mekong waters rise faster than the lake, expanding its mean surface area from ~3,500 to ~14,500 km2, inundating huge floodplain areas surrounding the
TSRL, with maximum depths in the lake recorded at 6 to 9 meters in late September to early October and minimum depths of around 0.5 meter in late April (MRC, 2005).
The TSRL’s fisheries productivity reaches its peak during this flooding period as both migratory fishes from the Mekong and resident fishes in the lake invade the floodplains for feeding/rearing and reproduction. Eggs, larvae and fry of fish that spawn upstream in the Mekong mainstream are also carried by the flow and dispersed into the TSRL’s sourrounding floodplains through numerous channels, streams and man-made cannals for feeding/rearing, nurseries and growth. When the Mekong flood recedes (September/October) and the Tonle Sap River reverses its flow direction (outflow), large numbers of fish migrate back to the Tonle Sap Lake, then the Tonle Sap River and Mekong River for dry-season refuge. It is during this period of receeding water (October – March) when fishing activities are intensifying in the Tonle Sap Lake and River Systm as well as in the Mekong River. The fishery in Tonle Sap River is highly predictable, and usually peaks in December and January in a time window of 6/7-1 days before full moon during which the river is described as ‘packed solid with fish’ (Lieng et al. 1995 p. 257, Halls et al. 2013c). Such events can still be observed nowadays at the stationary trawl bagnet (Dai) fishery which has been operating in the Tonle Sap River for more than a century (Halls et al. 2013c).
1.2 The Mekong fisheries
Fish communities in the Mekong River Basin are extremely diverse and characterized by the presence of large distance migratory species (Rainboth 1996, Baran et al. 2001, Poulsen et al. 2002). Natural annual flood pulses inundate huge floodplain areas and drive enormous fish production upon which millions of people depend for their livelihoods (van Zalinge et al. 2004, Hortle 2007, So et al. 2015). The geographical space, habitat heterogeneity, river gradients and physicochemical as well as climatic factors, additionally, define broad-scale patterns of the spatial fish diversity and community composition of the river basin with species richness and level of endemism decreasing towards higher altitude (Kang et al. 2009, Chea et al. 2016).
1.2.1 Fish community structure
The Mekong Basin harbors an estimated 1,200 fish species (Rainboth 1996), with 877 species recorded, 18% of which is endemic to the system (Ziv et al. 2012, Baran et al. 2013b) while the Mekong Fish Database reports up to 911 species (MFD 2003). The LMB countries together possess one of the world’s highest fish diversity per square kilometer; only French Guiana and Suriname in South America share similar or higher fish species diversity per unit area of land (Baran et al. 2013b). The largest
fishery of the basin takes place in the extensive floodplain of the Tonle Sap (van Zalinge et al. 2004); the complex river-lake system which hosts an estimated 296 fish species, making it the third most fish species-rich lake after Lake Malawi (438 fish species) and Lake Tanganyika (316 fish species) (Baran et al. 2013b). Capture fisheries production in the LMB was estimated at approximately 2.3 million tonnes annually (MRC 2010, Hortle and Bamrungrach 2015), equivalent to around 2% of the world total fisheries production or approximately 19.3% of the world freshwater capture production which is 11.9 million tonnes (FAO 2016). Of the LMB’s estimated fish biomass, white, black and grey fishes (see definitions in the next section) share ~34%, 50% and 16%, respectively; whereas of the total number of species, white, black and grey fishes represent 37%, 13% and 50%, respectively (Baran et al. 2013b).
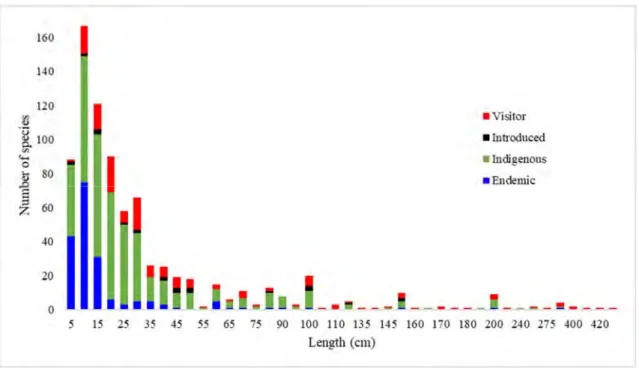
Mekong fishes have different sizes ranging from very small-sized gobies and minnows, which sexually mature at a length of less than 15 mm, to some of the largest inland fishes on the planet such as the Mekong giant catfish (Pangasianodon
gigas, max. length ~3 m, max. published weight: 350 kg), the
enormous stingray (Himantura chaophrya, max. length ~2.4 m ; max. published weight: 600 kg), and the Mekong giant carb (Catlocarpio siamensis, max. length 3 m, max. published weight 300 kg). Mekong fish size composition is given in Fig. 2.
Fishes in this basin are categorized into at least three broad ecological guilds in accordance with their ecological characteristics and migration patterns: white, black and grey fish (Poulsen and Albo-Jørgensen 2000, Welcome 2001, Poulsen et
al. 2002). White fishes perform long-distance migrations between the Mekong mainstream and floodplains as well as major tributaries; the black fishes are floodplain residents, spending their life in lakes and swamps on floodplains adjacent to rivers and moving to flooded areas during the flood season; and grey fishes, ecologically intermediate between the white and black fishes, undertaking short-distance migrations in local tributaries and not spending their life in floodplain ponds during the dry season (van Zalinge et al. 2000, Welcome 2001, Valbo-Jørgensen et al. 2009, MRC 2010). Apart from these three main groups of fish, some freshwater fishes remain within the main river channels and many fishes are confined to tributaries and hill streams (Rainboth 1996). In the lower reaches of the river
Order speciesNo. of Cypriniformes 382 Perciformes 206 Siluriformes 125 Clupeiformes 32 Beloniformes 27 Tetraodontiformes 20 Pleuronectiformes 18 Anguilliformes 14 Gasterosteiformes 13 Synbranchiformes 13 Rajiformes 12 Carcharhiniformes 8 Aulopiformes 7 Atheriniformes 7 Scorpaeniformes 7 Osteoglossiformes 5 Orectolobiformes 3 Cyprinodontiformes 2 Elopiformes 2 Batrachoidiformes 2 Lophiiformes 2 Characiformes 1 Gonorhychiformes 1 Osmeriformes 1 Gadiformes 1 Total 911 Source: MFD, 2003.
system in the Mekong delta, many euryhaline (salt-tolerant) coastal and estuarine fishes as well as some marine visitors are also present in reported catches (MRC 2010). In the Tonle Sap Basin, white fishes belong mostly to Cyprinidae and Pangasiidae while black fishes contain species from Channidae, Clariidae, Bagridae, Anabantidae and Osphronemidae and grey fishes refer to some species from Siluridae and Notopteridae (van Zalinge et al. 1998, Lim et al. 1999, Lamberts 2001, Welcome 2001, Campbell et al. 2006, Halls et al. 2013b, 2013c).
Fig. 2. Fish size composition of the Mekong Basin (data source: MFD 2003) 1.2.2 Fish migration system
Mekong fishes migrate longitudinally and laterally among critical habitats of the Mekong mainstream and its tributaries or between the floodplains and deeper areas of lakes or permanent water bodies. Migration usually takes place for all life stages of fish and is associated with dry-season refuging, flood-season feeding and rearing, and migrations for spawning as well as escaping from adverse environmental conditions (Welcome 2001, Poulsen et al. 2002). Generally, three different fish migration systems have been identified in the LMB (Valbo-Jorgensen and Poulsen 2000, Poulsen et al. 2002, 2004). The first migration system takes place in the lower part of the Mekong system between deep pools of the Mekong mainstream in Kratie-Stung Treng reach (dry-season refuge habitats) and the floodplain of Tonle Sap Lake, area South of Phnom Penh and the Mekong delta of Viet Nam together known as flood-season feeding and rearing habitats. The second occurs in the middle part of the LMB (between Khone Falls and Loei Province) and is characterized by the migration between the rapids and deep pools of the Mekong mainstream and the floodplain habitats which are connected with the Mekong’s major tributaries. The third migration system occurs in the areas of upper part of the LMB in
Jan Feb Mar Apr May Jun Jul Aug Sep Oct Nov Dec Concentration of fish in permanent water bodies. Longitudinal migrations to spawning grounds. Spawning. Lateral movements of
juvenile and adult fish from seasonal to permanent waterbodies. Flood season Dry season Transition period Drift of larvae to feeding areas on the floodplain. Lateral movement
of adult fish into floodplain areas for feeding and growth.
Longitudinal movement to dry season refuges, and dispersal.
the downstream stretch of Loei River in Thailand to Luang Prabang in Lao PDR. This last migration reach is represented by rapids with deep pools and restricted floodplain habitats.
In the three migration systems, hydrology plays a central role in structuring up- and downstream fish community dynamics such as triggering fish to migrate among critical habitats during their life cycles (Poulsen et al. 2002, Baran 2006). General seasonal migration patterns of the Mekong fishes particularly those with white and grey ecological charateristics are reflected in seasonal hydrological patterns. For instance, fishes migrate for spawning in early wet season in May and June when the Mekong’s water levels start rising. Afterwards, between July and November, both adult fish and larvae move to floodplains for feeding and growth. When water levels are falling particularly in December and January, these fishes migrate to permanent water bodies such as deep pools in the Mekong mainstream or lakes, and then remain sedentary in the permanent water bodies during the dry season (February – April). Fig. 3 gives a generalized life cycle of a Mekong fish species. Changes in hydrological patterns caused by anthropogenic activities such as infrastructure development are highly likely to distrupt the river biological system i.e. fish migration and reproduction success, which in effect alters fish community structure and reduce the overall fisheries productity in the Mekong system.
Fig. 3. A generalized life cycle of a Mekong fish species (Sverdrup-Jensen 2002) 1.2.3 Socio-economic importance of fisheries in the Lower Mekong Basin
In 2015, the total population of the LMB was estimated at 68.9 million (So et al. 2015). Some 80% of the LMB’s dwellers is rural, and the economy highly depends on farming, fishing and aquaculture (Hortle 2009). About 66% of the LMB population was engaged in capture fisheries either part-time or seasonally (MRC 2010). At country level, ~80% of rural households in Cambodia, Lao
PDR and Thailand and 60-95% of households in Viet Nam delta were involved in capture fisheries (Hortle 2007). In large water bodies such as the Tonle Sap, commercial fishing appears to represent more than 40% of household (Ahmed et al. 1998).
Inland fish and other aquatic animals make up of more than half the animal protein consumed by people in the LMB which is more than three times the world average of 16% (Baran et al. 2013b), and which range from ~50% in Lao PDR and Thailand to ~60% in Viet Nam and ~80% in Cambodia (Hortle 2007). The average consumption of aquatic animals in the basin is 46 kg per capita per year, similar to the Southeast Asian rate of 51 kg/person/year but significantly higher than the world average of 24 kg/person/year (Baran et al. 2013b). Other inland aquatic animals such as frogs, insects, clams, shrimps, snails and snakes contribute ~6% to the total animal protein consumption (Hortle 2007).
A recent estimate indicates that, based on the first sale landing prices, the LMB capture fisheries is worth about US$11 billion annually in 2015 (So et al. 2015). The largest single fishery in the basin is the century-old dai or stationary trawl bagnet fishery on the Tonle Sap River. The fishery operates between October through March and targets mainly white and grey fishes that migrate out of the floodplains surrounding the Tonle Sap Lake to the main river channels for dry season refuge. Based on first-sale prices, the value of the fishery, on average, is estimated at around US$10 million seasonally (Ngor et al. 2015b). First sale fish prices recorded at the dai fishery indicate that there have been increasing fish prices observed particularly since the fishing season of 2006-2007 at the time when there was also global food crisis. Fish prices of small mud carps (Henicorhynchus spp.), recorded over 20-year period at the dai fishery are shown in Fig. 4. These are ecological keystone species which are the most abundant with their critical role in food security throughout the LMB and important prey species for many predatory fishes and Irrawaddy dolphins (Roberts and Baird 1995, Hurwood et al. 2008, Baird 2011, Fukushima et al. 2014, Ngor et al. 2015a).
Fig. 4. First sale landing prices for small mud carps (Henicorhynchus spp.) 1995-2014 (Ngor et al. 2015b). Note: the average exchange rate is about Riel 4,000 to US$1.00.
1.3 Challenges of inland capture fisheries in the Lower Mekong Basin
Many freshwater faunal species particularly fishes have experienced severe declines in their ranges and abundances, and they are now far more endangered than their marine or terrestrial counterparts (Jenkins 2003, Strayer and Dudgeon 2010). In the Mekong Basin, several dangers are identified as threats to the sustainability of the Mekong fish and fisheries. These threats stem from sources both outside and inside the fishery sector including population growth, hydropower dams, water extraction and diversion for agriculture, widespread habitat fragmentation and loss, water quality degradation, mining, farming expansion and intensification, land-use change, urbanization, climate change, pollution, overharvesting and introduced species etc. Among these threats, water resources infrastructure development, habitat loss and open-access nature of fisheries (overharvesting) in the region are among the great dangers threatening the region’s fishes and fisheries (van Zalinge et al. 2000, Welcome 2001, Halls and Kshatriya 2009, Valbo-Jørgensen et al. 2009, Welcomme et al. 2016, 2010, Ferguson et al. 2011, Ziv et al. 2012, Grumbine et al. 2012, Cochrane et al. 2014, Kummu et al. 2014, Winemiller et al. 2016, Sabo et al. 2017).
1.3.1 Water infrastructure development in the Mekong
During the last three decades or so, infrastructure development significantly poses by far the most significant threat to the Mekong River ecosystem, biodiversity and its fisheries (Arias et al. 2012, 2014b, Ziv et al. 2012, Piman et al. 2013, Cochrane et al. 2014, Winemiller et al. 2016, Sabo et al. 2017, Ngor et al. 2018b). For example, at least six large dams have been built in the upper Mekong River since mid-1990s (Fan et al. 2015, Winemiller et al. 2016) and in the LMB, two mainstream dams are under construction in Lao PDR and 10 others are planned. Among 144 tributaries dams, 42 are in operation, 27 under construction, 17 licensed and 58 planned by 2030 (Nielsen et al. 2015, Schmutz and Mielach 2015, Ngor et al. 2018b). These dams are known to disrupt river continuity, block migration routes of riverine fishes, dampen natural flood pulses, mute flow seasonality, fragment habitats, degrade water quality, and alter sediment and nutrient dynamics as well as other biogeochemical processes, which, in effect, alters the structure of aquatic faunal communities that adapt to natural seasonal flow dynamics as part of their life cycles (Collier et al. 1996, Agostinho et al. 2004, Graf 2006, Poff et al. 2007, Latrubesse et al. 2017, Sabo et al. 2017, Ngor et al. 2018b). Specifically, dams generate hydropower-related pulsed flows e.g. hydropeaking reacting to energy demands (from hourly to seasonally) which adversely affect riverine fishes and other aquatic organisms through, among other factors, stranding/extirpation, downstream displacement and spawning/rearing disruption (Young et al. 2011, Schmutz et al. 2015, Kennedy et al. 2016, Tonolla et al. 2017). In total, these pressures may lead to fish community compositional changes, fish recruitment failure and a continued diminishment of fisheries productivity in the system (Poulsen et al. 2002, ICEM 2010, Baird 2011, Grumbine et al.
2012, Ziv et al. 2012, Winemiller et al. 2016, Ngor et al. 2018b). Fig. 5 provides an overview of hydropower projects in the Mekong Basin.
For example, under the current functioning dams, the 3S’s dry seasonal flow shows an increase of 28% and the wet seasonal flows a decrease of 4%, when measured at the 3S outlet (Piman et al. 2013). Similarly, hydropower dams upstream of the Mekong have caused the most distinct changes to the Mekong’s flow, and their cascade impacts have been demonstrated from Chiang Sen in Thailand (the beginning of the LMB) as far as downstream in the Tonle Sap River in Cambodia which reduces flood pulses by 23% and 11% in rising and falling rates with observed changes taking place since 1991 (Arias et al. 2014a, Cochrane et al. 2014). These changes in natural flow dynamics and flood pulses have severe implications for fish community structure because, of an estimated 1200 fish species with 877 species recorded in the Mekong Basin (Rainboth 1996, Baran 2006, Baran et al. 2013b), about 87% are longitudinal and lateral migratory species (white and grey fishes) (MRC 2010, Baran et al. 2013b). Also, at least 89 migratory species including 14 endangered and critically endangered species characterize fish community from the 3S system (Baran et al. 2013a). In addition, of the 161 Mekong endemics, 17 species exist exclusively in the 3S Basin, and nowhere else on the planet (Baran et al. 2013a). More serious impacts are also expected for the fishes in the Tonle Sap Basin, hosting some 296 fish species (Baran 2005, Baran et al. 2013b). These fishes depend on natural seasonal-predictable flows and flood pulses as the main ecological trigger to disperse, reproduce and seek refuge (Valbo-Jorgensen and Poulsen 2000, Poulsen et al. 2002, 2004, Sverdrup-Jensen 2002, Baran 2006). Fig. 6 shows temporal change in daily water levels in the Mekong mainstream in Stung Treng Province over 95-year periods. Observably, there has been a general significant decrease in wet season flow (June-November), and an increase of dry season flow (December-May). Hydropower dams upstream in China have been attributed to cause the most ‘distinct change’ in the Mekong flow regimes as compared to other anthropogenic activities such as climate change (Cochrane et al. 2014, Winemiller et al. 2016, Sabo et al. 2017).
Fig. 5. Map showing hydropower dams in the Mekong Basin at different stages: existing, under-construction and planned. Data source: MRC hydropower project database 2015.
Fig. 6. Temporal raster plot of daily water levels (m) of the Mekong River, Stung Streng Province, 1920-2015.
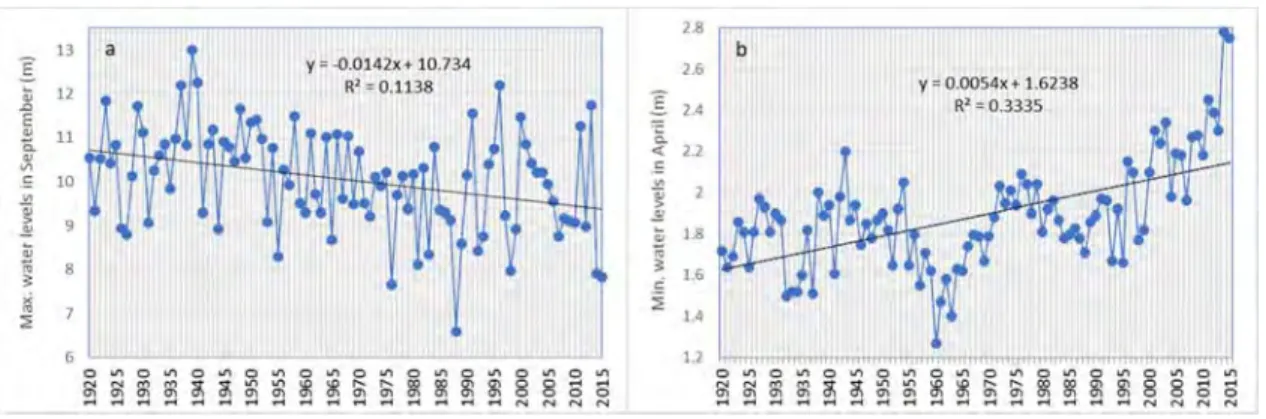
Fig. 7 below, additionally, displays the maximum and minimum water levels in September and April respectively over 95-year periods in the Mekong mainstream in Stung Treng Province. A pronounced decrease in the maximum flow in September (wet season) and increase in minimum flow in April (dry season) are observed.
Fig. 7. (a) Maximum daily water levels in September and (b) minimum daily water levels in April between 1920 and 2015 with pronounced increase in the wet season and decrease in the dry season flows.
1.3.2 Habitat loss
Wetlands and river habitat degradation and losses in freshwater ecosystems are widespread worldwide. These habitats are critical for fish spawning, rearing, feeding, or for dry reason refuge. In the Mekong system, dry season refuge are usually situated in perminant water bodies or in the Mekong mainstream (with deep pools) such as in Kratie and Stung Treng Provinces in Cambodia and Champasack Province in southern Lao PDR. The critical habitats are also found either in the main river channel of the major tributaries or floodplains such as the 3S system, the Tonle Sap system and areas south of Phnom Penh and the Mekong delta. Natural flow dynamics ensure the lateral and longitudinal connectivity among these habitats. Many Mekong riverine fishes are known to migrate longitudinally up- and downstream and laterally between tributary rivers and floodplain areas to access the crtical habitats to complete their lifecycles. Therefore, dams physically block migrating fishes from accessing the critical habitats to complete their life cycle. Also, critical habitats such as deep pools that serve as dry season refuge in the main river channel are filled up with particles, sediments released by erosions triggered by hydropower related pulsed flows. As a result, fish is disabled to access these critical habitats which reduces feeding, rearing, spawinng and recruitment success, and thereby, diminishing the system’s overall productivity.
Habitat loss is also linked to cumulative effects of flow regulation which is caused by water infrastructure development. Various models indicate that effects of hydropower dams distinctly reduce wet season water levels and increase dry season water levels (Piman et al. 2013, Arias et al. 2014a).The reduction in water levels in the flood season means that seasonally flooded habiats (spawning, rearing and feeding habitats) are less available for fish. In the Tonle Sap, seasonally flooded habitats and gallery forest are estimated to have been reduced by 13 to 22% and 75 to 83%, respectively, whereas the increase in water levels in dry season (i.e. 18 to 21% in the open area of Tonle Sap) is causing permanent submersion of existing vegetation and forests (Arias et al. 2012) triggering a permanent dieback situation of the plants in the submerged area. Thus, these type of changes in the Mekong’s natural flow patterns ultimately lead to habitat fragmentation and destruction.
Moreover, other habitat losses are caused by the expansion of agriculture land, gathering of fuelwood, as well as enlargement of settlements in the LMB floodplains as a result of increasing population and government policies. Agriculture policies often focus more on the expansion and intensification of rice farming and industrial crop cultivation. The conversion of flooded forests into farmland and settlements have been accerlated during the last two decades (van Zalinge and Nao 1999, Hortle et al. 2004). These flooded forests are imortant for fishes as shelter, sources of food supply and breeding areas.
1.3.3 Open-access fisheries
Both increased fishing effort, efficiency of fishing gears and increased human population size have likely contributed to high fishing pressure and, thus, overexploitation of the fisheries resources. For example, the use of monofilament nylon gillnets in the LMB has accelerated the decline of some common and commercial species such as Cirrhinus microlepis, Boesemania microlepis, Probarbus spp. and Tenualosa thibaudeaui, Pangasianodon hypophthalmus, Wallago leeri (maxTL: 150cm) and Irrawaddy dolphins (van Zalinge and Nao 1999, Deap et al. 2003, Baird 2006). These highly efficient nets were considered as a ‘wall-of-death’ for many migrating fishes (Hortle et al. 2004 p. 33). The problems caused by these fishing techniques have likely been exacerbated by population growth in the countries sharing the LMB; statistics show that the population has increased about three folds between 1960 and 2015 with about 80-85% rural dwellers (World Bank Group 2015). Factors like free entry into fishing (open-access), affordability of fishing gears (Deap et al. 2003, Hortle et al. 2004), and the combination of rising population along with the lack of complementary and alternative livelihood options, has resulted in millions of people moving into the fishing sector. In addition, prevailing illegal fishing practices such as the use of dynamite, mosquito netting with fences and other destructive fishing methods have put high pressure on fish stocks in the region. Combined with many other streesors (i.e. hydrological alterations, pollution, invasive species and climate change), Mekong fishes and fisheries are facing severe challenges in sustaining its productivity that has for centuries supported millions of peoples’ livelihoods in the region.
II. Objectives
As briefly described, rapid water infrastructure development in the Mekong region (particularly hydropower dams and irregation schemes) since 1991 have changed the perception of the pristine Mekong system, one of the world’s most biodiverse river basins (Cochrane et al. 2014, Winemiller et al. 2016). The Mekong’s natural flow patterns are considered a key environmental driver which plays a main role in structuring the communities of aquatic organsims both up and dowstream (Brownell et al. 2017). Although change in the Mekong flow patterns have been documented to a certain extent, its impacts on fishes and fisheries in some critical areas such as the Mekong-3S system and the Mekong largest wetland of the Tonle Sap are largely undocumented (Arias et al. 2012, Piman et al. 2013, Cochrane et al. 2014). Further, status and trends of fisheries in the LMB during this last decade have not been documented albeit the perception that the region’s fisheries have been declining (MRC 2010). Aguably, among the tropical largest wetlands on the planet, the Mekong River and the Tonle Sap, which supports one of the world’s biggest freshwater fisheries, have received little ecologcial research and conservation attention (Dudgeon 2000, Junk et al. 2006, Vaidyanathan 2011, Allen et al. 2012, Ngor et al. 2018a). Therefore, there is an urgent need to document and update the system’s fish biodiversity, i.e.
to generate reliable information about fish species diversity, species’ distribution, fish community composition and evolution through space and time. Combined with data on their ecological requirements the new insights from research can inform basin development planning as well as fisheries management and fish conservation actions.
In recognition of this important fact, the overall objective of the study is to investigate the dynamics of spatial and temporal fish community structure in the Lower Mekong system i.e. Lower Mekong River (LMR) and its major tributaries. To achieve the overall objective, the specific objectives are set out as follows:
(i) describe large-scale spatial fish diversity patterns and assemblage structure in LMR and its major tributaries.
(ii) examine spatial and temporal variation of fish assemblages in the complex Tonle Sap River and Lake system;
(iii) explore the signature of ‘indiscriminate fishing’ effects by examining the rates of temporal dynamics of the entire fish biomass composition of the Mekong’s largest, commercial-scale stationary trawl bagnet Dai fishery operating in the Tonle Sap River. (iv) investigate spatial and temporal fish community responses to flow changes in regulated
and unregulated rivers of the Lower Mekong system.
This thesis is divided into two main Parts. Part I is the Synthesis and Part II comprises the corresponding publications. In this Synthesis, Article 1-5 contribute to the overall description on broad-scale spatial and temporal variation in fish diversity patterns and assemblage structure in the LMR and its major tributaries (objective i). While Article 1 describes spatial fish distribution patterns in the LMR (objective i), Article 2 specifically investigates spatial and temporal variation of fish assemblages in the complex Tonle Sap River and Lake system (objective ii). Article 3 exclusively examines the ‘indiscriminate fishing’ effects of the Tonle Sap fisheries, by analysing temporal changes in the biomass of 116 fish species that seasonally utilize the Tonle Sap River system (objective iii). Finally, Article 4 and 5 scrutinize the spatial and temporal fish community responses to flow changes in regulated and unregulated rivers of the Lower Mekong system.
III. Materials and methods
3.1 Study area
This study covers the Lower Mekong system: the LMR and its major tributaries. LMR extends from the Golden Triangle which marks the borders of Thailand, Lao PDR, China and Burma, and which consists of Cambodia, Lao PDR, Thailand and Viet Nam. Key largest tributaries of the LMB include the TSRL and the Sekong, Sesan and Srepok Rivers known as the 3S Rivers (Fig. 8).
Fig. 8. Maps showing study sites in the Lower Mekong system. 3.2 Data collection
This study uses data from the long-term routine daily artisanal fish monitoring (2007-2014) in the LMB and a standardized catch assessment of the stationary trawl Dai fishery (2000-2015), the largest commercial fishery in the Mekong Basin. Data were made available by the Fisheries Program of the Mekong River Commission (MRC) that technically and financially supported the monitoring and catchment assessment programs.
For the daily artisanal fish monitoring, standard sampling procedures of the MRC (MRC 2007) were applied. Fishers were trained on sampling procedures, fish identification and the use of data recording forms. They were supervised by the fishery researchers from the fisheries line agencies and research institutes of the MRC member countries with technical support from the MRC fisheries
monitoring specialist. Fish photo books containing more than 200 fish species were also made available for all fishers to assist them in fish identification. Fish captured were identified to the species level and counted. Unidentified species were kept in formalin and taken to laboratory in the central office in each of the respective countries for further identification by professional taxonomists. At the end of each sampling quarter, the fishery researchers collected all recorded forms and data from all fishers. The recorded data were cross-checked with fishers for its accuracy and completeness before being brought to the national central offices for transfer into the national fish monitoring databases. The databases were quarterly cleaned and synchronized into a regional database with the help of an MRC database expert and capture fisheries specialist prior to the analyses.
For the Dai fishery, time series data of the fishery’s standardized catch assessment between 2000 and 2015 were used. The fishery operates seasonally from October through February/March in a specific location along the lower section of the Tonle Sap River, stretching about 4-30 km north of Phnom Penh. All Dai (64 units) are organized into 14 rows (row 2 to row 15) and operated individually or jointly of up to 7 units in a single row with the most upstream row 15 situated close to the Tonle Sap Lake. General concepts and formula for assessing catches and catch composition are outlined in Stamatopoulos (2002), and these concepts were used to frame the sampling protocols and assessing catches of the fishery. The sampling unit was based on Dai unit and a randomly stratified sampling method was used for the catch assessment. More specifically, Dai units were stratified based on: (i) administrative space divided into two strata (Phnom Penh Municipality and Kandal Province), (ii) time – the lunar period (low period and peak period) and (iii) Dai types (high yield and low yield Dai units). Random sampling on catches per haul or catches per unit of effort (CPUE; including CPUE for species in catch composition) and daily number of hauls of a Dai unit were conducted in each stratum, lunar period and Dai type within each month for monthly catch estimate. Likewise, fishing effort (number of active Dai units and active days) were recorded according to the stratification framework throughout each fishing month over the whole fishing season. Apart from sampling data on total catch for each species in each season, data were also obtained for the number, weight and length of some common and commercial individual fish specimens caught per day of each fishing season. These species (i.e.
Henicorhynchus lobatus, Labiobarbus lineatus, Pangasianodon hypophthalmus, Cyclocheilichthys enoplos, Cirrhinus microlepis, Osteochilus melanopleurus) are among the most ecologically,
socioculturally (food nutrition and security) and economically important species in the region (Rainboth 1996, Poulsen et al. 2004, Sabo et al. 2017). Therefore, they were used to examine the temporal changes in body weight and length for this study (Article 3).
In addition, this study uses a fish species list (about 900 species and their ecological attributes) that was obtained from the Mekong Fish Database (MFD 2003); the species list was updated by cross-checking with FishBase (Froese and Pauly, 2017), the Catalogue of Fishes Online Database and other literature sources i.e. (Rainboth 1996, Rainboth et al. 2012, Kottelat 2013). Moreover, other fish datasets
i.e. maximum total length (maxTL), trophic level and habitats in the water column were consulted from FishBase.
Article 1 uses daily fish monitoring datasets from 38 sites along the Lower Mekong River collected from November 2000 to December 2001. Article 2 uses 4-year daily time-series datasets from artisanal fishers (stationary gillnets and cylinder traps) in six sites: first site located on the Tonle Sap River and the other five sites situated in each of the five provinces around the Tonle Sap Lake from 2012 to 2015, whereas Article 3 uses the 15-year standardized seasonal catch assessment data of 116 fish species from the commercial-scale Dai fishery in the Tonle Sap River from 2000 to 2015. Finally, Article 4 and 5 uses a 7-year daily stationary gillnet monitoring data (riverine habitat) from six sites in the complex Mekong-3S system and Tonle Sap River.
3.3 Statistical analysis 3.3.1 Seasonal partitioning
In the Tonle Sap system (Article 2), the unique tropical flood pulse with flow reversal system i.e. rising water levels with flow direction to the Tonle Sap Lake (inflow) and falling water levels with reverse flow direction to the Mekong River (outflow) plays a pivotal role in influencing the intra-annual variation in fish community structure. For this reason, three seasons are defined to reflect the importance of the TSRL flood pulse system, using the 10-year mean intra-annual variation of daily water levels measured at the Tonle Sap Lake (Kampong Loung in Pursat [PS]): inflow or high flow period (July-October), outflow (November-February) and low-flow (March-June). In the Cambodian Mekong and 3S systems, seasonality is defined by a general wet and dry season of the tropical zone for the investigation of the intra-annual variation of fish communities (Article 1, 4, 5). The seasonal partitioning was based on 9-year mean daily water levels of the Mekong River, when entering Cambodia (at Stung Treng [ST]), with wet season covering the period from June to November and dry season from December to May.
3.3.2 Data preparation
For Article 1, all fish catches are transformed into relative abundance to reduce the effect of varying fishing efforts between sites and averaged to annual mean relative abundance prior to analysis. For Article 2, 4, 5, daily abundance data on stationary gillnet (and cylinder traps for Article 2 only) are computed as mean daily samples and then aggregated into weekly species abundance data. Article 3 is based on seasonal catch assessment data from all 64 units of the stationary trawl bagnet (Dai) fishery operating in the Tonle Sap River.
3.3.3 Flow seasonality and predictability
To quantify the strength of seasonality, Colwell’s seasonality index (Colwell 1974) on site daily water levels (Mekong, Sesan [3S], Tonle Sap) is computed using Colwells function of hydrostats package. The seasonality index M/P which is the Colwell’s measure of contingency (M) standardized by Colwell’s within-season predictability (P) (Colwell 1974, Tonkin et al. 2017) is used. In addition, modern wavelet analysis is applied to quantify the strength of predictability of site hydrology, using analyze.wavelet function, from WaveletComp package of the ‘mother’ Morlet wavelet (Roesch and Schmidbauer 2014).
3.3.4 Spatial and temporal description of fish community
All data analyses are performed in R (R Core Team 2017). Summary statistics, cluster analyses (using hclust with Ward hierarchical, and K-means clustering methods), boxplots, scatterplots, bubble plots, violin plots, jittering plots and histograms are applied to give a descriptive overview on the spatial and temporal dynamics of fish community structure, as well as weight and length of individual fishes by site and entire species pool in relevant study locations.
Unconstrained ordination techniques, e.g. Nonmetric Multidimensional Scaling (NMDS) and Principal Components Analysis (PCA) (Borcard et al. 2011, Kassambara 2017) are used to visualize fish assemblage samples in a two-ordination plane for the description and analyses of spatial and temporal variability of fish assemblage patterns in important areas of the LMB (Article 2, 4, 5). In addition, for time-series analyses, various time-series analytical tools are applied (Article 2-5). These tools include Whittaker–Robinson periodograms (Legendre and Legendre 2012, Dray et al. 2017), cross-correlation analyses (Shumway and Stoffer 2011), wavelet and cross-wavelet analyses (Roesch and Schmidbauer 2014).
For statistical tests, Permutational Multivariate Analysis of Variance (PERMANOVA) using adonis function of vegan package (with 999 permutations and bray method) is used to test the influence of different factors (e.g. cluster, season and year) on the fish community composition. Complementary, contrast methods are applied to test the pairwise differences between different levels in each of these factors, using pairwise.adonis function in R. In addition, non-parametric Wilcoxon rank-sum and Turkey’s multiple comparison tests are performed to test the significant differences between variables i.e. survey sites or weeks/years over the study period. For correlation tests, non-parametric Spearman's correlation tests are used. Significance at the 0.05 level is applied for all tests. Further, to identify species indicator characterizing fish communities in a study site or a cluster, multipatt function from indicspecies package is applied (Cáceres and Legendre 2009, De Cáceres and Jansen 2011).
3.3.5 Species diversity
Richness is computed using specnumber function, whereas inverse Simpson index is computed using diversity function (method = ‘inv’) of vegan package. To compare species richness between sites, rarefaction technique (Article 2) is used to standardize sampling efforts and generate smooth curves for comparison. Rarefaction technique is performed using rarc function from rich package, and c2cv function is used to assess the significance of differences in species richness among sites (Rossi 2011). Moreover, to investigate temporal dynamics of community composition, temporal beta diversity (Article 4) is computed using beta.div function of the adespatial package (Legendre and De Cáceres 2013, Dray et al. 2017). In estimating total beta diversity (BDtotal), the total variance of
Hellinger-transformed weekly assemblage abundance data is used (Legendre and De Cáceres, 2013). BDtotal has a value between 0 and 1 for Hellinger-transformed data. BDtotal can be compared among sites
if the sampling units across the study sites are of the same size (Legendre and Salvat 2015), which is the case for the study (Article 4). If BDtotal is equal to 1, all sampling units have a completely different
species composition. BDtotal is then partitioned into Local (temporal) Contributions to Beta Diversity
(LCBD) and Species Contributions to Beta Diversity (SCBD). LCBD is a comparative indicator of the ecological uniqueness of the sampling units. LCBD values give a total sum of 1 for a given data matrix and can be tested for significance (at the 0.05 level in the present study [Article 4]). Species with SCBD indices well above the mean are regarded as important species contributing to beta diversity (Legendre and De Cáceres 2013).
3.3.6 Linear regression models
Linear regression is used to predict the rate of change in the total catch weight of 116 fish species recorded at the Dai fishery between 2000 and 2015 (Article 3). The temporal trend for each of the 116 species is expressed as a standardized regression coefficient to allow comparison among species. Linear regression models are also used to describe temporal changes of fish biomass in relation to maximum fish size and trophic positions as well as individual fish weights and length through time. To identify the key species contributing to the temporal dynamics of species composition over the study period (Article 4), species with SCBD indices greater than the mean at each site are extracted from the community composition matrix. Redundancy Analysis (RDA) is then performed on the community composition data against time and its quadratic effect as explanatory variables. Using RDA, the relationship between the observations (sampling units), species and explanatory variables (the years) can be visualized. Further, to help identify the key species explaining the temporal shift in assemblage composition, indicator species characterizing fish assemblages at each site are computed using the multipatt function of the indicspecies package (Cáceres and Legendre 2009, De Cáceres and Jansen 2011) for comparison.
IV. Results
4.1 Summary of recorded catches in the Lower Mekong Basin
Of three MRC fisheries monitoring programs in the LMB during this last decade, namely the artisanal fish monitoring, the commercial dai fishery monitoring and lee trap monitoring, some 504 fish species and two groups of other aquatic animals (OAAs), which are freshwater prawns and clams, are recorded. These fish species belong to 252 genera, 78 families and 22 orders. Four main orders representing ~82% of the total species counts are: Cypriniformes (202), Siluriformes (101), Perciformes (94) and Clupeiformes (20) (Fig. 9).
Among the recorded 78 fish families, the top six families which account for 52% of total species counts are Cyprinidae (32%), Cobitidae (5%), Siluridae (4%), Bagridae (4%), Pangasiidae (4%), and Gobiidae (4%); each of the remaining 72 families comprise less than 4% of the species counts. Most of these top fish families also form the largest proportion of both total species abundance and biomass (Fig. 10 and 11).
Fig. 9. Number of species by order: 22 fish orders and 2 orders of other aquatic animal (OAA)1 i.e.
Decapoda (freshwater prawns) and Veneroida (clams). Data source: MRC routine fish monitoring programs: commercial Dai fishery (2000-2014), lee trap fishery (2000-2014) and artisanal fisheries (2007-2014).
Fig. 10. Relative total abundance highlighting the four top fish families that contribute 96% to the total abundance and the list of other fish and two OAA families reported in the MRC fish monitoring programs. Data source: MRC routine fish monitoring programs: commercial Dai fishery (2000-2014),
lee trap fishery (2000-2014) and artisanal fisheries (2007-2014).
Fig. 11. Relative total biomass highlighting the four top fish families that contribute 94% to the total fish biomass and the list of other fish and two OAA families reported in the MRC fish monitoring programs. Data source: MRC routine fish monitoring programs: commercial Dai fishery (2000-2014),
4.2 Overall fish assemblage structure and diversity 4.2.1 The Lower Mekong River
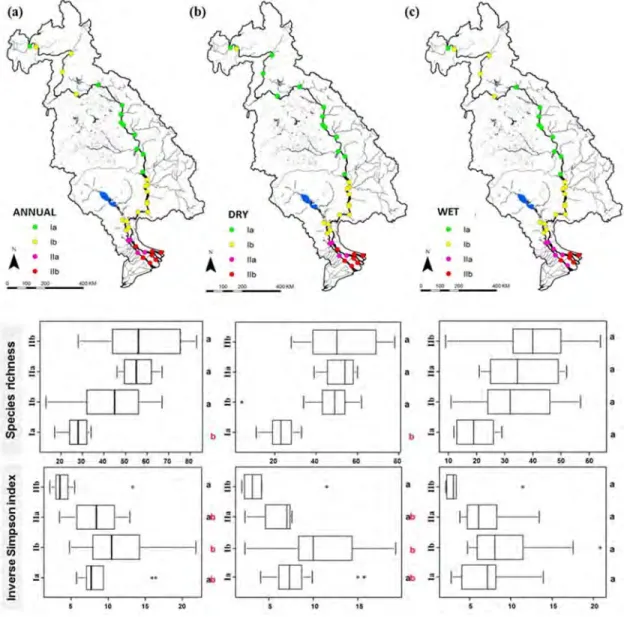
At reginal spatial scale, fish species richness is found to be linked to longitudinal river gradients with level of richness increasing towards lower altitude. From a one-year daily fish catch monitoring, the lowest richness occurs at the head of the LMR (17 species) and the level of richness increases gradually as the river reaches the mouth of the Mekong River in its delta (82 species) (Fig. 12a). This pattern is observed to exist consistently during both wet and dry seasons (Fig. 12b, c). On the contrary, the Inverse Simpson diversity index is found to be the highest (median: 10.5) in the middle part of the river system and lowest (median: 3.5) at the mouth of this river (Mekong delta) (Fig. 12a, b, c).
Fig. 12. Fish distribution and assemblage patterns in the Lower Mekong Basin. Annual (a), dry season (b) and wet season (c) clustering associated with species richness and inverse Simpson index of each
cluster (Ia, Ib, IIa, IIb). Mean values among clusters with a common letter are not significantly different at p-value=0.05 (Tukey’s HSD tests).
Some 80 indicator fish species are identified from the four annual clusters as shown in Fig. 12a. Species indicators in each cluster are given in Annex 1. The highest number of indicator species is found in IIb (31 species), while the lowest is observed in Ia (11 species). The clusters in the Mekong delta (IIa and IIb) make up 66% of the total indicator species. The indicator species in Ia and Ib are mostly species from Cyprinidae, Pangasiidae, Siluridae and Bagridae families, namely Cosmochilus
harmandi, Bagnana behri, Helicophagus waandersii, Labeo chrysophekadion, Bagarius yarelli, Henicorhynchus spp., Micronema bleekeri and Hemibagrus nemurus, which are known as
potamodromous fish and indigenous to the LMB. Assemblage IIa contains 21 indicator species. Among them, many are known as freshwater and secondary freshwater fishes such as Glossogobius giuris,
Macrognathus siamensis, Acantopsis sp., Puntioplites proctozysron, Mastacembelus armatus and Mystus mysticetus. Similarly, the main indicator species of IIb are mostly characterized by secondary
freshwater fish and marine species, known as amphidromous and anadromous fishes, that is
Clupeichthys aesarnensis, Rasbora trilineata, Scomberomorus sinensis, Eleotris spp., Liza spp., Arius stormi, Toxotes spp. and Lates calcarifer. Most of indicator species during the dry season are also
identified as indicator species using annual assemblage compositions. Overall, dry season assemblages contain more indicator species (73 species) as compared to wet season assemblages (51 species), while many indicators species from annual IIa and IIb are absent in the wet season.
4.2.2 The complex Mekong-3S system
Over the 7-year period, 292 species have been recorded in the catch samples. Among those, 208 fish species are recorded in Kratie (KT), 196 in Stung Treng (ST), 177 in the Srepok River (SP), 133 in the Sesan River (SS) and 216 in the Sekong River (SK). These fishes belong to 14 orders, 48 families and 151 genera. Five main orders represent 90% of the total species count: Cypriniformes (146 species), Siluriformes (66), Perciformes (34), Pleuronectiformes (9) and Clupeiformes (6). The top five families accounting for 63% of total species counts are Cyprinidae (123 species), Bagridae (16), Cobitidae (16), Pangasiidae (15) and Siluridae (11).
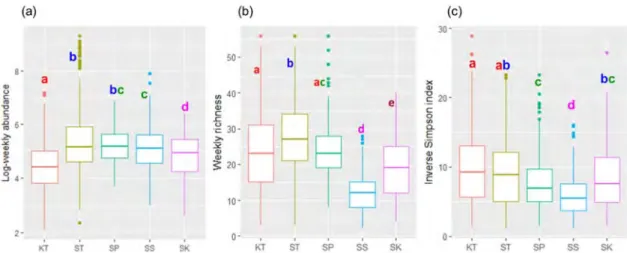
In addition, boxplots on weekly abundance, richness and inverse Simpson diversity index (Fig. 13a-c) indicate that Kratie (KT) has lowest weekly abundance, whereas ST possesses the highest abundance. The abundance in SP is comparable to that of ST while the fish abundance in SS and SK displays intermediate status among the five sites. For richness, the Mekong sites has the highest richness (KT: median=23, sd=10.95; ST: median=27, sd=9.87) and inverse Simpson indices (KT: median=9.20, sd=5.30; ST: median=8.82, sd=5.10) relative to the 3S sites. Noticeably, SS shows both the lowest species richness (median=12, sd=5.14) and diversity index (median=5.45, sd=2.78) of all sites, whereas SP is comparable with KT in terms of species richness. Although SP had higher species
richness (median=23, sd=7.52) than SK (median=19, sd=8.25), the diversity indices between the two sites are not significantly different (SP: median=6.89, sd=3.70; SK: median=7.49, sd=4.38).
Fig. 13. Fish diversity in the Mekong-3S system. (a) Weekly species abundance (log-scale); (b) Weekly species richness; and (c) Weekly inverse Simpson diversity index. Mean values among sites with a common letter are not significantly different at the 0.05 level (Pairwise Wilcoxon Rank Sum Tests). For site names, KT=Kratie, SK=Sekong, SP=Srepok, SS=Sesan, and ST=Stung Treng.
4.2.3 The Tonle Sap system
In the Tonle Sap system, the largest wetlands and a major tributary of the Mekong Basin, 204 species from 114 genera, 38 families and 13 orders have been recorded over four-year monitoring period in six study sites on the Tonle Sap River and around the Tonle Sap Lake. The three main orders representing 87% of the total species count are Cypriniformes (100 species), Siluriformes (48) and Perciformes (29). Clupeiformes, Osteoglossiformes and Synbranchiformes, each containing five species; the rest contributes less than 6% to the total species counts. At family level, the top five families accounting for 60% of total species counts are Cyprinidae (80), Bagridae (12), Pangasiidae (11), Cobitidae (10) and Siluridae (10); each of the remaining 33 families comprise one to six species. At species level, ~62% of catches is dominated by 12 fish species namely Henicorhynchus lobatus (11%),
H. siamensis (10%), Trichopodus trichopterus (7%), Puntioplites proctozysron (7%), Osteochilus vittatus (6%), Trichopodus microlepis (5%), Labiobarbus lineatus (4%), Paralaubuca typus (3%) and Mystus mysticetus (3%), Notopterus notopterus (3%) and Rasbora tornieri (3%). Ecologically,
longitudinal migratory species (white fish) account for ~58% of total abundance, while floodplain resident black and lateral-migrant gray fishes contribute 19% and 21%, respectively. The rest (1%) is composed of estuarine species and marine visitors. Among the six survey sites, the highest species richness is observed in the middle section of the lake in Kampong Thom (KT) and Pursat (PS) while the lowest richness occurs in the northern part in Battambang (BB) (Fig. 14a). Similar richness is observed in Kandal (KD), Kampong Chhnang (KC) and Siem Reap (SR). Also, richness in PS is
comparable with that of KD and SR. In addition, the lowest abundance is observed in KD, while the highest was reported in Kampong Thom (KT) (Fig. 15). Likewise, the highest diversity index occurs in the middle part of the lake in PS and KT while the lowest is observed in the river section in KD (Fig. 14b). Diversity index in KC is similar to that in BB.
Fig. 14. Spatiotemporal comparison of site fish species richness and diversity in the Tonle Sap River and Lake: (a) site rarefaction curves on species richness; (b) site inverse Simpson index with south-north gradient along the Tonle Sap Rive and Lake. Sites with a common letter are not significantly different at p-value=0.05.For site names: KD=Kandal, KC=Kampong Chhnang, KT=Kampong Thom, PS=Pursat, SR=Siem Reap and BB=Battambang.
Fig. 15. Spatiotemporal comparison of site fish species abundance in the Tonle Sap River and Lake. Mean values among sites with a common letter are not significantly different at p-value=0.05 (Wilcoxon test). For site names, see Fig. 14.
4.3 Spatial variation in fish abundance distribution 4.3.1 The Lower Mekong River
The relative abundance of fish orders varies greatly along the longitudinal gradient of the LMR system, and this pattern is consistent between seasons for all fish orders except Clupiformes, Fig. 16, Wilcoxon test, p<0.05). Apart from the Mekong delta, that is particularly in Ia and Ib (see Fig. 12), Cypriniformes and Siluriformes dominated and occurred almost in every site, while their abundances declined dramatically in the delta. Additionally, Osteoglosiformes and Perciformes are found in some sites of Ib in Cambodia. In the delta (IIa and IIb), the fish composition is diverse and characterized by many species from different orders such as Clupeiformes, Perciformes, Pleuronectiformes, Synbranchiformes, Tetraodontiformes; among those, Perciformes and Clupeiformes are the most abundant (Fig. 16).
Fig. 16. Relative abundances of fish order along the Lower Mekong River. Open and closed circles denote the wet and dry seasons respectively. The acronyms in the vertical axis denote the species order: angu (Anguilliformes), batr (Batrachoidiformes), belo (Beloniformes), clup (Clupeiformes), cypr (Cypriniformes), mugi (Mugiliformes), oste (Osteoglossiformes), perc (Perciformes), pleu (Pleuronectiformes), raji (Rajiformes), silu (Siluriformes), synb (Synbranchiformes), tetr (Tetraodontiformes). The acronyms in the horizontal axis indicate the location of the sites: TH (Thailand), LA (Lao PDR), CA (Cambodia) and VN (Viet Nam). *denotes significant differences in fish relative abundance between seasons (Wilcoxon test, p-value=0.04).
4.3.2 The Mekong-3S system
K-means clustering (with five clusters) on a PCA plot (Fig. 17) shows that sites on the Mekong
(cluster 4 and 5) overlap, indicating assemblage similarities between the two sites, while the 3S sites, particularly SK (cluster 1) and SS (cluster 2), are distant from the Mekong sites, suggesting distinct assemblages. SP (cluster 3) exhibits some similarities with the Mekong sites (ST). Assemblage dissimilarities are further observed among the 3S sites (axis 2).
Fig. 17. Fish assemblage patterns in the Mekong-3S system, using K-means cluster on PCA plot (k=5) on Hellinger-transformed yearly assemblage data. Five convex hulls (with different colors) represent each assemblage cluster of the Mekong-3S system. A combination of two letters and two digits denotes the site name and year; for example, KT07 is Kratie in 2007. For site names, KT=Kratie, SK=Sekong, SP=Srepok, SS=Sesan, and ST=Stung Treng.
4.3.3 The Tonle Sap system
Based on fish community composition, KD in the most southern section of the system is significantly different from the other sites along the first axis of the NMDS, whereas the second axis mainly opposes BB in the northern part of the lake to the other sites (Fig. 18b). Hierarchical clustering with Ward agglomerative method allows classifying all weekly samples into three clusters (Fig. 18a) according to their species composition similarities. The first split of the dendrogram defines fish assemblages in riverine (cluster 1) and lacustrine environments (cluster 2 and cluster 3), while the