Science Arts & Métiers (SAM)
is an open access repository that collects the work of Arts et Métiers Institute of Technology researchers and makes it freely available over the web where possible.
This is an author-deposited version published in: https://sam.ensam.eu Handle ID: .http://hdl.handle.net/10985/17875
To cite this version :
Saptarshee MITRA, Mohamed EL MANSORI, Antonio RODRÍGUEZ DE CASTRO, Marius COSTIN - Study of the evolution of transport properties induced by additive processing sand mold using X-ray computed tomography - Journal of Materials Processing Technology - Vol. 277, p.116495 - 2020
Any correspondence concerning this service should be sent to the repository Administrator : archiveouverte@ensam.eu
Study of the evolution of transport properties induced by additive processing sand mold
1
using X-ray computed tomography
2 3
Saptarshee Mitra1, Mohamed EL Mansori1,2, Antonio Rodríguez de Castro3,Marius Costin4 4
5
1
Laboratoire MSMP – EA7350, Arts et Métiers ParisTech, 2 Cours des Arts et Métiers, 13617 6
Aix-en-Provence, France 7
2
Texas A&M Engineering Experiment Station, College Station, TX 77843, USA 8
3
Laboratoire MSMP – EA7350, Arts et Métiers ParisTech, Rue Saint Dominique, 51006 9
Châlons-en-Champagne, France 10
4
CEA, LIST, Department of Imaging & Simulation for Non-Destructive Testing, F-91191 Gif-11 sur-Yvette, France 12 13 14 15 16 17 18 19 20 21
Abstract
22
Accurate characterization of the mass transport properties of additively processed sand molds 23
is essential in order to achieve reproducibility of the produced castings and control of gas 24
defects in foundry industries. The present work highlights the potential use of X-ray micro-25
computed tomography (µ-CT) to characterize the evolution of permeability and some major 26
microstructural features of such additively processed sand molds. The evolution of mass 27
transport properties of sand mold samples under specific processing conditions met in 28
additive manufacturing and its influence on the porosity, the permeability, the tortuosity, and 29
the pore and throat size distributions were characterized from 3D images provided by X-Ray 30
µ-CT. The obtained results showed that the mass transport properties of additively processed 31
sand molds can be closely predicted by using non-destructive in situ methods, such that 32
improvements to the casting can be made to create more optimized 3D printed structures for 33
foundry applications. 34
35
Keywords: Additive manufacturing; 3D-printed casting sand mold; Permeability; Pore Size
36
Distribution; X-ray µ-CT; Numerical simulations; Pore network modeling. 37
38
1. Introduction
39 40
Three-Dimensional Printing (3DP) technology, also termed as Additive Processing (AP) or 41
joining technology, emerged as a new rapid manufacturing method in foundry industries to 42
build three-dimensional (3D) sand molds directly from Computer-Aided Design (CAD) 43
models in layers. As compared with the traditional conventional sand mold, (Sachs et al., 44
1990) stated that this kind of rapid-prototyping technique offers the ability to efficiently 45
manufacture sand molds and cores in casting industry with optimized geometries as designed 46
with CAD without the need of extensive molding. Additively processed sand mold is also 47
advantageous over conventional methods due to its ability to reduce surface defects in the 48
molds as shown by (Hawaldar and Zhang, 2018). Rapid prototyping technique has been 49
accepted extensively in the casting industries due to its proven capability to reproduce a 50
virtually complex designed object into a real casting mold. (Almaghariz, 2015) studied the 51
economic advantage of 3DP technology and found that there is no influence of part 52
complexity on the manufacturing costs of molds and cores. This technique allows the 53
production of highly complex components in a cost-effective way as shown by (Almaghariz et 54
al., 2016) and good surface finish as shown by (Hawaldar and Zhang, 2018). Despite being 55
still limited in number, the applications of AP technique are much diversified, including 56
aerospace, automobile, and medical industries. Consequently, 3DP represents a step forward 57
towards autonomous casting in which a sand mold can be printed without any machining 58
stage. In this regard, (Upadhyay et al., 2017) published an extensive literature review 59
elsewhere, so only the key features of additively processed sand molds are reminded in the 60
present article. 61
62
AP has enabled the casting industries and foundries to produce more complex sand molds 63
without using any kind of physical model, through a succession of thin layer which are 64
directly generated from 3D CAD files. The layer-based rapid prototyping technology, or 65
Powder Binder Jetting (PBJ), consists in bonding individual particles with a liquid resin 66
binder, which generates porous parts. The existence of such porosity is necessary in casting 67
sand molds so that the gases can be efficiently evacuated from the mold cavity through the 68
interstices during filling of the mold. This minimizes the risk of casting defects caused by gas 69
trapping in the liquid alloy. Fig. 1(a) describes the PBJ process, in which ceramics kind of 70
materials are generally used as to provide refractoriness to the mold, and a liquid resin binder 71
provides cohesion in between such ceramic particles by forming capillary bridges, Fig. 1(b). 72
For metal casting, a temperature-resistant material is required, so silica sand is generally used 73
as granular material for the PBJ process, and a furan resin is commonly taken as a liquid 74
binder due its high performance in terms of dimensional accuracy and mechanical strength of 75
the printed mold. Also, various 3D printing process parameters directly affect the quality of 76
the sand mold. In particular, the relationship between the printing process parameters (print 77
position/orientation in job-box, recoater speed, and print resolution) and their influence on the 78
properties of the 3DP sand mold have been extensively investigated in previous works using 79
both mathematical modelling by (Coniglio et al., 2017) and experimental validations by 80
(Sivarupan et al., 2017). (Sivarupan et al., 2017) showed how the printing processing 81
parameters affected mechanical properties in 3DP sand mold. It was also reported by (Mitra et 82
al., 2019) that the mechanical strength and permeability of 3DP sand molds are deeply 83
dependent on the amount of binder and the ageing conditions. In this regard, the evolution of 84
permeability and mechanical strength of such additively processed silica sand molds during 85
curing was studied in a recent work by (Mitra et al., 2018) for different binder contents and 86
curing parameters, showing that the 3D printed sand molds could be stored for long time at 87
room temperature before being used for metal casting, while no substantial variation in 88
strength of 3DP mold was observed below 100 °C, the gas permeability was found to decrease 89
with increase in curing temperature. However it is of equal importance for morphological 90
characterization of such additively processed porous structures to be standardized in foundry 91
with proven quality control, especially as the 3DP structures can be customized and changed 92
(based on printing process parameters) easily to alter its mass transport properties based on 93
casting requirements. 94
95
Fig. 1. The PBJ process showing, (a) the initial distribution of furan binder within the silica
96
sand particles, (b) the drying stage of resin-bridges by infrared heating during the printing of 97
the mold and the optional curing stage to obtain stronger resin-bridge after printing of the 98
mold. 99
100
Characterization of mass transport properties through pore networks with complex geometry 101
and connectivity, such as 3DP sand molds, is essential in order to assess the risks of 102
incomplete filling and gas porosity in castings. The fundamental microstructural 103
characteristics include grain size distribution, pore size distribution, throat (pore constriction) 104
size distribution, pore-to-throat size ratio, pore connectivity, and tortuosity. These 105
microscopic physical properties will control the macroscopic characteristics of the 3DP molds 106
in terms of permeability and porosity governing the flow of liquid metal, and, more generally, 107
the heat and mass transport within the 3DP sand mold. Therefore, knowledge of the 108
relationships of 3DP process parameters and these microscopic characteristics is of vital 109
importance to predict casting defects. On this subject, it was stated earlier by (Sivarupan et al., 110
2017) that high reacoater speeds lead to lower grain packing densities in 3DP molds (porosity 111
depends on recoating speed). It is also known that high levels of sand compaction reduce 112
permeability due to the decrease in volume available for fluid flow and the increase in specific 113
surface of the interstices. Pore Network Modelling (PNM) offers a simple demonstration of 114
the complex pore structure and topology, but quiet more accurate than traditional bundle-of-115
capillaries model. In PNM the void phase is divided into a set of spherical pores connected by 116
cylindrical throats. A complete review of PNM for porous geometries (pore network 117
construction) has been studied elsewhere by (Xiong et al., 2016). (Huang et al., 2019) used 118
PNM to extract the network of pores and the connected throats from a fibrous material to 119
simulate two-phase flow. It was shown by (Degruyter et al., 2009) and (Degruyter et al., 120
2010) that the permeability can be predicted using the throat size distributions with the 121
modified Archie’s law. 122
123
In the industrial foundry processes, numerical simulations of mold filling and casting 124
solidification are employed in order to optimize the part designs, reduce the manufacturing 125
costs and prevent defect generation. However, the lack of accurate estimations of key inputs, 126
e.g., local porosity, density, permeability, and strength, limits the usefulness of the obtained 127
numerical results. Therefore, it is crucial to develop a non-destructive method to properly 128
characterize 3DP sand molds in order to predict the relationships between process parameters 129
and the inputs to such simulations. Other non-destructive methods include the traditional 130
permeability test in which air is injected to the 3D printed sample (although they need 131
sampling of the mold). Also, Scanning Electron Microscope (SEM) imaging could be 132
considered as a suitable non-destructive method, but only 2D microstructural information can 133
be extracted. Although Mercury Intrusion Porosimetry (MIP) is by far the most popular 134
method for characterizing the pore size distribution of porous materials with pores in the 135
range of 500 μm to 3.5 nm as stated by (Giesche, 2006), MIP experiments are not expected to 136
work well on unconsolidated materials like 3D printed casting sands because the applied 137
pressure damages the material and its void-structure. X-ray micro computed tomography (µ-138
CT) is a non-destructive and non-intrusive method as stated by (FLANNERY et al., 1987), 139
allowing the characterization of 3D printed sand mold specimens. On this regard, a complete 140
review of X-ray µ-CT and its applications has been studied elsewhere by (De Chiffre et al., 141
2014). X-ray µ-CT has emerged as a powerful nondestructive technique (NDT) for the direct 142
3D characterization of complex porous geometries. (Hazlett, 1995) stated that the 3D images 143
of the pore space, like those provided by X-ray µ-CT, can be used for direct computation of 144
multiphase fluid flow and to reliably characterize permeability from the realistic digital 145
images provided by this technique. 146
147
Different numerical methods exist for the simulation of creeping flow through porous media 148
at the microscale, e.g., Finite Volume Method (FVM) and Lattice Boltzmann Method (LBM). 149
(Jaganathan et al., 2008) used FVM to model fluid flow through the real microstructure of a 150
fibrous mat to predict the permeability and compared them to various analytical expressions. 151
(Soulaine, 2015) used FVM to perform a direct numerical simulation of fluid flow in a fully 152
saturated porous media for the prediction of permeability from µ-CT image. (Thabet and 153
Straatman, 2018) idealized a geometrical introduced to characterize small volume of packed 154
sand in pore-level computations using YADE (Yet Another Development Engine) solver. In 155
previous research by (Boek and Venturoli, 2010), it was proved that using LBM, to obtain 156
permeability from a digital image is a reliable alternative to destructive traditional 157
measurements. (Malaspinas et al., 2010) presented a novel lattice Boltzmann scheme to 158
simulate viscoelastic fluid flows, and stated that LBM results were found to be in good 159
agreement with analytical and other numerical results. In this sense, some works were 160
performed earlier by (Degruyter et al., 2010) combining LBM and X-ray µ-CT for the 161
calculation of permeability of volcanic pumices. (Kadauw, 2014) characterized the local 162
density of sand mold using industrial computed tomography, and found good agreement with 163
the experimental density of sand mold. Some typical results were reported recently by 164
(Sivarupan et al., 2018) for the use of X-ray µ-CT to characterize the additively processed 165
porous structure like 3DP sand mold. (Anbar et al., 2019) used LBM to predict permeability 166
from a computer-generated sphere packing, and to study the impact of sand compaction from 167
the simulations. However, no other literature review exists tackling the particular case of 168
permeability characterization of 3DP sand molds from µ-CT digital images using LBM and 169
PNM. 170
171
The current work will describe an accurate and rigorous method to characterize the physical 172
properties of such additively processed sand mold from the digital images provided by X-ray 173
µ-CT. The first point of inquiry is, what is the real local permeability of 3D printed structure? 174
To achieve that goal, a set of X-ray µ-CT experiments are first performed on additively 175
processed silica samples with different silica grain sizes and binder percentage. The 176
microstructural properties are secondly determined through the use of image analysis 177
techniques and PNM. Then, LBM numerical simulations and analytical methods are used to 178
predict the permeability of the samples, and the results are subsequently compared to 179
experimental measurements provided by traditional techniques. 180
181
2. Materials and methods
182 183
2.1. Manufacturing process of 3DP sand mold specimen
184 185
The raw materials in the current experiments were silica sand and a furfuryl-alcohol-186
composed binder (furan resin binder) with a density of (1.1-1.2) g/cm³, as provided by 187
(ExOne, 2014). The silica sand particles used in the present experiments had a mean particle 188
diameter of 140 µm and 190 µm as specified by the supplier in (ExOne, 2013). 189
190
The samples were designed with NetFabbTM software and subsequently converted to .stl 191
format. The designed samples were printed with an ExOne S-Print-Furan 3D printing 192
machine, over a job-box size of 800 × 500 × 400 mm3. The process of 3D printing began by 193
adding sulfonic acid (0.18 wt% of the sand) with 8 kg of sand inside a mixing chamber. The 194
acid-activated sand mixture was then transferred to the re-coater. Successive layers of sand 195
grains were added and compacted over the build platform by means of a re-coater head. 196
Furfuryl alcohol binder was then gradually injected by the print head nozzle on top of these 197
compacted sand layer beds in order to bind them. The injected furan-resin-binder droplets 198
tend to form a coating layer over individual sand grains. This causes the resin-bonded sand 199
grains to crosslink with each other by forming a resin bridge between the sand grains. The 200
additive processing of resin-bonded sand in layers continued until the designed part is 201
fabricated. This resin bridge in between the sand particles hardens gradually, hence providing 202
strength to the printed mold. 203
204
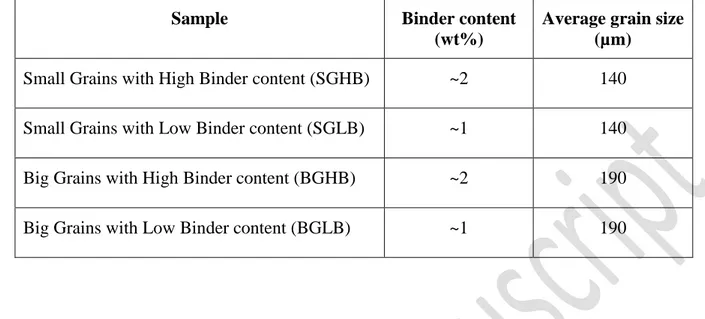
For the X-ray CT analysis, 10 small-grain and 10 big-grain cylindrical samples with different 205
binder percentages were printed and named accordingly as provided in Table 1. A set of 20 (5 206
× 2 different binder content × 2 different grain size) cylindrical specimens were printed for 207
the experimental permeability measurements, with a diameter of 50 mm and height of 50 mm. 208
209 210 211
Table 1. 3DP specimens used for analysis
212
Sample Binder content
(wt%)
Average grain size (µm)
Small Grains with High Binder content (SGHB) ~2 140
Small Grains with Low Binder content (SGLB) ~1 140
Big Grains with High Binder content (BGHB) ~2 190
Big Grains with Low Binder content (BGLB) ~1 190
213
The choice of the binder percentages was based on the recommended values for binder 214
contents (0.9% - 2%) reported in previous research by (Hawaldar and Zhang, 2018). The 215
dimensions of the 3D printed parts for X-ray µ-CT tests were measured manually using 216
Vernier caliper, with top height of 12 ± 0.02 mm, base height of 10 ± 0.02 mm, top diameter 217
of 4 ± 0.02 mm and base diameter of 6 ± 0.02 mm, respectively (the uncertainty corresponds 218
to 95% confidence interval), Fig. 2(d). The temperature of the 3D printing room was 219
controlled at 25 ± 2 °C and the measured relative humidity of the room was 40 ± 10%. A 220
detailed experimental investigation of the effects of mass transport improvement on 221
mechanical strength of 3DP sand mold was presented in previous works by (Mitra et al., 222
2018), (Mitra et al., 2019) and (Ramezani Dana and El Mansori, 2019). 223
224
2.2. Volumetric reconstruction of 3DP mold via X-ray tomography
225 226
2.2.1. X-ray micro computed tomography: image acquisition and post-processing
227 228
In the present study, reconstructed 3D tomographic images of 3DP specimens were used to 229
extract information on microstructural characteristics (grains, pores, porosity, tortuosity) and 230
permeability through image analysis, PNM and LBM simulations. The X-ray µ-CT images 231
were obtained at a facility of CEA LIST (NDT department). The X-ray equipment consists of 232
a micro-focus X-ray generator, a flat panel detector, and a turn-table, situated in a large 233
inspection cell which enables the addition of instrumentation for in-situ characterizations. The 234
X-ray generator is a Viscom 225 kV (320 W) model with a micro-focus spot-size. The 235
detector is a Perkin Elmer XRD0822 model having 1024 x 1024 pixels of 200x200 μm2 in 236
size, and the acquisitions were performed in a classical setup with a rotating sample (360°) 237
and static source and detector positions. The optimum scan settings for the specimens were 238
determined, obtaining 100 kVp, 60 μA, and 1 second exposure time. For each CT scan, a 239
number of 900 projections were acquired, with an integration time of 1 second. The total 240
acquisition scan was about 30 minutes. The scan facility uses a temperature controlled 241
inspection cell and therefore the impact of temperature variations is considered negligible. 242
The magnification factor was set to 40, which gives a voxel size of 5 μm3
in the CT images. 243
The reconstructions and preliminary analysis were performed by using VGSTUDIO MAXTM 244
commercial software at a facility of CEA LIST (NDT department). The setup is shown in Fig. 245
2 as well as the sample holder and the details of specimens. 246
247
Fig. 2. Different views and schemes of the experimental X-ray µ-CT setup showing: (a) the
248
robotic X-ray inspection platform, (b) a schematic design of the sample holder (c) the sample 249
holder and (d) a zoom-in view including the dimensions of the sample. 250
251
For the morphological assessment of 3DP sand mold, the acquired 3D images were binarized 252
and analyzed using the default algorithms provided by (Schindelin et al., 2012) included in 253
ImageJ and subsequently post-treated using different software: ParaView by (Ayachit 254
Utkarsh, 2015), PALABOS by (Latt J, 2009) and OPENPNM by (Gostick et al., 2016). The 255
post-treatment procedure starts by cropping and scaling the raw stack of images, resulting in 256
the cross-sectional dimensions displayed in Fig. 3. Reconstructed X-ray µ-CT images were 257
then filtered using a variance weighted mean filter to reduce the effect of background noise. A 258
median filter of 2 voxels was applied, as shown in Fig. 3(b), to reduce noise without merging 259
the solid particles. The cropped image was then binarized using the Otsu algorithm by (Smith 260
et al., 2010) and was converted into an 8-bit greyscale thresholded image, as shown in Fig. 261
3(c). The reconstructed pixel data were then converted into an 8-bit grayscale image. It should 262
be noted that a 3DP specimen consists of three phases with different attenuation coefficients: 263
silica sand, resin binder and air (pores). It is to be noted that the binder produces a low 264
contrast with respect to silica and is difficult to isolate in a CT image. Therefore, only two 265
phases, e.g. void and solid, were identified in the present experiments. However, the absence 266
of binder in the segmented image is not expected to significantly alter the computed 267
permeability values, due to the low binder contents (1 – 2 wt%) and based on previous results 268
as shown by (Mitra et al., 2019). Furthermore, the thresholding of the CT data was carried out 269
in an iterative manner and validation of the threshold was performed through comparison of 270
the estimated porosity to the porosity measured with a classical mass weighting apparatus. 271
272
273
Fig. 3. Steps during post-treatment of the acquired images: (a) raw image (2D slice), (b)
274
median filter treatment and (c) converted to 8-bit greyscale binary image. White represents 275
interstices and black corresponds to solid grains in the binary image. 276
2.2.2. Grain size distribution and measurement of tortuosity
278 279
The sand grain shape and size plays an important role in the fabrication of 3DP sand mold, as 280
they deeply impact the permeability of the sand molds, hence casting quality. The finer the 281
silica grains, lower the permeability will be, similarly the coarse silica grains will lead to a 282
higher permeability. Grains are generally categorized based on their shapes; rounded, sub-283
angular and angular. Rounded grains lead to high permeability of sand mold, due to least 284
contact with other grains during the sand compaction. However, these kinds of grain shape do 285
not pack up to its maximum, hence lacks strength. Whereas sub-angular grains have low 286
permeability with high strength values compared to the rounded grains. The angular grain 287
provides higher strength to the 3DP mold, but with low permeability due to tight packing of 288
grains. Therefore it was of great importance to characterize the grain size distribution along 289
with their forms, as it directly affects the casting quality. 290
291
For the analysis of the silica grains size distribution, Morpholib - Distance Transform 292
Watershed 3D algorithm by (Legland et al., 2016) included in ImageJ was applied to the 293
thresholded images in order to separate touching objects (creating a border far from the center 294
of the overlapping object). The watershed segmentation algorithm detects and separates pore 295
bodies in 2D or 3D images. Then, the connected components are scrutinized using Analysis 296
3D – Labelling plugin by (Boulos et al., 2013) from ImageJ. By using this algorithm, a new 297
volume was generated in which all the particles were labeled. From the generated results, the 298
equivalent diameter of each silica grain dg was calculated using Eq. 1:
299
d𝑔 = √6 × volmarch π3 ⁄
(1)
with 𝑣𝑜𝑙𝑚𝑎𝑟𝑐ℎ being the volume in marching cubes. Then, a result file in .xl format was 301
generated by using the Analysis 3D – Parameter plugin by (Boulos et al., 2013) listing several 302
parameters: volume in pixel, volume in marching cubes, surface with marching cubes. A 303
Granulometry-histogram plot was plotted using the total number of labeled particles as a 304
function of particle diameter as obtained from Eq. 1. Then, the sphericity of the particles was 305
computed using the following formula (nearly-spherical shapes approaching value 1): 306
307
sphericity = 6 × volmarch × √π surfacemarch⁄ 3 (2) 308
Where 𝑠𝑢𝑟𝑓𝑎𝑐𝑒𝑚𝑎𝑟𝑐ℎ is the surface with marching cubes as shown by (Boulos et al., 2013). 309
Furthermore, the porosity of the 3DP specimen was calculated by dividing summation of 310
resulting 𝑣𝑜𝑙𝑚𝑎𝑟𝑐ℎ values by the size of the reconstructed image multiplied by total number 311
of slices. Also, standard Kozeny–Carman equation (bundle of cylindrical capillaries model) 312
was used to calculate permeability k from the obtained average grain diameter and pore space 313
volume from the characterized µ-CT images by: 314 315 k = 𝜀𝑏𝑒𝑑3 𝑑𝑠2 180(1 − 𝜀𝑏𝑒𝑑)2 (3) 316
where 𝜀𝑏𝑒𝑑 is the average porosity of the µ-CT images of the 3DP specimen and 𝑑𝑠 is the 317
average diameter of the silica grains. 318
To go further, the pore connectivity Z and the geometric tortuosity τ of the 3D printed sand 320
mold specimens was also computed through an iterative-thinning algorithm (Median axis 321
algorithm) by using Skeletonize 3D and Analyze Skeleton plugins from ImageJ by (Ignacio 322
Arganda-Carreras et al., 2010) for all the 3DP specimens (SGLB, SGHB, BGLB, and BGHB). 323
The number of branches that originate from a junction (3, 4 and >4 branches) is termed as 324
pore connectivity, and the ratio between the regular and the Euclidean length of such branches 325
is termed as geometric tortuosity. A result window from the plugin displays the node-to-node 326
distances (di), Euclidian distances (𝑑𝑒𝑢𝑐𝑙𝑖𝑑), total number of junctions (𝑛𝑗), total number of
327
triple-branch junctions (𝑛𝑡), total number of quadruple-branch junctions (𝑛𝑞). Any junctions 328
above that is a high-order junctions (𝑛𝑥). It was shown earlier by (Hormann et al., 2016), that 329
the pore connectivity (Z) can be calculated from (𝑛𝑗), (𝑛𝑡), (𝑛𝑞), and (𝑛𝑥), using Eq. 4 and 330 Eq. 5: 331 𝑍 = 3𝑛𝑡 𝑛𝑗 + 4 𝑛𝑞 𝑛𝑗 + 5 𝑛𝑥 𝑛𝑗 (4) 𝑛𝑥 𝑛𝑗 = 1 − 𝑛𝑡 𝑛𝑗− 𝑛𝑞 𝑛𝑗 (5)
Where, 𝑛𝑡⁄ , 𝑛𝑛𝑗 𝑞⁄ , and 𝑛𝑛𝑗 𝑥⁄ provides the fraction of nodes connecting 3, 4 and >4 𝑛𝑗 332
branches respectively. 333
And the tortuosity was calculated as being the average ratio between node-to-node network 334
distances (di) and Euclidean distances (deuclid) as shown by (Ignacio Arganda-Carreras et al.,
335
2010) and (Hormann et al., 2016): 336 337 𝜏 =1 𝑛∑ 𝑑𝑖 𝑑𝑒𝑢𝑐𝑙𝑖𝑑 𝑛 𝑖=1 (6)
The results in terms of pore connectivity (Z) and tortuosity (τ) are provided in Table 2. It can 338
be observed that most junctions have 3 branches, a significant number of junctions have 4 339
branches and only a few present 5 or more branches. An average pore connectivity value of Z 340
≈ 3 is obtained. In this regard, (Sivarupan et al., 2018) showed in a previous work that the 341
speed at which the recoater spreads the sand particles on the job box platform affects the pore-342
connectivity, hence affecting the permeability. It can be deduced from the results displayed in 343
Table 2 that the size of the grain does not affect pore connectivity, in contrast to the case of 344
recoating speed. 345
Table 2. Results from median axis algorithm, showing the pore connectivity and tortuosity
346
Sample 𝐧𝐭⁄ 𝐧𝐣 𝐧𝐪⁄ 𝐧𝐣 𝐧𝐱⁄ 𝐧𝐣 Pore connectivity (Z) Tortuosity (τ)
SGHB 0.721 0.211 0.067 3.346 1.223
SGLB 0.703 0.243 0.052 3.348 1.221
BGHB 0.833 0.131 0.034 3.201 1.218
BGLB 0.773 0.176 0.049 3.275 1.225
347
2.3. Computational simulation of fluid flow in 3DP sand mold using Lattice Boltzmann
348
Method
349 350
A volume of 367×367×367 voxel (corresponding to 1835×1835×1835 µm3) was cropped 351
from the original reconstructed image with voxels of 53 µm3. The cropped image was then 352
binarized using the procedure presented in subsection 2.2.1. The porosity was then computed 353
by dividing the number of pore space voxels (white) by the total volume of the image stack. 354
The volume of the image being used as input to numerical simulations must be large enough 356
to produce a representative and statistically meaningful value of permeability for the 3DP 357
sand mold. While too big volumes would require a powerful and parallel computer clusters, 358
the Representative Volume Element (RVE) must lead to statistically meaningful results while 359
reducing computation time. Therefore, four different sizes of representative were selected 360
from the original cropped binary image: 200×200×200 voxel, 150×150×150 voxels 361
100×100×100 voxels and 50×50×50 voxels, as shown in Fig. 4, corresponding to 362
1000×1000×1000 µm3, 750×750×750 µm3, 500×500×500 µm3, and 250×250×250 µm3 363
volumes, respectively. These 4 cropped segmented stacks were then used as inputs to the 364
LBM numerical simulations performed with Lattice-Boltzmann Method (LBM) solver 365
PALABOS in order to determine the RVE for permeability calculation. The entire process 366
was repeated for all the binder content-grain size combinations listed in Table 1. 367
368
Fig. 4. Images of different dimensions used to determine the Representative Volume Element
370
(RVE) of the BGLB specimen. Pores are displayed in white and silica sand grains in black on 371
the binary image. 372
373
The numerical simulations were performed by using the open-source Lattice-Boltzmann 374
Method (LBM) solver PALABOS (Parallel Lattice Boltzmann Solver). LBM is highly 375
reliable and has been applied extensively as discussed by (Chopard B et al., 2002). (Heijs and 376
Lowe, 1995) used LBM to predict the permeability of a random array of spheres and clay soil, 377
and found that the predicted permeability is consistent with the experimentally measured 378
values. (Ferrol and Rothman, 1995) studied the numerical simulations of mass transport 379
through 3D tomographic images of Fontainebleau sandstone, and found that the LBM 380
simulations were similar as compared to the finite difference calculations and with the 381
laboratory experimental measurements. It was studied and verified earlier by (Auzerais et al., 382
1996) that X-ray micro computed tomography (µ-CT) along with LBM can be used for 383
modeling the fluid flow phenomena through complex porous geometries to study the 384
permeability. (Degruyter et al., 2010) combined X-ray µ-CT and LBM solver PALABOS to 385
perform numerical simulations of gas flow through volcanic pumices, and validated the 386
method by comparing the resulting data with the experimentally obtained values. Hence for 387
the present numerical simulation, LBM was used to predict the permeability of the additively 388
processed sand mold. 389
390
For the numerical simulation of mass transport through the 3D tomographic image of 3DP 391
specimen, a bounce-back boundary condition (no-slip boundary condition) was applied in 392
between the interfaces of pore space and silica sand grains. In PALABOS-LBM numerical 393
simulation, a D3Q19 lattice scheme is proposed as demonstrated earlier by (Hecht and 394
Harting, 2008). D3Q19 lattice describes the fluid flow in three dimensions with 19 possible 395
velocity vector directions, along with the zero velocity as shown by (Hecht and Harting, 396
2008) and (Ding and Xu, 2018). A standard Bhatnagar Gross-Krook (BGK) collision operator 397
was applied to the D3Q19 lattice scheme. A constant pressure gradient (∇P) was applied 398
through the porous medium, and the initial velocity within the interstices was set to zero. The 399
imposed values of ∇P were low enough to ensure creeping flow regime (Darcy flow). Non-400
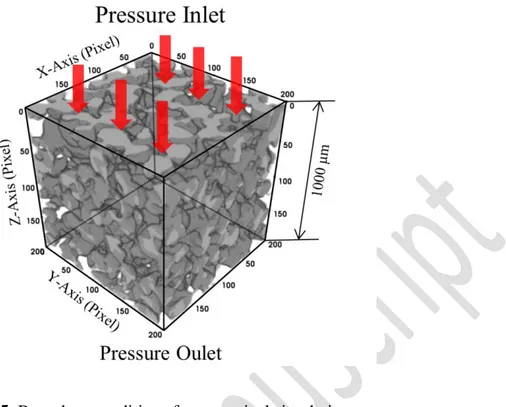
slip boundary conditions were applied and the lateral boundaries of the porous geometry 401
shown in Fig. 5. Permeability (k) was then measured on the non-dimensional lattice unit 402
system from the obtained pressure and velocity maps using Darcy’s equation: 403 404 −𝑑𝑃 𝑑𝑧 = 𝜇 k𝑣 (7) 405
where dP/dz is the pressure gradient along the main flow z-direction, µ is the dynamic 406
viscosity, 𝑣 is Darcy velocity and k is the permeability of the 3DP mold. The calculation 407
methodology used by PALABOS to measure the permeability of porous media involves in 408
solving a modified version of the actual Darcy’s equation. Here, Q/A is denoted by the term 𝑣, 409
which is the mean fluid velocity through the porous media or as stated earlier as Darcy’s 410
velocity. Q is the flow rate of fluid through a sample of cross section area A. 411
413
Fig. 5. Boundary conditions for numerical simulation
414 415
For the numerical simulation, the binary image was converted into a .DAT-file as needed by 416
PALABOS software to be able to read the entire porous 3D printed sand mold geometry 417
(along with labeled pores and grains), Fig 6. The DAT-file conversion procedure along with 418
the code for MATLAB was used from the tutorial as provided in the PALABOS website by 419
(Degruyter et al., 2010). The code allows for the separation between grains and pores, by 420
creating an interfacial boundary, as shown in Fig. 6(b). Then a constant pressure was imposed 421
at the inlet of the geometry. The bounce-back boundary condition was applied to the interface. 422
Fig. 6(c). shows an example of simulated velocity distribution over a 2D cross-section of an 423
X-ray µ-CT image. k was first obtained in non-dimensional lattice units and was then 424
converted to SI units by considering the squared resolution of the original µ-CT image. 425
427
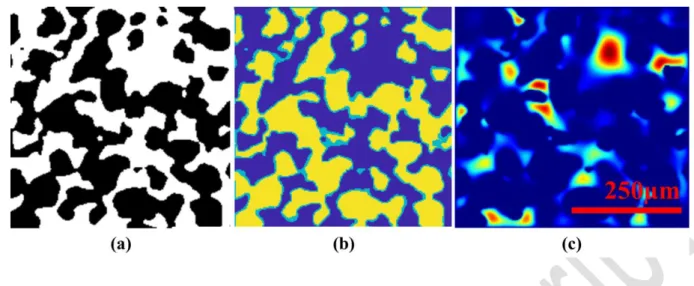
Fig. 6. Visualization of steps in conversion of a µ-CT image for velocity distribution
428
simulation in the case of the SGHB specimen (200 voxels): (a) 2D slice of the binary volume 429
and (b) converted image for simulation with pore space (dark blue pixel), grains (yellow 430
pixel) and grain boundary interface (light blue pixel) where the bounce-back boundary 431
condition is implemented. (c) Simulated velocity distribution through a cross-section. 432
433
2.4. Pore network extraction from micro-CT images: pore and throat size distributions
434 435
A PNM approach was followed in order to characterize the dimensions of the pore bodies and 436
constrictions of the 3DP molds, by using the images displayed in Fig. 7 as inputs. In the 437
present work, the pores and the throat networks were then extracted from the obtained X-ray 438
µ-CT of the 3DP specimens using the SNOW and GETNET algorithm as shown by (Gostick, 439
2017). This algorithm was previously implemented on various porous medium ranging from 440
fibrous mats to sandstone, for the extraction of pore and throat sizes, and predicting 441
permeability values. The open-source algorithm called as SubNetwork of the Oversegmented 442
Watershed (SNOW) as provided by (Gostick, 2017) was utilized in the current investigation 443
the extract the pore-network from the X-ray µ-CT images. The extracted pore and throat 444
diameters correspond to the diameter of the largest spheres that can be inscribed in a pore 445
body and a constriction, respectively. 446
447
The method for pore network extraction starts by using GETNET.py code as provided by 448
(Gostick, 2017), which extracts a conventional pore network from the provided µ-CT image 449
of voxel size 2003. As stated by (Gostick, 2017) the code works in 4 steps, first it extracts the 450
distance map of the pore space (distance transform), secondly a filter was used on the distance 451
map to smoothen the image and to remove the saddles and the plateaus, thirdly merging the 452
peaks that are too close to each other and then lastly assigning the pore space voxel to the 453
appropriate pores using a marker-based watershed algorithm. Recently, (Rodríguez de Castro 454
and Agnaou, 2019) have used the code to extract the pore and throat network of a sandy 455
porous structure. Similarly, for the present extraction, the X-ray µ-CT image of 3DP specimen 456
was first thresholded and then converted into an 8-bit file. Then, using the SNOW algorithm 457
in PYTHON, the X-ray µ-CT image is imported for further characterization. This import class 458
then extracts all the information of the provided µ-CT image, such as pore and throat sizes, 459
their locations and their network connectivity. All pore and throat properties are stored in 460
Numpy arrays, which can be easily accessible at later stage for generating the network. 461
463
Fig 7.X-ray µ-CT image for all specimens used for PNM, (a) SGLB, (b) SGHB, (c) BGLB 464
and (d) BGHB 465
Permeability is strongly related to the dimension of the pore constrictions (throats), as most 466
pressure loss is generated in these regions. (Bonnet et al., 2008) studied in detail the effect of 467
form, shape, or structure on flow law properties in metallic foams. On the other hand, 468
(Degruyter et al., 2009) and (Degruyter et al., 2010) showed that the tortuosity (τ), porosity (ε) 469
can be directly correlated according to Archie’s law (τ2= ε-m
). (Huang et al., 2015) also 470
studied the flow properties within a digital image of fibrous porous medium to predict the 471
permeability and validated the described model. (Degruyter et al., 2009) and (Degruyter et al., 472
2010) also developed a model to calculate k directly from the characteristic diameter of the 473
throats (dthroat) and Archie’s law:
474 475
𝑘 = ε md throat 2 32 (8) 476
The permeability was then calculated by using the average throat size provided by the 477
network model. 478
479
2.5. Experimental approach: Local porosity and permeability
480 481
A detailed review of experimental characterization for density, porosity and permeability 482
method was published recently by (Mitra et al., 2018) and (Mitra et al., 2019), so this section 483
contains only a short description of the method. The weight of the 3D printed specimens was 484
measured using a laboratory precision balance and the density of printed sample was 485
measured as mass divided by volume. The experimentally measured density of 3D printed 486
sand mold was ~1.3 g/cm3. The particle density is the density of silica sand with ~2.6 g/cm3. 487
From the measured density of 3DP specimen and silica sand density, the porosity of the 3D 488
printed samples was measured as, 489 490 𝑃𝑜𝑟𝑜𝑠𝑖𝑡𝑦 (%) = 1 − 𝐷𝑒𝑛𝑠𝑖𝑡𝑦𝑏𝑢𝑙𝑘 𝐷𝑒𝑛𝑠𝑖𝑡𝑦𝑠𝑖𝑙𝑖𝑐𝑎 (9) 491
The porosity values measured from experiments were close to 49-51% for all printed 492
specimens, with a standard deviation of 0.25%. Also, the permeability of the 3DP sand mold 493
samples was determined with a permeameter device (Simpson-Electrical), following the 494
recommendations of the American Foundry Society (AFS) and the same procedure presented 495
in previous works by (Coniglio et al., 2017), (Sivarupan et al., 2017), (Mitra et al., 2018) and 496
(Mitra et al., 2019). Therefore the entire procedure for the permeability experiment will not be 497
presented here. The initial dimensions of the 3D printed parts (cylinders) for experimental gas 498
permeability characterization were of 49.8 ± 0.01 mm in length and of 49.9 ± 0.02 mm in 499
diameter. The relationship for the measurement for gas permeability (GP) is expressed by the 500 following equation: 501 502 𝑮𝑷 = 𝑽 × 𝒉 𝑭 × 𝒑 × 𝒕 (10) 503
Where V denotes the air volume, h denotes the length of the cylindrical 3DP specimen, F 504
denotes the cross-sectional area of the 3DP specimen, p denotes the pressure and t denotes the 505
passage time for volume of air in minutes. An average permeability value of 5.57 × 10⁻¹¹ m2 506
or ~56.43 Darcy was measured for the small grain (SG) specimens, and 9.02 × 10⁻¹¹ m2 or 507
~91.39 Darcy for the big grain (BG) specimens. 508
509
3. Results and discussion
510 511
3.1. Grain size distribution and sphericity of silica particles
512 513
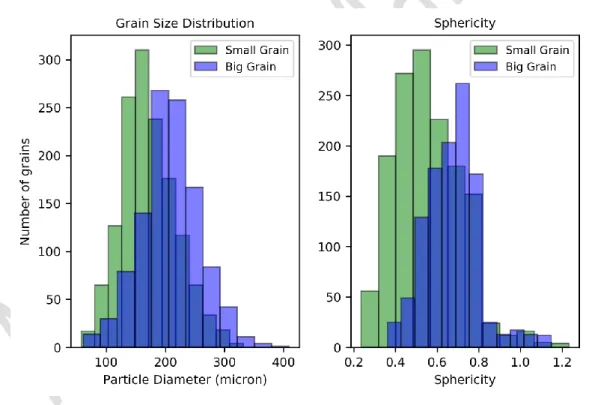
It is to be noted that since the binder was associated to the solid phase in the CT images, an 514
individual effect of the binder cannot be assessed and therefore the values for low binder and 515
high binder were merged together for the assessment, Fig. 8. The procedure presented in 516
subsection 2.2.2 was applied to all the segmented X-ray µ-CT images in order to obtain the 517
grain size and sphericity distributions of the silica particles. A normal distribution could be 518
observed for the grain size distribution. The extracted silica grain diameter d𝑔 for small grain 519
specimen varied from ~57 µm to ~331 µm, with mean d𝑔 of ~171.98 µm and the extracted d𝑔 520
for big grain specimen varied from ~61 µm to ~409 µm, with a mean grain diameter d𝑔 of 521
~208.05 µm. A more detailed report regarding the granulometry of the 3DP specimens is 522
provided in Table 3, showing the values for high and lower binder contents. GSD has a 523
profound effect on the permeability of the 3DP sand mold. It can be seen that for both small 524
and bigger grains, there is a similar narrow distribution of grain sizes, hence provides good 525
permeability for fabricated 3DP sand mold. Because sand grains with wide range has higher 526
compaction leading to high density and low permeability compared to the narrow distribution. 527
528
Fig. 8. Combined (a) grain size distribution for small grains and big grains, and (b) sphericity
529
distribution. 530
Also, the sphericity measured from the X-ray µ-CT image provides information about the 532
particle shape, which affects grain packing density, hence varying porosity and permeability. 533
We note the fact that grains with different shape might have identical sphericity values. The 534
results in terms of sphericity are listed in Table 3. It is observed that the sphericity values of 535
the bigger grain size specimens were higher than those of the small grain size specimens. 536
Some examples of extracted grains from the big grain specimens are shown in Fig. 9. It can be 537
noticed that the grains are far from being a perfect sphere, with an average sphericity value of 538
~0.6. As we discussed earlier the shape can be rounded, angular, sub-angular, however in the 539
present case, it can be observed that the grains are mostly sub-angular. All the results of the 540
sphericity of the specimens are shown as a histogram in Fig. 8. 541
542
543
Fig. 9. (a) Examples of silica grain with different sphericity number in the BG specimen. (b)
544
SEM image of a 3DP specimen, showing the silica grains. 545
546
From the obtained granulometry, using the porosity and mean grain diameter, the 547
permeability of the 3DP specimens were predicted with the Kozeny-Carman equation (Eq. 3) 548
as shown in Table 3. It is to be noted that since the binder was associated to the solid phase in 549
the CT images, an individual effect of the binder cannot be assessed and therefore the values 550
for low binder and high binder are very close. 551
552
Table 3. Results from image analysis
553 Sample Type Mean 𝐝𝒈 (µm) Mean Sphericity Mean porosity (%) Permeability (m2) Permeability (Darcy) SGLB 154.07 0.56 50.97 6.593 × 10⁻¹¹ 66.80 SGHB 156.85 0.55 49.37 6.182 × 10⁻¹¹ 62.63 BGLB 210.11 0.66 48.48 1.003 × 10⁻¹⁰ 101.62 BGHB 207.04 0.67 49.35 1.077 × 10⁻¹⁰ 109.12 554
3.2. Permeability of the printed samples as obtained from LBM numerical simulations
555 556
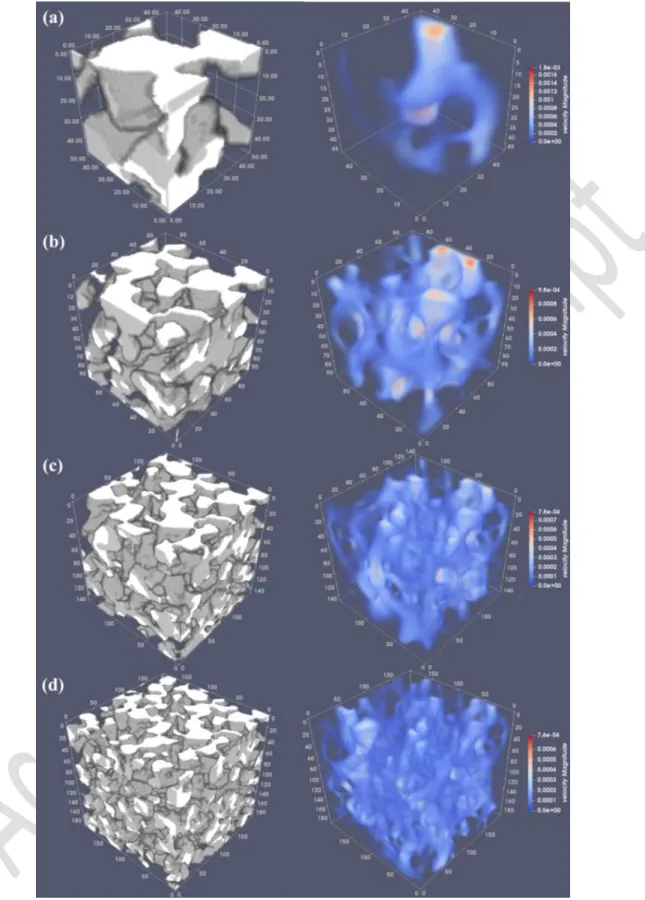
The steady-state velocity maps provided by the LBM simulations introduced in subsection 557
2.3., throughout the simulated specimens were represented using PARAVIEW software as 558
shown in Fig. 10. It can be deduced from this figure that the velocity distribution is not 559
uniform throughout the porous media, as expected due to the varying cross-section 560
dimensions of the interstices. The ratio between pressure difference (∆P) and the volumetric 561
flow rate was constant for all the tested values of ∆P, confirming creeping regime. Different 562
image sizes (503 voxel, 1003 voxel, 1503 voxel, and 2003 voxel) were used in the simulations 563
for the computation of k. Table 4 provides the permeability values for all the specimens as 564
provided by LBM solver PALABOS by using the modified Darcy’s equation (Eq. 7) as stated 565
earlier in section 2.3. Indeed, from Fig. 11, it can be observed that the permeability value for 566
50 voxel image is lower than that of 100 voxel, 150 voxel and 200 voxel image stack for all 567
the 3DP specimens. The permeability values approached a plateau value when the size of the 568
RVE was greater than 100 voxels. Therefore, it is suggested to use an input volume of 500 569
µm3, which corresponds to the size of 3 equivalent layers (3×190 µm or 3×140 µm) of silica 570
grains for 3DP specimens with average grain diameter of 140 µm and 190 µm. Bigger image 571
sizes would lead to higher simulation times without any significant improvement in accuracy. 572
574
Fig. 10. Velocity map in lattice units through specimens of, (a) 50, (b) 100, (c) 150, and (d)
575
200 voxel. (Warmer colors represent higher velocity) 576
Table 4. Results from permeability simulation 578 Image Size (voxel) Porosity (%) Permeability (m2) Permeability (Darcy)
Small Grain Low Binder (SGLB)
50 51 4.431 × 10⁻¹¹ 44.89
100 50 4.844 × 10⁻¹¹ 49.08
150 51 5.215 × 10⁻¹¹ 52.84
200 52 4.842 × 10⁻¹¹ 49.06
Small Grain High Binder (SGHB)
50 49 4.403 × 10⁻¹¹ 44.61
100 51 5.475 × 10⁻¹¹ 55.47
150 50 5.077 × 10⁻¹¹ 51.44
200 53 5.166 × 10⁻¹¹ 52.34
Big Grain Low Binder (BGLB)
50 49 3.889 × 10⁻¹¹ 39.41
100 51 8.801 × 10⁻¹¹ 89.17
150 49 8.788 × 10⁻¹¹ 89.04
200 52 9.092 × 10⁻¹¹ 92.12
Big Grain High Binder (BGHB)
50 49 4.171 × 10⁻¹¹ 42.26 100 52 9.157 × 10⁻¹¹ 92.78 150 53 9.027 × 10⁻¹¹ 91.46 200 53 9.189 × 10⁻¹¹ 93.11 579 580
581
Fig. 11. Effect of input geometry volume on the computed value of permeability
582 583
The computed results of permeability for 3DP specimen through PALABOS with different 584
grain and binder percent samples can be compared with the predicted analytical results and 585
image analysis results. The agreement is good between the analytical method, the image 586
analysis and the experimental results for all the 3DP specimens (SGLB, SGHB, BGLB, and 587
BGHB). The permeability calculations obtained with PALABOS are in good co-relation with 588
the experimental measurements performed with the 3DP specimen, as shown in Table 4. 589
Although it is of worth mentioning that an analytical permeability value of 4.9 × 10⁻¹¹ m2 (or) 590
~49 Darcy was calculated with Kozeny-Carmen equation (Eq 3), by using the average grain 591
size of 140 micron (as provided by the ExOne sand provider) and measured porosity of 49.2 592
%. And also a permeability of 9.071 × 10⁻¹¹ m2 (or) ~91 Darcy was calculated) with the 593
average grain size of 190 micron (as provided by the ExOne sand provider) and measured 594
porosity of 49.5 %. A deviation of permeability could be observed compared to analytical 595
permeability value as the prediction of Kozeny-Carmen is based on the particles being a 596
perfect sphere (the equation uses the mean diameter, ds), whereas in the present scenario the 597
particle is close to being a perfect sphere (average sphericity = 0.65). The analytically 598
predicted permeability value using Kozeny-Carmen equation worked as a reference for the 599
permeability measurements. It can be observed from the table that, it is possible to predict the 600
absolute permeability of 3DP sand mold using the non-destructive LBM simulation and is a 601
very strong method for mass flow simulation in complex 3D printed sand mold. 602
603
3.3. Pores and Throats Size Distributions of the 3D printed samples as provided by
pore-604
network modeling
605 606
PNM provides a reasonable prediction of mass transport properties at pore scale and offers the 607
flexibility of characterizing macroscopic properties relationship of 3DP sand mold with pore 608
structure. With PNM, the complex pore structure of a 3DP sand mold can be represented by a 609
network of pores (pore spaces) and connected throats (narrow paths that connect pores) with 610
simplified geometries. A pore network modeling aims at better representation of pore and 611
throat interconnectivity in a porous medium like 3DP sand mold. All the pore network 612
extractions for different specimens (SGLB, SGHB, BGLB, BGHB) were performed over a µ-613
CT image size of 2003 voxel with a resolution of 5 µm per voxel, and are represented in Fig. 614
12. 615 616
617
Fig. 12. Extracted pore network for (a) SGLB, (b) SGHB, (c) BGLB and (d) BGHB
618
specimens. 619
620
The pore-size distributions (PSDs) in terms of pore diameter were extracted from the 621
generated pore network and are represented as a histogram, Fig. 13. The extracted pore 622
diameter for SGLB specimen varied from ~19 µm to ~226 µm, with a mean pore diameter of 623
~105.84 µm and the extracted pore diameter for SGHB specimen varied from ~14 µm to ~220 624
µm, with a mean pore diameter of 108.05 µm. Similarly, the extracted pore diameter for 625
BGLB specimen varied from ~16 µm to ~350 µm, with a mean pore diameter of 108.07 µm 626
and the extracted pore diameter for BGHB specimen varied from ~18 µm to ~320 µm, with a 627
mean pore diameter of ~108.31 µm. Although previous work by (Glover and Walker, 2009) 628
showed that the grain size and pore radius are functionally interdependent, it can be observed 629
that the average pore diameters are very similar for all the specimens (both SG and BG) in the 630
currently investigated samples. However, careful observation of Fig. 13 shows that the 631
standard deviation of the PSD is considerably higher for the big sand grains samples (± 55.9 632
µm for BGLB and ± 56.1 µm for BGHB) as compared to the small sand grains samples (± 633
37.3 µm for SGLB and ± 38.7 µm for SGHB). Consequently, the size of the biggest pores in 634
the big grain samples is much higher than for the small grain samples, even if the average 635
pore size is close in both cases. This can be also observed in the red-colored pores of Fig. 12 636
(approximately 350 micrometers of big grains and 230 for small grains) and in the PSDs 637
provided in Figure 13. 638
639
640
Fig. 13. Combined (high binder +low binder) pore size and throat size distribution for (a)
641
small grains and (b) big grains. 642
643
The throat-size distributions (TSDs) in diameter were also extracted from the generated throat 644
network and were then represented as a cumulative histogram with the throat diameter, Fig. 645
13. The extracted throat diameter for SGLB specimen varied from ~5 µm to ~140 µm, with a 646
mean throat diameter of 38.66 µm and the extracted throat diameter for SGHB specimen 647
varied from ~5 µm to ~146 µm, with a mean throat diameter of 44.43 µm. Similarly, the 648
extracted throat diameter for BGLB specimen varied from ~5 µm to ~214 µm, with a mean 649
throat diameter of 56.92 µm and the extracted throat diameter for BGHB specimen varied 650
from ~5 µm to ~220 µm, with a mean throat diameter of 58.42 µm. It can be depicted from 651
the distribution that, the peak values for both cases appear to be near low pore sizes, which 652
defines the microstructure complexity. It can also be observed for big grain specimens that the 653
throats and pores overlap with each other, which suggests that there exist some small pores, 654
which are of similar size as that of the throats. Moreover, the distribution of throat size for all 655
the specimens shows a right-skewed distribution, along with a quantitatively great portion of 656
the small size throats (peak throat size smaller than average), which construct minor flow 657
paths. 658
659
Table 5. Results from pore network modeling
660 Sample Type Mean Pore Diameter (µm) Mean Throat Diameter (µm) Permeability (m2) Permeability (Darcy) SGLB 105.84 38.66 3.138 × 10⁻¹¹ 31.79 SGHB 108.05 44.43 4.144 × 10⁻¹¹ 41.98 BGLB 108.07 56.92 6.915 × 10⁻¹¹ 70.06 BGHB 108.31 58.42 7.165 × 10⁻¹¹ 72.59
661
From the obtained average equivalent throat diameter and tortuosity, permeability was 662
calculated using the equation described in the previous section, Eq. 8, and the results are 663
presented in Table 5. It can be observed from the results that no significant differences in 664
terms of permeability (k) were obtained for small grain samples with different binder content 665
along with big grain samples with different binder content, as the furan resin binder was only 666
associated to the solid phase in the µ-CT images. An individual effect of the binder over pore 667
network structure cannot be assessed and therefore the values for pore and throat diameter for 668
samples with low binder and high binder are very close. 669
670
4. Model efficiency
671 672
One of the challenges in foundry is the lack of methods for proper non-destructive 673
characterization of the local permeability of the 3DP sand mold. The X-ray µCT technique 674
overcomes this challenge and allows a non-destructive visualization and characterization of 675
internal volume and the external surface of a sand mold. This paper, for the first time, fully 676
characterizes the intrinsic physical parameters of 3DP sand mold including grain structure, 677
porosity, pore connectivity, tortuosity, pore size distribution, throat size distribution and local 678
density. Table. 6 shows the cumulative results of permeability as obtained by different 679
methods (from traditional experiment, from GSD, from LBM and from PNM). The 680
permeability value using the GSD method overpredicts the permeability value as obtained 681
with the traditional experiments. Indeed, the permeability value from GSD using Kozeny-682
Carman equation is based on the particles being a perfect sphere (the equation uses the mean 683
particle diameter, ds), whereas in the present scenario the particle is close to being a perfect 684
sphere (average sphericity = 0.65). However, the permeability value obtained with GSD using 685
Kozeny-Carman equation can still be considered as a reference for other models. 686
687
Moreover, the permeability values yielded by LBM simulations were found to be close to the 688
results provided by traditional tests. Nevertheless, LBM requires much computational power 689
for larger µ-CT images, hence this method can be time consuming. Therefore, it was crucial 690
to identify the optimum RVE not only to predict reliable permeability values but also to 691
reduce simulation times. An alternative approach to predict permeability from pore-network 692
modelling (PNM) is proposed. Pores are the relatively wide portions of the interstices and 693
throats are the relatively narrow portions that separate the pore bodies. The pores and throats 694
space of a 3D printed sand mold can be extracted from the segmented 3D µ-CT image. As can 695
be observed from Table 6, significant differences are reported in some cases between the 696
results of traditional experiments and PNM, while the agreement is better between traditional 697
tests and GSD and LBM. Nevertheless, as compared to LBM simulations, PNM require less 698
computational power due to the simplifications of the void-space geometry and topology 699
when constructing the pore network model. The computational time needed for the extraction 700
of the pore and throat network on a computer with Intel Xeon processor and 16 GB of 701
memory is in the order of minutes, whereas using LBM computation takes hours. This allows 702
the computation of permeability over larger sampling volumes. However, it should be noted 703
that the computational time can be significantly reduced by using a more powerful and 704
expensive supercomputer. (Chauveteau et al., 1996) showed that for unconsolidated porous 705
media where pore throats are much smaller than pore bodies, the viscous dissipation can be 706
considered as being localized only in pore throats. This approximation is quite acceptable in 707
many cases, since the pore body-to-pore throat radius is generally quite large, varying from 708
values around 3 for random monosized sphere packs, to around 5 for random packs of sharp-709
edged grains with a narrow size distribution. However, in the case of the highly-porous 3DP 710
sand molds investigated in the present work, the pore-to-throat size ratios range from ~1.7 to 711
~2.7 (Table 5). Therefore, the PNM-based estimation obtained with Eq. 8, in which viscous 712
dissipation is assumed to be localized only in pore throats, is not expected to be highly 713
accurate, but is still useful to provide a lower permeability bound. Hence, PNM approach can 714
be a reasonable alternative to the traditional experimental, LBM and GSD methods as it takes 715
into account of the microstructural features of the 3DP sand mold and can also easily deal 716
with any kind of complex geometry. 717
718
Table 6. Permeability measured with different methods
719
Sample Traditional experiment (Darcy) GSD (Darcy) LBM using 100 voxel (Darcy) PNM (Darcy) SGLB 56.4 66.8 49 31.79 SGHB 58.9 62.6 55.4 41.98 BGLB 91.3 101.6 89.1 70.06 BGHB 93.2 109.1 92.7 72.59 720
Permeability, porosity, tortuosity grain size distribution, pore size distribution, average pore 721
diameter, throat size distribution, and average throat diameter are essential inputs when 722
predicting gas flow in 3DP molds. It is to be noted that complex porous media like 3DP sand 723
mold have anisotropic properties (mechanical and mass transport) due to variation in printing 724
process parameters. For the present study, only the variation of furan resin binder droplet 725
resolution on silica sand powder bed is studied (different binder percentage) along with 726
different silica grain size, as this affects the properties of complex porous resin bonded 3DP 727
mold with the recoater speed. The present modeling approaches are advantageous on the 728
prediction of the flow permeability of such complex porous structure like 3DP sand mold 729
directly from the from X-Ray µ-CT digital images. This would help the foundry industry to 730
accurately measure the mass transport properties as required as an input for numerical 731
simulations (solidification and filling), to study the effect of printing process parameters 732
(printing speed, binder percentage, grain size, etc.) and thermal degradation of furan resin 733
binder during metal casting. Therefore, the present approaches of merging permeability 734
measurements on 3DP sand mold specimens with extraction of throat and pore network 735
structure using for X-ray µ-CT helped in exploring and better understanding the pore 736
construction and its pivotal role on mass flow phenomenon. It also helped us in developing 737
and validating reliable models for non-destructive prediction of gas permeability, which are 738
favorable for carrying out precise risk assessments of harmful toxic pollutants produced 739
during metal casting in foundry industry. 740
741
5. Conclusion
742 743
Permeability is one of the most important factors affecting the generation of gas defects 744
during metal casting, so it is of major importance to characterize it. In this work, the 745
advantage of the application of X-ray µ-CT (NDT), Pore Network Modelling methods and 746
Lattice Boltzmann Method in exploring the mass transport properties of additively processed 747
silica sand mold was demonstrated. X-ray µ-CT images were used to compute the porosity, 748
pore size, throat size and the permeability of the 3D printed specimens for different binder 749
contents and grain sizes, using analytical and numerical methods. The permeability predicted 750
in the steady-state was compared with experimental and analytical measurements for layered 751
silica grain arrangement. A major advantage of using X-ray CT characterization is the non-752
destructive nature of the tests. The computed permeability can be used as input to numerical 753
simulations of metal casting allowing the prediction of macroscopic defects. The following 754
scientific and industrial implications are drawn from the present work: 755
756
The permeability values predicted with LBM from X-ray µ-CT image of 3DP specimen 757
are in good agreement with the traditional experimental measurements. 758
759
The proposed non-destructive X-ray µ-CT technique is an effective and reliable 760
alternative to traditional laboratory experiments for permeability characterization of 761
additively processed sand molds. The good agreement between the analytical model, 762
traditional experimental estimations and the proposed method based on CT data validates 763
this approach. 764
765
An RVE of 100×100×100 voxel corresponding to 500×500×500 µm3 is suggested for a 766
faster and reliable permeability simulation. 767
768
The characterization of the 3D printed specimen was performed by using available open-769
source software such as ImageJ, Palabos, and OpenPNM and therefore the proposed 770
approach may be used in a broad range of academic or research applications. 771
772
The permeability value predicted using pore network modeling can be a reasonable 773
alternative as it takes into account of the microstructural features of the 3DP sand mold. 774