Science Arts & Métiers (SAM)
is an open access repository that collects the work of Arts et Métiers Institute of
Technology researchers and makes it freely available over the web where possible.
This is an author-deposited version published in:
https://sam.ensam.eu
Handle ID: .
http://hdl.handle.net/10985/13276
To cite this version :
N ABBASNEZHAD, Alireza KHAVANDI, JOSEPH FITOUSSI, H ARABI, M SHIRINBAYAN, Abbas
TCHARKHTCHI - Influence of loading conditions on the overall mechanical behavior of
polyether-ether-ketone (PEEK) - International Journal of Fatigue - Vol. 109, p.83-92 - 2018
Any correspondence concerning this service should be sent to the repository
In
fluence of loading conditions on the overall mechanical behavior of
polyether-ether-ketone (PEEK)
N. Abbasnezhad
a,b,⁎, A. Khavandi
b, J. Fitoussi
a, H. Arabi
b, M. Shirinbayan
a, A. Tcharkhtchi
a aArts et Métiers ParisTech, PIMM– UMR CNRS 8006, 151 Boulevard de l’Hôpital, 75013 Paris, FrancebSchool of Metallurgy and Materials Engineering, Iran University of Science and Technology (IUST), Narmak, Tehran, Iran
A R T I C L E I N F O
Keywords: PEEK
High strain rate tensile tests Fatigue
Energy
A B S T R A C T
Testing methods have been developed to compare the mechanical responses and failure behavior of polyether-ether-keton (PEEK) thermoplastic polymer; under quasi-static, high strain rate tensile tests and fatigue loading. Tensile tests were performed with the strain rates varying from 0.0003 s−1to 60 s−1and at different tem-peratures to compare theflow characteristics of the samples undergone various testing conditions. Fatigue tests at different amplitudes and frequencies were also performed to evaluate the temperature rise during cyclic loading and its effect on the fracture behavior. Results show that dynamic tension, in comparison with quasi-static behavior, causes brittle fracture; whereas under fatigue test at high frequencies and loading amplitudes the material behaves not only a more ductile behavior but also it clearly shows the influences of induced self-heating in the modulus and mechanical properties of the PEEK were significant. So the major aim of this article is to discuss about the induced temperature and its effect on the fracture surface. Thermal fatigue has a very sig-nificant role in increasing temperature and reducing fatigue life; from there it is necessary to know the condi-tions at which thermal fatigue happens and also the amount of energy which is consumed. Obtained equation from the experimental results and calculations can estimate the energy dissipation in the fatigue tests which is as a function of cycle and frequency.
1. Introduction
Polymeric materials have been used broadly in engineering appli-cations due to their light weight. They are exposed to dynamic loading and high strain rate deformation in a variety of important applications such as aircraft and automotive components, as well as during high-speed processes such as extrusion and blow molding [1]. Aircraft manufacturers plan to use linear aromatic polymers such as PEEK or as matrices of carbon fibers reinforced composite materials because of their high thermomechanical performances [2]. PEEK is a novel polymer with potential advantages for its use in demanding orthopedic applications (e.g. intervertebral cages) and it is considered to be one of the most important engineering polymers due to its properties such as: high mechanical strength, thermal stability (beyond 300 °C) and che-mical resistance in corrosive environments[3]. Therefore, the influence of a physiological environment on the mechanical stability of PEEK is more requesting [4]. In addition, PEEK is a thermoplastic which is considered as a high-performance biomaterial[5].
Strain rate and temperature are two parameters that considerably influence the mechanical behavior of polymers[6]. Since the beginning
of polymer science, numerous experimental studies have been carried out on polymers to characterize the mechanical behavior as a function of temperature and strain rate. Among these studies, a great deal of attention has been given to the yield stress[7]. Thefirst work on the high speed response of plastics is due to Kolsky[8]in which he iden-tified the importance of sample thickness on the measured response of the polymers. Walley et al.[7]accumulated reviews on the high strain rate studies of polymers, and they also expressed that the strain hard-ening behavior of glassy polymers is dependent on the strain rate and temperature.
Chou et al.[9]analyzed the compressive behavior of several plastics and concluded that the temperature rise induced during deformation cannot be disregarded. They also detected that the yield strength in-creases with increasing strain rate. Similar results for theflow stress were also found by Briscoe and Nosker[10].
While numerous studies have investigated the influence of strain rate on the constitutive response for several polymers at room tem-perature, the influence of temperature at high strain rate has received much less attention. Among these studies, Rietsch and Bouette [11]
studied the compression yield stress of PC over a wide variety of
⁎Corresponding author at: Arts et Métiers ParisTech, PIMM– UMR CNRS 8006, 151 Boulevard de l’Hôpital, 75013 Paris, France.
E-mail addresses:[email protected](N. Abbasnezhad),[email protected](A. Khavandi),joseph.fi[email protected](J. Fitoussi),[email protected](H. Arabi), [email protected](M. Shirinbayan),[email protected](A. Tcharkhtchi).
temperatures and strain rates, and exposed the importance of the sec-ondary transition to account for theflow stress increases.
Cady et al. [12] studied the mechanical response of PEEK and Polyamide-imides (PAI) under dynamic loading at high temperatures. Results of their study which have been conducted at strain rate of 0.001 s−1and a temperature up to 125 °C showed a relatively constant apparent loading modulus occurs for PEEK material under the men-tioned conditions. At higher temperatures, between 125 °C and 150 °C, the apparent loading modulus begins to gradually decrease and above 150 °C the modulus drops significantly. Similar behavior is seen at a strain rate of 1 s−1where the apparent loading modulus had a drop from∼ 3.1 GPa at 22 °C to ∼550 MPa at 175 °C. The compressive stress–strain response of PAI and PEEK were found to be depended on both the applied strain rate 0.001 s−1≤ έ ≤ 3000 s−1, and the test temperature −55 °C ≤ T ≤ 300 °C, the apparent loading modulus of both materials drops dramatically above the glass transition tempera-ture[12].
High-strain rate studies on PEEK by Hamdan and Swallowe[13]
showed that: (a) the yield strength increases by increasing strain rate or decreasing temperature, (b) theflow stress characteristics are related to the amount of crystallinity, and (c) samples held at temperatures above Tgfor long periods of time can show an increase in strength. A linear
relationship between the compressive yield stress and logarithm of the strain rate has been observed for a large number of polymers[14]. This observation supports the concept that a single deformation rate theory appears adequate to describe the plastic response of many polymers over a wide variety of imposed strain rates[14].
Testing at temperatures above Tg on thermoplastics and other
polymers has shown that both the loading modulus and peakflow stress decrease with increasing temperature[12].
In a study by Rakish Shrestha et al.[15]about strain effect on
fa-tigue behavior it can be observed that, the size of the crack initiation site in PEEK specimens generally decreased with increase in strain ratio, but not significantly. The crack initiation sites were observed to be subsurface, which is due to presence of a larger inclusion (particles or void-like defects). Furthermore, specimens with void-like defects, ser-ving as the source of crack initiation, were found to have shorter fatigue lives as compared to the specimens containing particles of similar size. When polymers are subjected to cyclic behavior a part of the energy which has been given to perform fatigue test, dissipates as thermal and mechanical energy, and because of low thermal conductivity this en-ergy accumulates in the polymer and reduces the life time of the polymer. Thermal energy which is known as self-heating causes tem-perature increase and stabilized after some cycles. Having fracture while increasing the temperature is called thermal fracture, but if it is in the stabilized temperature it is controlled by crack initiation and pro-pagation which is called mechanical fracture.
In this paper, an experimental study is carried-out to investigate the influence of loading conditions on the overall mechanical behavior of a PEEK. As mentioned, this polymer is a high performance thermoplastic material having good combination of properties such as: high melting temperature, high toughness, low moisture absorption, high fatigue capabilities, good resistance to dynamic cycles, suitable hydrolytic stability and high thermal properties [16]. The organization of this work is as follow: after a presentation of the main physical–chemical characteristics and microstructure of PEEK, the results of the quasi static and high strain rate tensile tests up to failure are presented. Furthermore, fatigue tests with SEM fractography analysis emphasize the effect of loading conditions and a special attention is given to the analysis of the temperature rise.
2. Material description and methods
2.1. Polyether-ether-ketone (PEEK)
The material used in this study was plates of a PEEK grade 90G
supplied by Victrex, unreinforced PEEK in the form of semi crystalline granules, is suitable for injection molding, and can easilyflow under suitable conditions. It has complex geometries with thinner cross sec-tions or longerflow lengths for high strength and stiffness as well as good ductility. Its cross-linking mechanism is also shown inFig. 1.
2.1.1. Specimen geometry
An optimum geometry has been chosen in order to get a good quality of high speed tensile tests. Indeed, geometrical parameters were considered in order to reduce the stress wave perturbations due to in-ertial effects during high speed loading. In this work, all mechanical characterizations have been performed on the ISO-527-2-5A specimen geometry (seeFig. 2). In fact, its small dimension of the active length allows generating homogeneous stress/strainfield from the early stages of the high strain rate tensile tests.
2.2. Methods
2.2.1. Physical-chemical characterization
•
Microscopic observations: Scanning Electronic Microscope (HITACHI 4800 SEM), was used to investigate qualitatively the material microstructure and especially the fractured surfaces of the tensile specimens.•
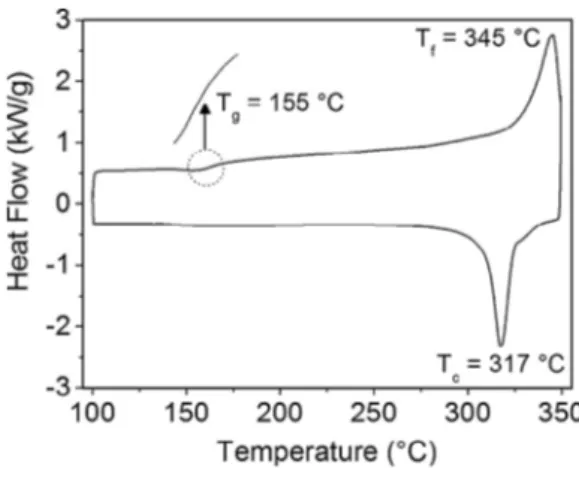
DSC analysis: DSC Q10 V9.0 was utilized tofind out the tempera-ture revolution near the glassy temperatempera-ture up to the melting point. The sample used, was 6.2 mg which wasfirst heated from 100 °C up to 350 °C; from this temperature, it was then cooled to 100 °C, al-ways with the rate of 2 °C/min.•
DMA analysis: Dynamic mechanical analysis (DMA) testing was performed using a Q800 V21.2 Dynamic Mechanical Analyzer. Rectangular PEEK specimens with approximate dimensions of 25 × 4 × 3 mm3were tested over the entire temperature range ofthe DMA instrument from 100 °C to 300 °C at 1 Hz with constant amplitude. The storage modulus and loss modulus were measured as a function of temperature, and the corresponding parameter was calculated.
2.2.2. Mechanical characterization
•
Quasi static tensile tests: Quasi static tensile tests by velocity of 2 mm/min were performed with an Instron 5881 machine in the low and high temperatures to see the effects of strain rate and tem-perature on mechanical behavior.Fig. 1. PEEK cross-linking mechanism.
•
High-speed tensile tests: High-speed tensile tests were performed in a servo-hydraulic test machine. As specified by the manufacturer (Schenk Hydropuls VHS 5020), the test machine can reach a crosshead speed range from 10−4m/s (quasi-static) to 20 m/s. Moreover, the load level was measured by a piezoelectric crystal load cell having a capacity of a 50 KN. High-strain rate tensile tests were performed at different strain-rates until the polymer specimen failure. The testing machine was equipped with a launching system. The specimen was positioned between the load cell (upper ex-tremity) and the moving device (lower exex-tremity) as sketched inFig. 3. A contactless technique was used to measure the local de-formation using a high speed camera (FASTCAM-APX RS).
•
Fatigue test: Tension-tension fatigue tests were performed at dif-ferent applied maximum stress on MTS 830 hydraulic fatigue ma-chine. The minimum applied stress was always chosen to be equal to 10% of the maximum applied stress. In this paper, the results of experiments performed at different frequencies and different am-plitudes at the constant temperature of 23 °C have been presented. In order to measure precisely the stiffness reduction due to the first loading stage, each fatigue test was preceded by a quasi-static ten-sile loading–unloading-reloading stage. Fig. 4 shows the loa-ding–unloading-reloading and cyclic loading stages before cyclic loading.During cyclic loading, the temperature rise (due to self-heating) was measured using an infrared camera (Raynger-MX4) in specific area (maximum temperature).
3. Experimental results and discussion
3.1. Physical-chemical characterization
3.1.1. DSC analysis
DSC was used to investigate the response of PEEK as temperature variations. The result presented inFig. 5shows PEEK grade 90 has a glass transition temperature of 155 °C, crystallization temperature of 317 °C and melting point about 345 °C.
3.1.2. Dynamic mechanical analysis
DMA results (Fig. 6) show that the increasing temperature, in the zone of glassy state, until 135 °C has no significant effect on the storage modulus; whereas from this temperature it sharply decreases. The glass transition is relatively large from 130 °C to 180 °C. The value of α transition temperature is equal to 155 °C.
3.2. Tensile behavior of PEEK
3.2.1. Effect of temperature
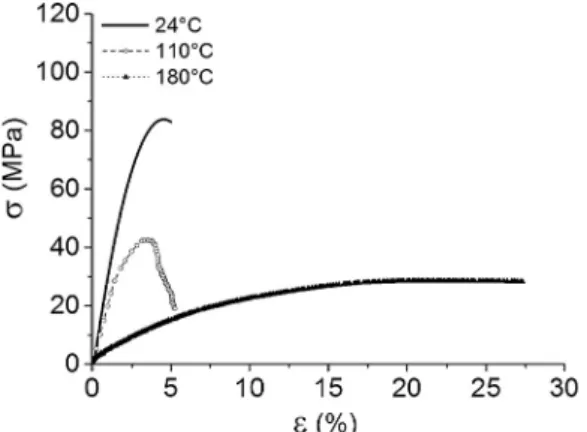
In order to show the effect of temperature on the mechanical properties of PEEK, tensile tests were conducted at three different temperatures; environment temperature, below and above glass tran-sition temperature. The results have been presented in (Fig. 7) and
Table 1. For PEEK samples, the effect of temperature on Young’s modulus as well as on yield stress and strain at break was significant. Variation of the temperature from 24 °C to 180 °C, lead to an abrupt decrease of the Young’s modulus from 3600 MPa to 280 MPa (nearly 12 times), while stress at break decreased by 65%. This effect on strain at break is non-significant up to 110 °C but strain at break increased by 450% at 180 °C when the amorphous region of the polymer is at rub-bery state. In this state the molecular mobility in the structure of the
Fig. 3. Experimental device used for high-speed tensile tests.
Fig. 4. Loading-unloading–reloading stages before cyclic loading.
Fig. 5. DSC results for PEEK.
polymer is very high and the polymer shows ductile behavior however at 110 °C the polymer is always in glassy state and its failure was characterized as a quasi-brittle failure.
3.2.2. Effects of strain-rate on the material characteristics The stress–strain curves illustrate three stages: (i) Linear elastic behavior,
(ii) Damage initiation corresponding to a knee point (apparition of a non-linear behavior),
(iii) Damage propagation corresponding to a second quasi-linear stage and failure.
These stages are different for medium and high strain rate tensile tests. Stress–strain (σ-ε) tensile curves plotted for several strain rates are presented inFig. 8. For each strain rate about 5 samples were tested and the stress–strain curves obtained for each strain rate were covered by the repeated tests especially for low strain rates (Fig. 8). For high strain rate tensile test also some tests were conducted. Here although there are differences at the values of failure strain but it is not very significant and it may occur due to existence of some faults like inclusions or hollows, so the highest strain at break can well express the polymer’s behavior under high strain rate tensile test.
Tensile curves inFig. 9(a) clearly indicate that the overall behavior of PEEK was influenced by loading-rate. Indeed, under rapid tensile loading (i.e. 60 s−1), PEEK exhibit with the high yield point and ma-terial failure happened rapidly after thefirst stage. Comparing the curve of quasi-static with high strain rates it can be notice that by increasing strain rate a delay in commencing the second stage (delay of the knee-point) and ultimate stress appeared.
One can note that inFig. 9(b) by increasing strain rate from quasi-static to 60 s−1failure strain decreases about 75% which is an indica-tion that the material alters from viscous behavior to a brittle one.
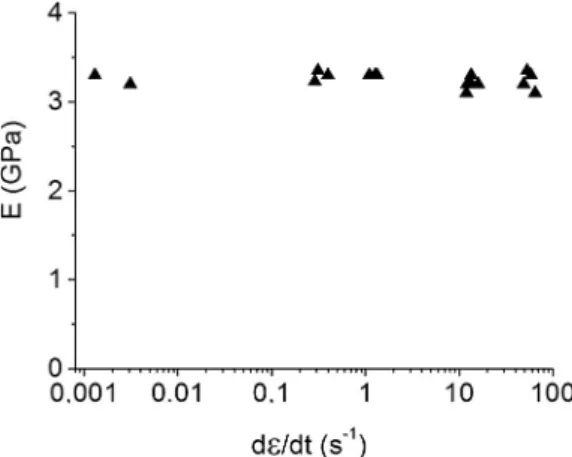
Material characteristics, namely Young’s modulus (E), damage thresholds corresponding to thefirst non-linearity (σthreshold;εthreshold)
and ultimate stress and strain (σultimate;εultimate) as a function of strain
rate are shown inFigs. 10 and 11. Note that the ultimate characteristics correspond to the maximum stress level.Fig. 10enables us to empha-size that the material elastic modulus measured in thefirst stage of the stress–strain curve remains insensitive to the strain rate.
It is noticeable from theFig. 11(a) and (b) that damage threshold in term of stress and strain increase by increasing strain rate.Fig. 11(c) shows that by increasing strain rate from quasi-static to 60 s−1 max-imum stress is increased about 20% whereas threshold stress is in-creased about 100% and PEEK behave like a brittle polymer in high strain rates.
3.2.3. Fracture surface observation after tensile tests
Fig. 12(a) shows clearly the effect of cooling rate on the morphology of the polymer. As it can be seen a thin layer (skin) is formed at the surface of the sample because of high cooling rate. The morphology of this region is different from internal part of the specimen; it is more amorphous. It is not so clear on the picture but the reality is that the spherolits have more important diameter in internal part of the sample; the degree of crystallinity of the polymer in this region is higher. This difference of morphology gives the sample a non-isotropic behavior. The skin part of the specimen is more ductile as was shown in
Fig. 12(b).
Fig. 12(b) shows enormous amount of plasticflow of the polymer prior tofinal failure in the quasi static tensile test. Besides the polymer bonding after tensile test was stretched compared to the virgin material and caused formation of gaps between the bonds which makes it easy to failure[2,17].
Besides, the effect of loading rate on the failure behavior of the polymer must not be neglected. Comparing the curves presented in
Fig. 9(a), and the macroscopic images of the fractured samples pre-sented inFig. 13, one can notice that as the strain rate increased failure mode changed from quasi-ductile to brittle and the failure of the sample subjected to high strain rate tensile test was accompanied by frag-mentation.
In order to emphasize on the change of fracture mode (i.e. the ductile and brittle fracture), fracture surfaces of the samples were in-vestigated also at microscopic scale. Micrographs presented inFig. 14
show the microscopic surfaces obtained from the unloaded sample and the fractured surface of the sample after quasi-static tensile test and also after high strain rate tensile test (60 s−1). These micrographs indicate that in contrary to quasi-static loading, high strain rate loading lead to a more brittle fracture.
By comparingFig. 14(b) & (c), one can observe that there is a large amount of crack initiation and plastic deformations which is occurred inFig. 14(b). The distances between the river like features increased by increasing the strain rate and changes of fracture mode to brittle, so that the cracks were aligned in the same direction.
3.3. Fatigue behavior of PEEK
3.3.1. Wöhler curve
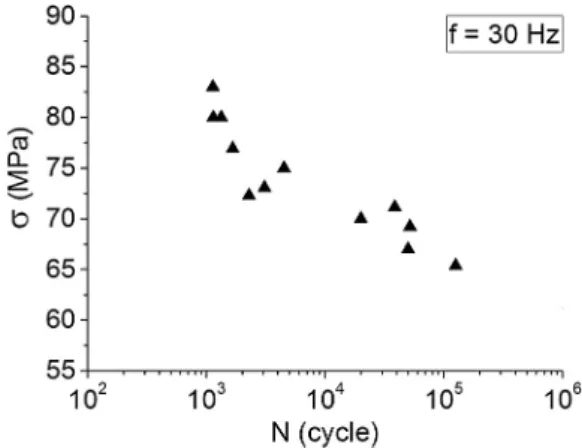
Fig. 15shows the Wöhler curve obtained in tension–tension mode of stress-controlled fatigue tests at a frequency of 30 Hz for PEEK samples.
Fig. 7. Tensile response of PEEK samples at 24 °C, 110 °C and 180 °C at 2 mm/min.
Table 1
Mechanical characters at different temperatures.
E (MPa) σmax(MPa) ɛr(%)
24 °C 3600 83 5
110 °C 2100 42 5.3
180 °C 280 28 27.5
It can be noticed that for an applied stress equal to 65 MPa, the fatigue life is about 1.5 × 10⁵cycles whereas the fatigue life is about 103cycles
for an applied stress of 85 MPa. This indicates that a variation of 23% stress can result to a fatigue life about 100 times higher. It is depicted in
Fig. 15that a decrease in the life time is very significant above stresses of 70 MPa.
3.3.2. Effect of loading amplitude
Depending on the loading conditions in terms of frequency and amplitude, the fatigue behavior can be in such a way that induces self-heating[18]. It has been reported[19]that high frequency and applied stress can lead to an increase of the self-heating phenomenon and cause an “Induced Thermal Fatigue” (ITF). For low frequency, the fatigue behavior is mainly driven by the damage mechanisms occurring at the microscopic scale such as micro-cracking of the polymer. This kind of phenomenon has been introduced as“Mechanical Fatigue” (MF)[20]. Coupled effect of loading amplitude and frequency can lead to a competition between induced self-heating and damage phenomenon
[21]. In order to illustrate the effect of loading amplitude and fre-quency, different loading amplitude at the same frequency and different frequencies at the same loading amplitude were carried out.
It is clearly indicated inFig. 16that the temperature risesfirst up to a certain cycle; then it decreases. At the same time, the relative modulus (E/E0) changes inversely; it decreasesfirst, before increasing after. The
increase of temperature in thefirst step is due to energy dissipation and heating. The decrease of relative modulus in this step is due to self-heating. The increase of relative modulus in the second step is related to the decrease of the temperature. Also this decrease in the temperature which is followed after increasing the temperature can be the result of heat convection which occurs after a while with the environment to
equilibrate with it.
Fig. 16also shows the effect of loading amplitude. The results in-dicate that by increasing the loading amplitude (at the same frequency); the temperature rise becomes more significant. However, after defined cycles the relative modulus increases due to decreasing of temperature.
3.3.3. Effect of frequency
The results of Wöhler curves obtained by fatigue tests for different frequencies of 10, 30, 50, and 100 Hz and the same loading amplitude of 75 MPa for PEEK samples are shown inFig. 17. Thisfigure indicates that there is a difference between the fatigue lifetime related to various frequencies; at medium frequency the differences is small while at high frequency fatigue lifetime reduced and at low frequency it increased substantially.
Fig. 17also shows for an applied stress equal to 75 MPa, a variation of the frequency from 10 Hz to 50 Hz lead to a fatigue life 2.5 times smaller (104and 4 × 10³respectively) and it became 3.5 times smaller
when the frequency raised to 100 Hz. These ratios become more sig-nificant when the fatigue stress increased (observed inFig. 19). Thus it can be concluded, independent of the loading amplitudes, for fre-quencies of 30 Hz and above, there is a determinant influence of the frequency on the fatigue lifetime. This phenomenon, in fact is due to the self-heating during fatigue test pointed out in the next section.
Fig. 18illustrates the variation of temperature during fatigue tests of PEEK samples at different frequencies and loading amplitudes. It is represented clearly inFig. 18that the amplitude and frequency effects
are not very noticeable up to 200 cycles, but at higher cycles, the effects of these parameters on the temperature is considerable.
For the same amplitude it is clear that by increasing frequency, temperature increased accordingly. This increase is very noticeable for the frequency above 30 Hz.
Concerning the applied stress and frequency: as shown in
Fig. 18(a) and (b), the temperature increases more rapidly until fracture for high applied stresses and frequencies. Moreover, at low applied stresses and frequencies, a stabilization of the temperature can be ob-served until specific number of cycles which highlights the effect of heat exchange made possible by a lower rate of self-heating.
Indeed, in the range of temperature corresponds to the beginning of the modification of the physical state of the PEEK.
It should be noted that the couple frequency-amplitude affects the nature of the fatigue overall response which can be governed by the damage mechanisms accumulation (Mechanical Fatigue) and/or by the self-heating (Induced Thermal Fatigue). For fatigue loading at 100 Hz, self-heating has been observed and yielded to a temperature rise up to 55 °C.
3.3.4. Fracture surface observation after fatigue tests
Fig. 19shows the SEM analysis on fracture surfaces of the sample
Fig. 9. (a) Representative curves of different strain rates tensile tests and (b) Influence of strain rate on the failure strain.
after fatigue tests.
As it was discussed before, by changing strain rate, frequency or loading amplitude for PEEK, the mode of rupture of fracture surface also changes. So it is important to emphasize that the material behaves differently under different conditions of fatigue tests. As it is shown in
Fig. 19(a) for PEEK in 10 Hz ductile fracture appears. For the frequency of 100 Hz fracture surface consist of both ductile and brittle sections, shell layer faces ductile fracture (more amorphous) and the core layer (more crystalline) exhibits brittle fracture.
3.4. Calculation of energy dissipation
The samples used in this section are in the shape of rectangles with
Fig. 11. Influence of strain rate on the: (a) threshold stress, (b) threshold strain, (c) maximum stress and (d) maximum strain.
Fig. 12. (a) Cut section of virgin material, (b) plastic deformation after quasi-static tensile test.
Fig. 13. Macroscopic observation of fractured samples at different strain rates; (a) quasi-static test and (b) strain rate of 60 s−1.
the dimensions of 45 × 4 × 3 mm which was subjected to the cyclic behavior by the MTS 830 hydraulic fatigue machine. The samples were tested in different frequencies of 10, 30 and 80 Hz and at constant amplitude of 68 MPa. In this amplitude we don’t have the failure of sample rapidly and also the fatigue test doesn’t take a long time. At the same time the evaluation of the temperature was measured by infrared camera (Raynger-MX4) in specific area (maximum temperature).
Fig. 20is the different cycles of fatigue test in the frequency of 30 Hz
and amplitude of 68 MPa in which we have the hysteresis loops so we can get the energy dissipation and follow the modulus evaluation.
For this reason in this section, samples in three different frequencies and constant amplitude of 68 MPa are tested to analyze this phenom-enon.
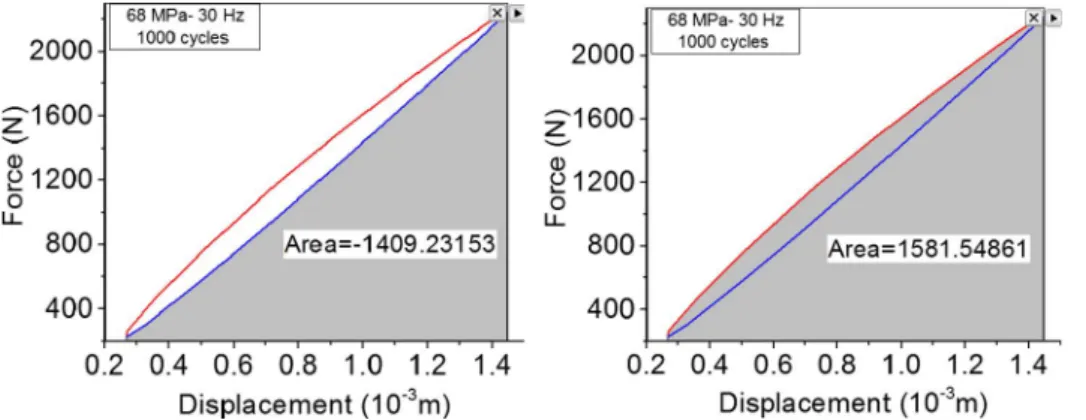
As it is clearly comprehensible energy dissipation in the fatigue test refers to the energy which is not gain back from the energy which is given for applying the cyclic test, this energy is assumed as dissipated
energy which is consumed as the work for plastic deformation or thermal energy to increase the heat or to form physical transformation. Dissipated energy is equal to the area inside the hysteresis loop, which is a kind of energy in Joule so for calculating it, curves of for-ce–displacement for each cycle which is obtained by the help of OriginLab 2016 software, is used. By subtracting these two areas shown in theFig. 21, energy dissipation in each cycle is obtained. For 10 Hz there is a failure of sample after 500,000 cycles, for 30 Hz 100,000 cycles and for 80 Hz it is about 2000 cycles but in this analysis for better comparing we have chosen the optimized cycles.
By calculating energy dissipation of some cycles we can trace energy dissipation -cycle curve (seeFig. 22) in which we can use for correla-tion. As usual the premier cycles of the fatigue test are not reliable especially for the high frequency fatigue test because it takes a little time for the test to arrive to the amplitude which we want to perform the test. So it is because of that we haven't considered some premier cycles of the test.
It is apparent that for the fatigue test of 80 Hz fatigue is dominated by thermal fatigue and the hysteresis loop is getting larger as it is in accordance with the temperature-cycle curve and its modulus is sharply decreasing the other frequencies which are lower frequencies (30 & 10 Hz) process is dominated by both mechanical and thermal fatigue. Hereby inFig. 22related curvefits of energy dissipation versus cycles for three different frequencies are presented; by comparing the results and equations one can note that there is a relation between energy dissipation which is in the function of frequency and cycle. For gen-eralizing the equation we can reach to the following equation with a good approximation:
= ×
E a N( )b
where“E” is energy dissipation; “N” is the number of cycles and “a” is constant. One can note the relation between the frequency and the parameter“b”. So, on the whole obtained equation for calculating the energy dissipation which is as a function of frequency and cycle is
Fig. 14. (a) Microscopic observation of unloaded sample and fractured surfaces of the samples: (b) after quasi-static tensile test and (c) after high strain rate tensile tests (60 s−1).
shown as follow:
= × − + × E 228 N( 0.18 0.04 Lnf)
To verify this equation the fatigue tests were performed repeatedly for the frequency of 40 Hz and the results which are driven from the experimental and from the above equation (Fig. 23).
So it is apparent from the curve that the dispersion is negligible so as a result the equation is covering the energy dissipation per cycle for different frequencies. As it is known the accumulation of the energy in the certain cycles is obtained from the integration of the area under the energy dissipation– cycle so one can calculate the energy dissipation for cycles.
4. Conclusions
In this paper, tensile tests were performed with the strain rates varying from quasi-static to 60 s−1 and at different temperatures to compare the flow characteristics of PEEK undergone various testing conditions. An overall analysis of the fatigue behavior of PEEK has been performed through the analysis of the coupled effect of loading am-plitude and frequency. In order to highlight the induced thermal
Fig. 16. Evolutions of the relative Young’s modulus (E/E0) and the self-heating phenomenon during fatigue tests: (a) f = 30 Hz andσmax= 60 MPa, (b) f = 30 Hz andσmax= 65 MPa, (c)
f = 30 Hz andσmax= 70 MPa and (d) f = 30 Hz andσmax= 78 MPa.
Fig. 17. Applied frequency versus fatigue lifetime for PEEK samples forσ = 75 MPa.
Fig. 18. Temperature variation at different frequencies and amplitudes for PEEK samples: (a) f = 30 Hz and different amplitudes, (b) σmax= 75 MPa and different frequencies.
Fig. 19. Fracture surfaces at different loading conditions: (a) σmax= 75 MPa and f = 10 Hz, (b and c)σmax= 75 MPa and f = 100 Hz.
Fig. 20. Stress–strain fatigue curve of PEEK sample in the σ = 68 MPa and f = 30 Hz.
Fig. 21. Force– Displacement curve of fatigue test for calculating energy dissipation.
Fig. 22. Energy dissipation-cycle curve of fatigue test for PEEK at f = 10, 20, 30, 80 Hz & σ = 68 MPa.
fatigue, the effect of frequency has been studied. At the same time, the effect of the loading amplitude allowed emphasizing the effect of da-mage kinetic on the nature of fatigue behavior of PEEK. In addition, the conditions at which thermal fatigue happens and also the amount of energy which is consumed are discussed. Based on the experimental results, the following conclusions may be drawn:
•
By increasing the strain rate from quasi-static tensile test to high strain rate tensile test, the mechanism of fracture changes from ductile to brittle mode. This change doesn't influence the Young's modulus which can be influenced by frequency and amplitude. As the amplitude and frequency increased Young's modulus decreased.•
Different behavior for the fatigue fracture was observed at high and low frequency and amplitude. By increasing frequency or loading amplitude, the fracture surface changed from ductile to mixed ductile and brittle mode and this was interpreted to be due to the induced self-heating phenomenon.•
The core layer failed in brittle mode while the shell layer failed in ductile mode.•
Thermal fatigue has a very significant role in increasing temperature and reducing fatigue life; from there it is necessary to know the conditions which thermal fatigue happens and also the amount of energy which is consumed. Obtained equation from the experi-mental results and calculations can estimate the energy dissipation in the fatigue tests which is as a function of cycle and frequency. Conflicts of interest disclosureThis study has no funding and the authors declare that they have no
conflict of interest. References
[1] Chen W, Lu F, Cheng M. Tension and compression tests of two polymers under quasi-static and dynamic loading. Polym Test 2002;21(2):113–21.
[2] Rae PJ, Brown EN, Orler EB. The mechanical properties of poly(ether-ether-ketone) (PEEK) with emphasis on the large compressive strain response. Polymer 2007;48(2):598–615.
[3] Monich PR, Henriques B, Novaes AP, Souza JCM, Fredel MC. Mechanical and bio-logical behavior of biomedical PEEK matrix composites. Mater Lett 2016. [4] Ferguson SJ, Visser JMA, Polikeit A. The long-term mechanical integrity of
non-reinforced PEEK-OPTIMA polymer for demanding spinal applications: Experimental andfinite-element analysis. Eur Spine J 2006;15(2):149–56.
[5] Chen F, Gatea S, Ou H, Lu B, Long H. Fracture characteristics of PEEK at various stress triaxialities. J Mech Behav Biomed Mater 2016.
[6] Chen F, Ou H, Gatea S, Long H. Hot tensile fracture characteristics and constitutive modelling of polyether-ether-ketone (PEEK). Polym Test 2017.
[7] Richeton J, Ahzi S, Vecchio K, Jiang S, Adharapurapu FC, Adharapurapu RR. Influence of temperature and strain rate on the mechanical behavior of three amorphous polymers: Characterization and modeling of the compressive yield stress. Int J Solids Struct 2006;43(7–8):2318–35.
[8] Kolsky H. An investigation of the mechanical properties of materials at very high rates of loading. Proceedings of the physical society; 1949.
[9] Chou SC, Robertson KD, Rainey JH. The effect of strain rate and heat developed during deformation on the stress–strain curve of plastics. Exp Mech
1973;13:422–32.
[10] Briscoeb BJ, Nosker RW. Theflow stress of high density polyethylene at high rates of strain. Polym Commun 1985;26(10):307–8.
[11] Rietsch F, Bouette B. The compression yield behaviour of polycarbonate over a wide range of strain rates and temperatures. Eur Polym J 1990;26:1071–5.
[12] Cady CM, Blumenthal WR, Gray III GT, Idar DJ. Determining the constitutive re-sponse of polymeric materials as a function of temperature and strain rate. J Phys IV 2005;122(June):27–32.
[13] Hamdan S, Swallowe GM. The strain-rate and temperature dependence of the me-chanical properties of polyetherketone and polyetheretherketone. J Mater Sci 1996;31:1415–23.
[14] Mulliken AD, Boyce MC. Mechanics of the rate-dependent elastic–plastic deforma-tion of glassy polymers from low to high strain rates. Int J Solids Struct 2006;43:1331–56.
[15] Shrestha R, Simsiriwong J, Shamsaei N. Load history and sequence effects on cyclic deformation and fatigue behavior of a thermoplastic polymer. Polym Test 2016;56(August):99–109.
[16] Rakish S, Simsiriwong J, Shamsaei N, Moser RD. Cyclic deformation and fatigue behavior of polyether ether ketone (PEEK). Int J Fatigue 2015:2005–8. [17] Bassett DC, Olley RH. On crystallization phenomena in PEEK∗. Polymer
1988;29(June):9–11.
[18] Medalia AI. Heat generation in elastomer compounds: Causes and effects. Rubber Chem Technol 1991;64:481–92.
[19] Medalia AI. Heat generation in elastomer compounds: causes and effects. 2008:2005–8.
[20] Mortazavian S, Fatemi A. Fatigue behavior and modeling of shortfiber reinforced polymer composites: A literature review. Int J Fatigue 2015;70:297–321. [21] Mortazavian S, Fatemi A, Mellott SR, Khosrovaneh A. Effect of cycling frequency
and self-heating on fatigue behavior of reinforced and unreinforced thermoplastic polymers. Polym Eng Sci 2015(C):2005–8.