ÉCOLE DE TECHNOLOGIE SUPÉRIEURE UNIVERSITÉ DU QUÉBEC
MANUSCRIPT BASED THESIS PRESENTED TO ÉCOLE DE TECHNOLOGIE SUPÉRIEURE
IN PARTIAL FULFILLMENT OF THE REQUIREMENTS FOR THE DEGREE OF DOCTOR OF PHILOSOPHY
Ph.D.
BY
Otilia María ALEJANDRO MOLINA
A D3M METHODOLOGY FOR THE INTEGRATION OF STUDENTS' SURVEY RESULTS WITH TEACHERS' PERSPECTIVES, BASED ON OBJECTIVE,
SUBJECTIVE AND SEMANTIC MEASURES
MONTREAL, JUNE 13, 2016
This Creative Commons licence allows readers to download this work and share it with others as long as the author is credited. The content of this work may not be modified in any way or used commercially.
BOARD OF EXAMINERS
THIS THESIS HAS BEEN EVALUATED BY THE FOLLOWING BOARD OF EXAMINERS
Mrs. Sylvie Ratté, Thesis Supervisor
Département de génie logiciel et des technologies de l’information, École de technologie supérieure
Mr. Mohamed Cheriet, Chair, Board of Examiners Département de génie de la production automatisée, École de technologie supérieure
Mr. Francois Coallier, Member of the jury
Département de génie logiciel et des technologies de l’information, École de technologie supérieure
Jean-Guy Meunier, External Evaluator
Co-director Laboratoire d’Analyse Cognitive de l’Information, Université du Québec à Montréal
THIS THESIS WAS PRENSENTED AND DEFENDED
IN THE PRESENCE OF A BOARD OF EXAMINERS AND THE PUBLIC ON JUNE 2, 2016
FOREWORD
Teachers are always concern about their students understanding. We have to get along and even struggle with different personalities, wishes, expectations, and learning styles, which are sometimes far away from our own. To progress and improve, we must be prepared to learn about ourselves, discover our abilities, and acknowledge our weaknesses. But for this, we need valuable feedbacks. Unfortunately, in many universities around the world, these can only be obtained using standard surveys that students must filled at the end of their courses. The results of these blunt instruments are always puzzling and difficult to interpret. What a professor has to improve in order to be “better”? What can he really upgrade or uplift? Does improving an aspect of his teaching method will jeopardize another or, on the contrary be beneficial to other aspects?
One solution of course is to change the surveys used, but this is a difficult task. The administrative and political obstacles are immense. In consequence, these students’ survey seems to be entrenched and most teachers are stuck with those trying to figure out what can they do. Most of the time, teachers will put them aside, not even looking at the useless numbers.
This thesis is a first attempt to shed some light on these meaningless numbers and to transform them into useful knowledge. The author proposes an innovative way to aggregate teacher’s perspective into the evaluation process by taking into account their opinion, their interpretation and their knowledge about what is working and what is not. The thesis thus offers a new instrument to understand surveys, pointing at specific skills to improve, and doing so, discover new topics that should be addressed in students’ surveys.
ACKNOWLEDGMENTS
I would like to thank my Thesis Director, Professor Sylvie Ratté for devoting all the time, having the meetings; supporting all the trials we did to reach these results and committing herself to making this a very high quality experience and research. Also, I would like to acknowledge the people in the LINCS-Lab for all their insights, thoughts, support and friendship during the time we spent together.
My special gratitude to the teachers and evaluators who participated in the questionnaires, taking the time to respond them.
Also, I would like to express my thankfulness in a very special way to my parents, Jorge and Maria Otilia, for their support and unconditional help, to my daughter, Ana Carolina, for her patience and comprehension during all these years of hard work, and to my friends Jacobo, Nelson, Frank and Erick for their words of encouragement and time.
Finally, a special recognition to ESPOL, CISE-ESPOL for the data provided, and to SENESCYT for the economic support to do this research.
A D3M METHODOLOGY FOR THE INTEGRATION OF STUDENTS' SURVEY RESULTS WITH TEACHERS' PERSPECTIVES, BA SED ON OBJECTIVE,
SUBJECTIVE AND SEMANTIC MEASURES
Otilia María ALEJANDRO MOLINA
ABSTRACT
In the academic world is very common to evaluate teacher`s performance in class with the use of questionnaires fill up by students. In general, the analysts use statistical descriptive analysis to obtain information from surveys that evaluate teachers’ performance in class. Most analyses consider students’ opinion as the basis to generate recommendations to teachers for improving their classes. In this thesis, we considered necessary to add to the analysis of the students’ opinion, the judgments and expertise of the evaluated teacher and other colleagues’ experiences shared at the same university.
To accomplish this, we propose to obtain common patterns in the form of association rules. These common patterns represent the teacher`s model. With these patterns we constructed a graphical representation that includes patterns considered good by the students and good by the teachers. The graphical representation was constructed using rules evaluated with objective and subjective measurements and a data mining methodology.
Hence, to evaluate other rules that were not initially taken into account inside the representation, we constructed a semantic measure that considers students’, teachers', and colleagues’ opinions along with a variable that measures the effort to improve specific attributes in the rule. This utility semantic measure provided a value that recommended the application of a specific pattern. This measure helped identify the best attributes teacher should keep working on and which were the weakest ones where he needed to boost.
Finally, to discover new topics that are not considered in the students’ survey we apply topic modeling to identify the different relevant topics that teachers talked about during the interviews. The results obtained from this work revealed that feelings and communication were components that strongly affected learning and critical thinking of students. Therefore, they should be considered as key elements in the design and construction of the course and as part of the improved survey questions.
We concluded that the addition of subjective analysis and utility semantic measure improved the efficacy of the tools used to enhance teacher’s performance.
Keywords: students’ opinion, teacher expertise, teacher’ model, objective and subjective
UNE MÉTHODOLOGIE D3M POUR INTÉGRER LE RÉSULTAT DES SONDAGES DES ÉTUDIANTS AVEC LA PERSPECTIVE DE L’ENSEIGNANT SUR LA BASE
DE MESURES OBJECTIVES, SUBJECTIVES ET SÉMANTIQUES
Otilia María ALEJANDRO MOLINA
RÉSUMÉ
Dans les milieux universitaires, il est commun d’évaluer la performance des enseignants en classe grâce à des questionnaires remplis par les étudiants. En général, les analystes utilisent des techniques de statistique descriptive pour énoncer des conclusions et générer des recommandations sur la base de la seule opinion des étudiants. Dans cette thèse, nous développons une méthodologie permettant d’incorporer à l’analyse les jugements et l’expertise des enseignants et des collègues qui partagent le même vécu académique.
Pour ce faire, nous construisons des modèles prenant la forme d’un ensemble de règles d'association exprimant les patrons communs. Ces ensembles de patrons représentent ainsi le modèle personnalisé et complet de chaque enseignant. La représentation graphique que nous proposons intègre les modèles considérés comme judicieux à la fois par les étudiants et par les enseignants. Cette représentation est construite en utilisant les règles évaluées grâce à un ensemble de mesures objectives et subjectives et une méthodologie fondée sur l'exploration des données.
De manière complémentaire, nous avons construit une mesure sémantique permettant d’évaluer les règles qui ne sont pas prises en compte au départ dans la représentation. Cette mesure d’utilité évalue l’effort nécessaire pour améliorer des attributs spécifiques de chaque nouvelle règle en combinant l’avis des étudiants, des enseignants et des collègues. La valeur obtenue permet ainsi de recommander l’application d’une règle d’association spécifique pour améliorer les performances d’un enseignant. En conséquence, la mesure permet d’identifier, pour chaque enseignant, ses forces et ses déficiences de manière plus fidèle.
Finalement, nous identifions des thèmes d’évaluation importants qui ne sont pas considérés dans les questionnaires originaux que remplissent les étudiants. Notre analyse utilise un modèle de topique pour identifier ces thèmes pertinents dans les entrevues personnalisées réalisées auprès des enseignants. Sur l’ensemble des entrevues réalisées, les résultats de cette analyse ont révélé que dans l’ensemble les sentiments et la communication constituaient des éléments clefs qui affectent fortement l'apprentissage et la pensée critique des étudiants. Conséquemment, ils devraient donc être considérés comme des éléments essentiels lors de la conception des cours, mais aussi lors de la construction des questionnaires.
En résumé, l'ajout de l'analyse subjective et d’une mesure d’utilité sémantique pourrait permettre d’améliorer l'efficacité des outils d’évaluation utilisés pour améliorer la performance de l'enseignant.
Mot-cles: opinion des étudiants, expertise des enseignants, modèle personnalisé de
enseignant, mesures objectives et subjectives, mesure sémantique, modèle de topique, questionnaires des étudiants
TABLE OF CONTENTS
Page
INTRODUCTION ...1
0.1 Context: questionnaires and instruments ...1
0.2 Aim of the thesis ...4
0.3 Research questions and overview of the methodology ...4
CHAPTER 1 LITERATURE REVIEW ...9
1.1 Overview of students surveys around the world ...9
1.2 Analysis of evaluation instruments ...11
1.3 Domain Driven Data Mining (D3M) and Actionable Knowledge Discovery (AKD) ...12
1.4 Knowledge, domain knowledge, experts’ knowledge and Meta - knowledge ...14
1.5 Interestingness: Objective, Subjective and Semantic measures and Actionability ...16
1.6 Utility mining and utility formula ...18
1.7 Probabilistic Topic modeling and measuring the model ...20
1.7.1 Probabilistic Topic Modeling. ... 20
1.7.2 Cohen Kappa ... 21
1.8 Conclusion of the review ...21
CHAPTER 2 GENERAL METHODOLOGY ...23
2.1 Methodology overview ...23
2.2 Methodology description ...25
2.2.1 Objective 1: To build a representation using students’ model and teacher’s model based on actionable knowledge ... 25
2.2.2 Objective 2: To construct a utility semantic measure to evaluate the usefulness of association rules within the model ... 25
2.2.3 Objective 3: To discover new topics from the interviews analysis to improve teacher evaluation ... 26
2.3 Objective description and associated results ...27
2.3.1 Objective 1: To build a representation using students’ model and teacher’s model based on actionable knowledge ... 27
2.3.2 Results associated to Objective 1, “To build a representation using students’ model and teacher’s model based on actionable knowledge” ... 29
2.3.3 Objective 2: To construct a utility semantic measure to evaluate the usefulness of association rules within the model ... 32
2.3.4 Results associated to objective 2, “To construct a utility semantic measure to evaluate the usefulness of association rules within the
model” ... 34
2.3.5 Results of the comparison between Objective 1, “To build a representation using students’ model and teacher’s model based on actionable knowledge”, and Objective 2, “To construct a utility semantic measure to evaluate the usefulness of association rules within the model” ... 39
2.3.6 Objective 3: To discover new topics from the interviews analysis to improve teacher evaluation ... 44
2.3.7 Results of Objective 3, “To discover new topics from the interviews analysis to improve teacher evaluation” ... 45
2.3.8 Conclusions ... 50
CHAPTER 3 DESCRIPTION OF THE INSTRUMENTS TO OBTAIN KNOWLEDGE: INTERVIEW AND SURVEYS ...53
3.1 Introduction ...53
3.2 Questionnaires for Teacher’s subjective perspective (S1 and S2) ...53
3.2.1 Section A: Question evaluation ... 55
3.2.2 Section B: Evaluation per area ... 56
3.2.3 Section C: Reaction to low evaluation ... 58
3.2.4 Section Da: Creation of open association rules using variables from section A ... 60
3.2.5 Section Db: Creation of contextual association rules using variables from section B ... 62
3.2.6 Section E: Questionnaire for Teacher’s evaluation rules (S2) ... 64
3.3 Results from the survey ...66
3.3.1 Results from Section A: Attribute evaluation ... 66
3.3.2 Results from section B: Most selected areas ... 67
3.3.3 Results from section C: Reaction to low evaluation ... 68
3.3.4 Results from section Da: Creation of open association rules using attributes from section A ... 69
3.3.5 Results from section Db: Creation of context association rules using variables from section B ... 73
3.3.6 Conclusions from teachers’ survey ... 80
3.4 Teacher’s interview ...82
3.4.1 The interviewing model ... 82
3.4.2 Selection of the interviewees ... 83
3.4.3 Sampling strategy... 83
3.4.4 Size of the sample ... 84
XV
CHAPTER 4 ARTICLE I : STUDENTS’ AND TEACHERS’ PERCEPTION OF ACADEMIC EVALUATION : METHODOLOGY TO CONSTRUCT A
REPRESENTATION BASED ON ACTIONABLE KNOWLEDGE DISCOVERY (AKD)
FRAMEWORK...87
4.1 Introduction ...88
4.2 Literature review ...89
4.2.1 Knowledge, domain knowledge and meta-knowledge ... 89
4.2.2 Technical and business interestingness measures ... 92
4.2.3 Subjective criteria evaluation form ... 95
4.2.4 D3M and PA-AKD framework ... 95
4.3 Dataset...97
4.4 Methodology ...100
4.4.1 Objective evaluation ... 101
4.4.2 Data mining analysis ... 102
4.4.3 Subjective evaluation ... 103
4.5 Results for the Entrepreneurship course example ...111
4.5.1 Objective evaluation phase ... 112
4.5.2 Results from Sub-Q1... 112
4.5.3 Results from Sub-Q2, actual model and improved model ... 113
4.5.4 The interview and the meta-knowledge ... 114
4.5.5 Construction of the graphical model ... 116
4.6 Discussion ...118
4.7 Conclusions ...118
4.8 Results ...119
4.9 Future Work ...120
4.10 Acknowledgments...121
CHAPTER 5 ARTICLE II : FUSION OF OBJECTIVE AND SUBJECTIVE MEASURES TO ASSESS THE UTILITY OF ASSOCIATION RULES ...123
5.1 Introduction ...124
5.2 Literature Review...125
5.3 Methodology ...127
5.3.1 Objective analysis ... 128
5.3.2 Subjective analysis ... 129
5.3.3 Predictive and Objective Analysis ... 136
5.3.4 Utility analysis ... 137
5.4 Illustration of the methodology ...143
5.4.1 Objective analysis ... 143
5.4.2 Subjective analysis ... 143
5.4.3 Open association rules creation ... 145
5.4.4 Context association rules creation ... 146
5.4.5 Evaluated association rules creation ... 147
5.5 Predictive and Objective analysis ...148
5.5.2 Objective attributes ... 150
5.5.3 Evaluation with utility measure ... 152
5.5.4 Utility rule evaluation using utility measure for T1 and T7 ... 153
5.6 Experiment with extreme values ...160
5.6.1 Objective and Subjective analysis (step 1 and 2) ... 160
5.6.2 Generated Association rules and utility formula (step 3 and 4) ... 163
5.7 Discussion ...171
5.7.1 Subjective analysis ... 172
5.7.2 Utility formula ... 173
5.7.3 Application of the utility formula ... 174
5.8 Conclusion and future work ...176
CHAPTER 6 ARTICLE III: TOPIC MODELING ANALYSIS OF TEACHERS INTERVIEWS: TOWARDS A COMPREHENSIVE VIEW OF EVALUATED TOPICS IN THE CLASSROOM ...177
6.1 Introduction ...178
6.2 Literature review ...179
6.2.1 Probabilistic topic modeling ... 179
6.2.2 Dictionary ... 180
6.2.3 Cohen’s Kappa statistic for measuring agreement ... 181
6.3 Materials ...182
6.3.1 Survey question descriptions ... 183
6.3.2 Interviews ... 185
6.4 Methods...185
6.4.1 Topic modeling ... 186
6.4.2 Dictionary construction. ... 186
6.4.3 Classification and evaluation between expert opinion and the automatic classification ... 188
6.5 Results ...191
6.5.1 Number of topics and representation of topics ... 191
6.5.2 Dictionary construction ... 193
6.6 Conclusions ...198
6.7 Future work ...199
CHAPTER 7 GENERAL DISCUSSION ...201
7.1 Application of the methodology in ESPOL domain ...202
7.2 Consideration to apply the methodology in another university ...203
7.3 Application of the methodology in a completely different domain ...204
GENERAL CONCLUSION ...207
XVII
APPENDIX I SURVEY S1: MODEL QUESTIONNAIRE ON
KNOWLEDGE RETRIEVEMENT……….………….208
APPENDIX II SURVEY S2: QUESTIONNAIRE FOR TEACHER`S EVALUATION RULES………..…………..222
APPENDIX III INTERVIEW………..230
APPENDIX IV ETHICAL CERTIFICATIONS……… …233
LIST OF TABLES
Page
Table 2-1 Attributes’ description ...44
Table 2-2 Topic analysis - LDA results ...45
Table 2-3 Topic names ...46
Table 2-4 Cohen Kappa’s results ...48
Table 3-1 Questions per area and maximum number of questions ...56
Table 3-2 Categories of reaction to low evaluation. ...58
Table 4-1 Differences between technical interestingness and business interestingness patterns ...92
Table 4-2 Areas and questions / items per area ...98
Table 4-3 Sub-Q2 Questionnaire ...105
Table 5-1 Questions per area and question chosen by teacher ...131
Table 5-2 Categories of low evaluation reaction ...132
Table 5-3 Regression attributes T1, T7 ...143
Table 5-4 Question's evaluation, section A ...144
Table 5-5 Evaluation per area, section B ...144
Table 5-6 Low evaluation reaction section C ...145
Table 5-7 Open rules T7 ...146
Table 5-8 Final open rules T7 ...146
Table 5-9 Context rule construction, T7 ...147
Table 5-10 Final context rules, T7 ...147
Table 5-11 Evaluated attributes T1 ...148
Table 5-12 Evaluated attributes T7 ...148
Table 5-14 Evaluated/regression attributes comparison for teacher T1 ...149
Table 5-15 Open and context attributes comparison or teacher T7 ...149
Table 5-16 Evaluated and regression attributes comparison for teacher T7 ...150
Table 5-17 Frequency of attributes in open rules (consequent) ...150
Table 5-18 Frequency of attributes in context rules (consequent) ...151
Table 5-19 Predictive and objective attributes T1 and T7 ...152
Table 5-20 Weight calculation ...154
Table 5-21 Aew calculation ...155
Table 5-22 Actually Excellent Factor (Aef) ...156
Table 5-23 Frequency of antecedents and consequents in evaluation rules ...157
Table 5-24 Teacher interest calculations ...157
Table 5-25 Utility Calculation T1 ...158
Table 5-26 T1 utility evaluation association rules ...159
Table 5-27 Utility evaluation association rules ...159
Table 5-28 Predictive and Objective attribute construction T1 ...161
Table 5-29 Predictive and Objective attribute construction T7 ...162
Table 5-30 T1 rules for the three datasets ...163
Table 5-31 T7 rules for the three datasets ...164
Table 5-32 Utilities T1 ...165
Table 5-33 Utilities T7 ...167
Table 5-34 Utilities from different datasets T1 ...169
Table 5-35 Utilities from different datasets T7 ...170
Table 6-1 Contingency table ...181
XXI
Table 6-3 Topics vs. Survey questions short descriptions ...193
Table 6-4 Evaluation Experts classification vs Model classification ...196
Table 6-5 Percentages of the number of topics per theme ...197
LIST OF FIGURES
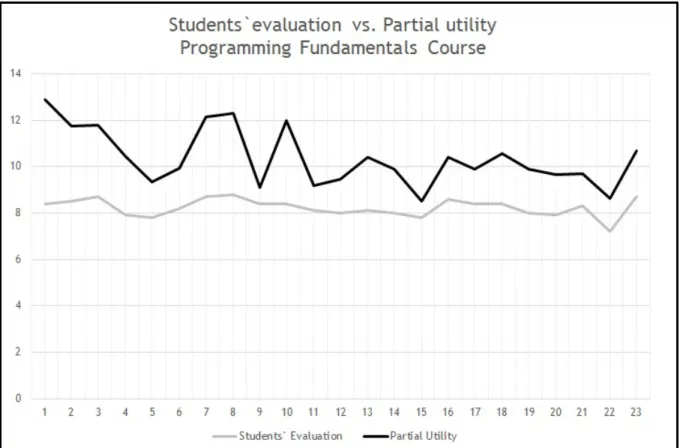
Page Figure 0.1 Global distribution of the surveys ...2 Figure 1.1 Data mining steps ...13 Figure 1.2 Post Analysis - AKD's approach Taken from (Cao, Zhao et al. 2010) ...13 Figure 1.3 DM and AKD approach Taken from (Cao, Zhao et al. 2010) ...14 Figure 2.1 Methodology and Research objectives ...24 Figure 2.2 Domain Knowledge and Interesting rules representation ...30 Figure 2.3 Interesting rule example ...30 Figure 2.4 Improved model with the meta-knowledge included ...31 Figure 2.5 Matrix of Recuperation effort (Actionability vs knowledge) ...33 Figure 2.6 The Effort force, the Actual knowledge, Is and It ...35 Figure 2.7 Matrix of Recuperation effort ...36 Figure 2.8 Students' Evaluation vs Partial utilities for Programming
Fundamentals Course ...38 Figure 2.9 Students' Evaluation vs Partial utilities for Research Methods Course ...39 Figure 2.10 Web Application Development Course Representation ...40 Figure 2.11 Web Application Development Course Representation with
utility range 61-80 ...41 Figure 2.12 Web Application Development Course Representation with
utility range 41-60 ...41 Figure 2.13 Web application development Course- Teacher perception ...42 Figure 2.14 Distribution of the partial utilities ...42 Figure 2.15 Partial utilities details. ...43 Figure 2.16 Dictionary description Question X6 ...47
Figure 2.17 Topic to questions assignment ...48 Figure 3.1 S1 Survey’s Components ...54 Figure 3.2 Example of Section A – Question evaluation ...55 Figure 3.3 Example of Section B – Evaluation per area ...57 Figure 3.4 Example of Section B – Selection of attributes per area ...57 Figure 3.5 Example of Section C- Reaction to low evaluation ...59 Figure 3.6 Example of open rules creation ...61 Figure 3.7 Example final attributes (open rules) ...62 Figure 3.8 Example of context rules creation ...63 Figure 3.9 Example final attributes (context rules) ...64 Figure 3.10 Example Section E - Knowledge categories classification ...65 Figure 3.11 Results from Section A- Attribute evaluation ...66 Figure 3.12 Results section B frequency per areas ...67 Figure 3.13 Results Section B-Selected attributes per area ...68 Figure 3.14 Results Section C - Low evaluation reaction ...69 Figure 3.15 Frequent consequent attributes use in open association rules ...70 Figure 3.16 Frequent antecedent attribute use in open association rules ...71 Figure 3.17 Frequent eliminated attribute from the antecedent of
open association rules ...72 Figure 3.18 Most frequent attribute placed in the Consequent (Design) ...73 Figure 3.19 Most frequent attributes placed in the antecedent (Design) ...74 Figure 3.20 Most frequent attributes eliminated from antecedent (Design) ...75 Figure 3.21 Most frequent attributes placed in the consequent
(Learning Promotion) ...75 Figure 3.22 Most frequent attributes placed in the antecedent
XXV
Figure 3.23 Most frequent attributes eliminated (Learning Promotion) ...77 Figure 3.24 Most frequent attributes in the consequent (Production-Management) ...77 Figure 3.25 Most frequent attributes in the antecedent (Production-Management) ...78 Figure 3.26 Most frequent attributes eliminated (Production-Management) ...79 Figure 3.27 Frequency of the rules in context association rules ...79 Figure 4.1 Post Analysis based...96 Figure 4.2 Data mining steps ...96 Figure 4.3 Post Analysis-AKD’s approach Taken from (Cao, Zhao et al. 2010) ...97 Figure 4.4 Surveys per University Faculty and Institute ...98 Figure 4.5 General view of the methodology ...101 Figure 4.6 Comparison between obj-Qreg and sub-Q1reg ...102 Figure 4.7 Subjective endorsement sub-Q1 ...104 Figure 4.8 Domain knowledge retrieving process ...107 Figure 4.9 Meta-knowledge retrieving process ...108 Figure 4.10 Complete methodology ...111 Figure 4.11 Domain knowledge and Interesting rules graphic ...114 Figure 4.12 Improved model with the meta-knowledge included ...116 Figure 5.1 Methodology ...128 Figure 5.2 Objective analysis ...128 Figure 5.3 Teacher survey's components ...130 Figure 5.4 Open, context and evaluated attributes ...134 Figure 5.5 Predictive and objective constructed dataset ...137 Figure 5.6 Effort function (Actionability vs. Knowledge) ...141 Figure 6.1 Topic modeling-dictionary construction and classification steps ...185
Figure 6.2 Topic modeling ...186 Figure 6.3 Dictionary construction ...187 Figure 6.4 Expert classification process ...189 Figure 6.5 Classification and evaluation step ...190 Figure 6.6 Topics survey questions ...195
LIST OF ABREVIATIONS
ACK Actual Knowledge of the attribute
AEF Actually/Excellent Factor
AEW Actually evaluation weight
AKD Actionable Knowledge Discovery
CEQ Course Experience Questionnaire
D Design
D3M Domain Driven Data Mining
DM Data Mining
E External Utility
EA Evaluation per Area
EEW Excellent evaluation weight
EFT Effort
EM Education Management
ESPOL Escuela Superior Politecnica del
Litoral
F Function FAe_r Frequency of the attributes in the
antecedent
FCe_r Frequency of the attributes in the consequent
FIM Frequent itemset mining
GQE General Question Evaluation
HUIM High utility itemset mining
Is Interest of students
It Interest of teacher
LDA Latent Dirichlet Allocation
LP Learning Promotion
LSI Latent Semantic Indexing
OOA Objective Oriented Utility based
Association Mining
PA-AKD Postanalysis-Based AKD
Pe Expected agreement
PM Production of Learning Materials
Po Observed agreement
Q1 to Q23 Question 1 to Question 23
QE Question Evaluation
Re Recuperation effort
SEEQ Student Evaluation of Educational
Quality
SPTE Student Perception of Teaching
Effectiveness
T Transaction Utility
U Utility
VIF Variance inflation factor
VSM Vector Space Model
WARM Weighted association rule mining WUARM Weighted Utility Association Rule
Mining
Wxi Weight of variable Xi
INTRODUCTION
Universities around the world evaluate their teachers through the use of surveys that retrieve judgments and opinion from students. These surveys contain questions which assess different areas, such as communication, course design and material development that are enforced by the university administration as a mandatory practice. The teacher receives the results of these surveys with values indicating the level of achievement for each question along with statistical graphs to illustrate the highest and lowest evaluated questions. The objective of these evaluations is to provide feedback to teachers on those areas of the survey they may not be aware of.
Incidentally, the surprise comes when the teacher finds out he has not met his expectations about the evaluation grade. Due to lack of precise information, teacher may end up applying considerable effort to improve non-problematic aspects of his teaching style without addressing the real source of the teaching problem. This study aimed to help the teacher compares the rated questions identified by the students with teacher’s expectations, conciliating students’ opinion with teacher’s opinion. Also, we intended to help the teacher to better understand those surveys and give him better clues to improve his performance
0.1 Context: questionnaires and instruments
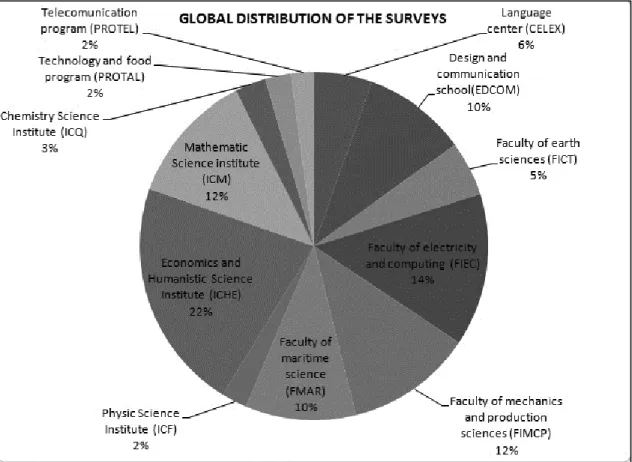
In our research, we are using teachers and students’ data from a Latin American University. The database contains 64,138 survey questionnaires answered anonymously. It holds information about 798 teachers who, as a whole, have given courses to 13,000 students. The university is composed of twelve schools (faculties or schools) and institutes. Each of them provides services to around 218 and 2,300 students per year. Figure 1.1 presents the distribution of the surveys between faculties in the University.
Figure 0.1 Global distribution of the surveys
Students usually take four to six courses each semester, resulting in eight to twelve courses per academic year. At the end of each course, a student has to fill out a survey about the teacher’s performance. Each course has an average of 30 students who answer this survey. The data collected in these questionnaires include information about the year, the semester, the teacher’s name and answers to the 24 questions that evaluate his teaching approach. The students’ survey evaluates four areas: Design, Learning Promotion, Production of teaching materials, and Management of education. Each area has specific questions that help to evaluate the teachers. The survey has 24 questions where question 24 is an overall evaluation of the teacher.
The Design area of the survey evaluates the structure of the content and the evaluation of the course, and includes the following questions about the teacher:
3
Q1: Uses audiovisual help to support the content of the class Q2: Fulfills the program proposed at the beginning of course Q3; Evaluates student participation periodically in class Q4: Evaluations fit the themes developed in class
Q5: Provides clear instructions for learning assessment (tests, quizzes, presentations, simulations, dramatic representation, role playing, etc.)
Q6: Motivates students to do additional research
The Learning Promotion area evaluates the materials constructed for the class and has the following questions:
Q7: Explains the course schedule at the beginning of the course Q8: Explains class policies at the beginning of the course Q9: Encourages active student participation in class
Q10: Summarizes key ideas discussed before moving to a new unit or topic
Q11: Establishes relationships between new concepts and those already known whenever possible
Q12: Motivates learning of the course material
Q13: Is willing to answer questions and offer advice within and outside of the classroom
Q14: Promotes reflection on topics covered
Q15: Maintains fluid communication with students Q16: Is respectful towards students
Q17: Responds to questions in class about subjects related to the field Q18: Delivers class content in an organized way
Q19: Develops class content in an understandable way
The two following areas are Production of teaching materials, and Management of education both concern management of the course activities. Therefore, we integrated these two areas into one, Production of teaching materials, & Management of education. The questions for this consolidated area are the following:
Q20: Prepares instructional, bibliographic or other resources to facilitate learning Q21: Frequently uses schemes and graphics to support his/her explanations Q22: Provides the results of the assessments on time
The survey uses a Likert scale from 0 to 10 and students assign a value to each question. The answers to this survey obtained from each course constitute what we called, the objective dataset of our research.
0.2 Aim of the thesis
When teacher receives his evaluation results, the data includes the application of descriptive statistics and the evaluation of each question belongs completely to the students’ perception. The results of this instrument only offer the highest and lowest evaluated questions and the highest and lowest evaluated areas to the teacher, but no feedback is retrieved from the teachers’ point of view about the evaluation. Consequently, the teacher is left on his own, with no additional support to reflect on the causes of the low rating in some questions, and the potential solutions to enhance his performance. Our methodology provides the teacher with a mechanism to incorporate his own views about the best ranked questions along with the views of other teachers.
As a solution to this problem, we proposed to take the results from these students’ surveys compare them to the teacher’s and his colleagues’ insights in order to obtain a global view of the situation. This will help teachers review their strategies, understand relations among questions, and identify new areas to be evaluated that reflect students’ interests regarding the themes that were not considered in the survey.
0.3 Research questions and overview of the methodology
The aim of the thesis is to present a combination of the objective analysis of students with the subjective considerations of teachers in the form of a methodology. This will expand the actions that can be taken from survey results, not only by knowing what specific questions are evaluated low or high by students, but also by finding what aspects are related to any specific question of the survey and how it is possible to improve the questions. In order to reach a higher evaluation in each question, different aspects can be related to survey questions such as: strategies, knowledge and teacher´s prior experience. We obtained further
5
information about teacher´s perceptions by applying one interview and two surveys (S1 and S2) to teacher and using the students’ perceptions from the university survey. The objectives of analyzing teachers ‘and students ‘perceptions were: first, finding relations between survey’s questions that created new patterns that will become key patterns. Second, measuring the relation among strengths and weaknesses of the teacher and finally, finding new topics that were currently not measured by the survey but were actually introduced by teachers during the course.
We focused on three research questions throughout this methodology:
Research question 1: Are there differences or similarities between the students’ perception and the teacher’s perception?
Research question 2: Can we measure the relationships between survey’s questions based on students’ perceptions, teacher colleagues’ opinions and individual teacher’s beliefs?
Research question 3: Are there new topics to consider aside from the already measured topics?
In this research, we are using the data from the Electrical Engineering and Computer Science Faculty. We limited our analysis to this faculty for some important reasons. It has a highest number of students with an international certification from the Accreditation Board for Engineering and Technology, ABET, (ESPOL 2011) that guarantees their graduates are prepared to enter a global workforce; the teachers of this faculty showed interest to participate in this research. We applied this research in the following courses: Programming Fundamentals, Research Methods Applied to Computing, Software Engineering I, Entrepreneurship, Web Application Development and Digital Communications.
In this research, we applied a domain driven data mining methodology, D3M (Cao, Zhang et al. 2010) that uses objective and subjective data sets. The D3M is based on objective and
subjective interestingness measures. The propose methodology was developed in three papers, and is explained in detail in the following paragraphs using our three contributions:
Our first contribution is presented in the first paper; here we proposed a method to build a representation based on actionable knowledge; this method generates relationships among questions representing teacher’s perception. We evaluated these relationships using objective and subjective measures, and presented two groups of patterns: the teacher’s old model and the teacher’s new model. The first one, the teacher’s old model, is a group of patterns representing rules of thumbs teachers apply in class. The second one, the teacher’s new model, is a group of patterns representing students’ perceptions. We integrated both in one representation. The patterns objectively and subjectively evaluated are thus grouped together. Additionally, we included the knowledge coming from teacher strategies. The resulting method can be used to present patterns, knowledge and meta-knowledge together in one unified model. In order to construct this model, we interviewed the teacher about the rules obtained from the students’ while obtaining knowledge and meta-knowledge associated to the classes and the activities he accomplished. We focused basically on what teachers did to improve their performance in class, like anecdotes that reflect what teachers have done over the years. This type of information helped the teacher understand the rules automatically extracted from the students’ survey. This knowledge in the sense of Herrmann and Kienle et al., (Herrmann, Kienle et al.), along with the information obtained from the students, was then presented graphically, offering a model with attributes or questions closely related to each other, and their connections with the meta-knowledge for each of the attributes in the association rule.
The second contribution is presented in the second paper, where we assessed the utility of these relationships using association rules based on objective and subjective measures, constructing a utility semantic measure to evaluate association rules and testing if they were good rules that improved the model. This semantic measure identified which were the most interesting rules to work with, focusing on the effort required to improve the topic of each question in the survey. In order to achieve this, we used linear regression analysis and created
7
open, context and evaluation rules. Also, we constructed objective and predictive attributes to build the new dataset. This new dataset focused on teacher’s interests. Finally, we evaluated association rules with this utility measure to obtain rules that have more value from the point of view of the teacher’s applicability.
So far, we have presented association rules evaluated from three points of view objective, subjective, and semantic. In order to complete the model from the first paper, we needed to classify the knowledge extracted from each teacher’s interview according to the questions from the students’ surveys. For this purpose, our last contribution, presented in the third paper, uses a topic modeling analysis to obtain the general topics that teacher mentioned during the interviews. Also, we constructed a dictionary of the twenty-three questions of the survey and proceed to classify each teacher’s interview themes. This dictionary presented all the variables of a teacher performance evaluation instrument. We constructed the dictionary by integrating abstracts from scientific pedagogical articles related to each survey’s question and usual dictionary definitions of relevant concepts. Then, using Latent Semantic Indexing (Kuralenok and Nekrest'yanov 2000), we evaluated the effectiveness of the classification with the cosine similarity measure. Finally, we compared the machine classification with two human classifiers and presented the precision of the results.
As a result of the three research papers, we are now able to provide universities with a mechanism to improve students’ evaluation surveys by combining them with the insights and experiences of teachers and obtaining a valuable tool to improve teaching
CHAPTER 1
LITERATURE REVIEW
Universities commonly use surveys to analyze teacher’s performance in the different courses that are part of the careers curriculum. Around the world, different types of surveys are applied. In this chapter, we provide an overview of different survey instruments used worldwide. Additionally, we present the literature review for the components of our methodology for the analysis of teacher and students perceptions using the D3M Data Mining methodology, the Actionable Knowledge Discovery (AKD) framework and the use of objective, subjective and semantic interestingness measures.
1.1 Overview of students surveys around the world
The teacher performance evaluation is common practice at universities every semester. This process allows university management to obtain information from the students about their teachers. Universities analyse this information to gain knowledge through the analysis of the surveys and to take actions to reward teachers in order to improve their teaching abilities among other benefits.
Many instruments or tools have been proposed to evaluate teachers’ performance in classroom. The major difference among these tools is the dimensions analysed. The point in common is that all of them work only with students’ opinions. For example, the Course Experience Questionnaire or CEQ applied in Australian universities, evaluates the experience a student had during a course (Hirschberg, Lye et al. 2015). Students fill out the surveys evaluating different teacher’s attributes, such as teaching attitude, teaching content, teaching evaluation, and other teaching aspects(Jiabin, Juanli et al. 2010).
Another example is the case of “Improving Learning of Higher Education, IDEA,” a non- profit organization that, since 1975, provides the instrument and all the processes to evaluate and improve teacher’s performance and all related services, including the application of the
instrument and the analysis of the answers from the students’ point of view. IDEA specializes in using student questioning to provide opportunities to improve teaching and learning processes (IDEA 2015).
Likewise, The Student Evaluation of Educational Quality, SEEQ, is an instrument from the Center for the Advancement of Teaching and Learning at the University of Manitoba, Canada, where students evaluate teachers through teaching dimensions that include: learning, enthusiasm, organization, group interaction and their overall impression of the instructor (University of Manitoba 2015).
Finally, the Student Perception of Teaching Effectiveness, SPTE, is an instrument from the Wichita State University, U.S., that measures students’ perception of teaching. It is used for summative purposes to congratulate teachers who are doing well, and for formative purposes, to improve the teaching. (Wichita State University 2015). (Jackson, Teal et al. 1999)
In the previously described teacher’s evaluation instruments, only students’ point of view has been analysed. Teacher’s opinions about the perceptions of students’ feedback on their work has rarely been incorporated (Arthur 2009). The author (Arthur 2009) claimed that a teacher needs to consider students judgments to improve his development specially if a teacher gets low feedback. However, a teacher should consider changing his development based on his own feelings and professional judgment about what he is teaching. Hence, we observed an existing gap where comparison between students’ evaluation and a teacher’s perception needs to be made as referred by experts in the field (Hirschberg, Lye et al. 2015).
Besides the evaluation instruments, other data sources have been analysing to evaluate teachers’ performance. These datasets refer to teacher’s personal information, characteristics of the course, besides others. In the next section we include the analysis of these data sources.
11
1.2 Analysis of evaluation instruments
Most Universities perform their analysis of the data, taking into account four different sources: teacher’s personal information, information not related to teacher’s survey performance, the data related exclusively to the students’ survey answers, and a mix of all the above. Four different investigations presented their findings referring to the above mentioned sources. In the first one(Wen, Rong et al. 2014), the information is related to teacher’s age, experience, professional occupation and performance; it takes into account the teacher’s personal information. Wen et al., selected some of these elements as the best characteristics for an ideal teacher. In the second one (Zhang and Wang 2012), the non-teacher factors or information not related to teachers’ survey performance can affect the students’ evaluations. These factors include the number of students in a classroom, the teaching hours in a term, the type of students, the grade and the excellence of the course. This information could affect the final result of an objective survey and is not related to teachers’ abilities, but to students’ abilities. In the third one (Jiabin, Juanli et al. 2010), the focus of the survey data was put into the analysis of the questions that students answer to evaluate the teacher’s development; open and close questions were analysed, and different techniques were used to analyse them such as association rule mining and decision trees or linear regression (Badur and MARDIKYAN 2011). Finally, a mix of dimensions coming from teachers and students are considered to evaluate teacher’s performance as teacher employment status, course workload (Badur and MARDIKYAN 2011), students attendance, percentage of survey students’ fill up and the students’ survey results.
All these research focus only in the analysis of the objective data and what it says about teachers using students’ judgments, course difficulty and teacher’s personal information. The analysis of teachers’ opinion is very limited, as well as the actions to improve teachers’ development. There is a lack of comparison among teaching approaches, the student understanding of the approaches, and clear description about what is measured in survey questions. Additionally, there is no clarity or certainty of which of the survey’s questions should be the starting point to improve teacher’s performance.
In our first paper, presented in Chapter 4, we identified the teacher’s strengths provided by students’ survey and found the strongest relationships among questions and teacher’s using association rules. We illustrated this using a case study where six teachers applied our methodology. In this paper we incorporated teacher`s opinion and knowledge. In order to use knowledge, we needed a specific framework. This framework included besides the objective analysis of the survey students’ data, subjective analysis including teacher`s opinion and additionally measures that help in the evaluation of objective and subjective patterns; this framework was D3M, Domain Driven Data Mining and AKD(Cao, Zhang et al. 2010). We explain these frameworks in next section.
1.3 Domain Driven Data Mining (D3M) and Actionable Knowledge Discovery (AKD)
D3M is a methodology that is not only driven by the data but also by the domain (Cao, Zhang et al. 2010). This methodology looks for finding patterns that triangulate data, the domain knowledge and experts. It is based on the knowledge, the human interaction, the intrinsic knowledge and business expectations.
Moreover, AKD is part of the Domain Driven Data mining (D3M) frameworks. The main objective of AKD frameworks is to discover actionable patterns with immediate application focusing on domain knowledge, e.g. increase in profits and better efficiency, (Longbing 2008). Four different AKD frameworks have been proposed (Cao, Zhao et al. 2010). Each of them is specialized in one specific task: the first one is recommended when the amount of data sources to be accessed is big, MSCM-AKD(Cao, Zhang et al. 2010); The second one, is recommended when it is necessary to access the data several times in order to refine it and generate patterns, CM-AKD; the third one is applied when it is necessary to evaluate the patterns using only one interestingness measure (technical, business measures) UI-AKD; finally, when it is necessary to have separation between technical and business interestingness for the analysis, PA-AKD is recommended. For this research, we chose the latter, the Post analysis based AKD, PA-AKD framework, because it handles technical and
13
business aspects of the problem in a separate way and it doesn’t work with multiple data sources.
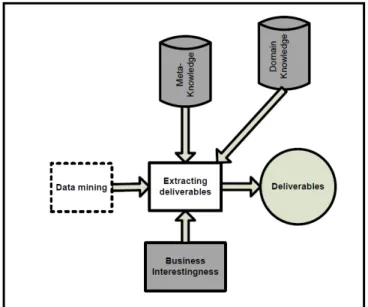
Other components of AKD are technical and business interestingness measures that help identify the interest of a pattern from the objective and subjective point of view (see Figure 1.1 and Figure 1.2). In other words, each pattern is analysed both objectively, using data, and subjectively, taking into considerations the opinions of the expert who worked with the data.
Figure 1.1 Data mining steps
Figure 1.2 Post Analysis - AKD's approach Taken from (Cao, Zhao et al. 2010)
Figure 1.3 DM and AKD approach Taken from (Cao, Zhao et al. 2010)
In Figure 1.3 we see that this framework works with three types of knowledge: domain knowledge, expert knowledge and meta-knowledge and a general concept of interestingness measures. We present the three knowledge types in section 1.4 and the interestingness measures in section 1.5.
1.4 Knowledge, domain knowledge, experts’ knowledge and Meta - knowledge
The research within the AKD framework presents different components such as meta-knowledge, domain knowledge and experts’ knowledge. We are going to define these concepts that are part of AKD.
First, Knowledge is a mix of constructed experiences, values, information or contextual data and expert insight that belongs to any enterprise in an implicit way and that transforms itself in assets for the organization over time (Davenport T. H 1999). These assets belong on the one hand, to people who manage the knowledge and learn in everyday experiences, and on
15
the other hand, to the organization, which saves it in different forms including documents, processes and practices. People and organizations struggle to recognize and organize knowledge because of the large number and variety of business situations and solutions. An example of knowledge gathered during a course is everything related to students, tests, exercises, workgroups and teacher.
Second, Domain Knowledge (DK) is related to the experiences, values, and user insights implicit in user knowledge (Davenport T. H 1999). A simple definition about domain knowledge was given as “the knowledge of the subject area (domain), what you know about a subject or topic” (Paquette et al. 2011). DK is therefore related to the user experiences in a specific domain. For example, domain knowledge for a teacher might include academic problems that students face during the discussion of a specific topic (including insecurities and fears), feedback about the difficulties with a topic and specific abilities that the teacher has to apply to reduce students’ fears in order to reach academic objectives.
Third, in any industry, domain knowledge experts are individuals who have reached high levels of expertise in a particular domain. They specialize in a specific problem resolution. They gain expertise doing similar tasks or resolving the same problem in different contexts, and store and apply these rules of thumb depending on the situation they need to solve. For example, teacher in programming course find constantly that students confuse the assign command (=) with the equal command found in math courses; to correct this he needs to teach students about the assign command in programming course.
To elicit domain knowledge from an expert, it is necessary to use techniques to retrieve the tacit knowledge and transform it into explicit knowledge in the form of rules (Flavell 1979, Yi-Dong, Zhong et al. 2002). This knowledge can then be standardized and applied in future similar situations.
Finally, Meta-knowledge is knowledge about knowledge, what we know about our cognitive abilities or how we learn. We focused on a teacher’s knowledge, cognitive tools, abilities,
limitations and the use of strategies (Valot and Amalberti 1992). It identifies persons, variables or values that intervene in the activity as well as strategies, steps and actions needed to accomplish the activity. If we consider the academic context, MK include how students learn, how a specific topic is taught, what is the easiest and what is hardest topic for students to learn. To identify meta-knowledge, three questions have to be answered (Flavell 1979, Yang, Yu et al. 2009): why, what and how. The why identifies the reasons associated with performing a specific activity; the what defines the objective to be reached in performing an activity; finally, the how refers to the strategy or steps required to accomplish the activity. The following example shows how to apply these questions in relation to the academic evaluation. If the activity is “to make a student evaluate a teacher by filing out a survey” to obtain the relevant meta-knowledge, we will ask the following questions: why is this evaluation done?; what concept do people interested in the results of this questionnaire learn?; how are learned concepts going to be used?. In this process of identifying meta-knowledge, teachers have to talk about why they make students do specific activities, what activities and concepts they do in class and how the teacher tries to have those activities done in the best way. These activities are related to each of the survey questions. In this research, we called the survey questions attributes to standardize the terminology.
1.5 Interestingness: Objective, Subjective and Semantic measures and Actionability
The interestingness of a pattern reveals how interesting it is for the user. According to Geng and Hamilton (Geng and Hamilton 2006), Interestingness is determined through nine criteria: conciseness, coverage, reliability, peculiarity, diversity, novelty, surprisingness, utility and actionability. These criteria are classified in three categories: objective, subjective and semantic. Namely, conciseness, coverage, reliability, peculiarity and diversity are considered objective criteria and are measured using objective measurements. Some of these objective measurements are support, confidence and lift. Whereas, novelty (also known as usefulness) and surprisingness (also known as unexpectedness), are considered subjective criteria and are measured using the user’s domain and his background knowledge. Conversely, utility and actionability are considered semantic measures. Semantic measure takes into account the
17
semantic of a pattern and the explanations that the user can give about this pattern. It is possible that the interestingness is represented by some of the above mentioned criteria, for example, something could be interesting if it is unexpected and actionable (Silberschatz and Tuzhilin 1995, Silberschatz and Tuzhilin 1996). Objective, subjective and semantic measures try to measure the Interestingness of a pattern but from different points of view. Additionally they are used to sort patterns, using interesting objective measures first and then subjective measures (Lenca, Vaillant et al. 2007).
In AKD, patterns are measured using two types of interestingness measures: objective and subjective measures.
We defined objective and subjective interestingness measures in detail as follow: Objective measures concern technical interestingness (Bing, Wynne et al. 2000)–rule structure, predictive performance, and statistical significance–of the data. Researchers have proposed many objective measures, and have studied their characteristics and properties (Tan, Kumar et al. 2002), (Geng and Hamilton 2007); other researchers have studied the suitability of a measure with respect to a certain domain (Xuan-Hiep, Guillet et al. 2006). Among these metrics, we applied in our research three of these measures: support, confidence and lift. Subjective measures are related to the needs and interests of the user and the domain (Bing, Wynne et al. 2000, Oliviera Rezende Solange 2009). Many authors have proposed subjective measures (Bing, Wynne et al. 2000, Geng and Hamilton 2006), (Silberschatz and Tuzhilin 1996) (Geng and Hamilton 2006); Our research is based on the subjective and semantic criteria of Gen and Hamilton, and on Oliviera et al.’s knowledge criteria (Oliviera Rezende Solange 2009).
Gen and Hamilton refers a pattern as Usefulness if it is not outstanding but could help the user in decision making and is also called as accepted belief; a pattern is considered Unexpected if it is completely new to the user also mentioned as a contradicted belief; Utility is the characteristic of a pattern that helps to reach a specific objective; finally, actionability measures the ability of a pattern to suggest taking some concrete action for user advantage.
Oliviera et al. (Oliviera Rezende Solange 2009) proposed five knowledge categories, unexpected, useful , obvious, previous and irrelevant. Oliviera et al. stated that a pattern should fall in one of this categories; the knowledge category is selected by the user based on his knowledge about the pattern; a pattern has a range of evaluation from very well known (we can call it irrelevant) to a pattern completely new (we can call it unexpected).
We mix Gen and Hamilton criteria’s with Oliviera et al. criteria to have a wide range of knowledge categories for the user in one hand; in the other hand we use some of these criteria for the construction of our utility measure. This brings us to the second paper, where we constructed the utility measure. We explain the Utility measure in the next section.
1.6 Utility mining and utility formula
The general utility mining approach (Wang, Liu et al. 2007) states that utility mining should contained two types of utility: transactional and external utility. Transactional utility refers to the one obtained from the working database and external utility refers to additional datasets around the transactional information environment. For example, we can obtain transactional utility from students’ dataset and external utility from teacher’s surveys (as we recall teacher’s surveys are S1 and S2). The detail of the instruments S1 and S2 are in Chapter 3.
We constructed a teacher’s survey (S1) that contained five components. We give a quick glance of the components. The first component was the selection of attributes from students’ survey. From the survey’s that students filled up, the teacher selected the ones he considered the most relevant from teacher’s point of view. Then, he constructed association rules based on his selection. The constructed rules are the open association rules. The second component was the selection of attributes per areas from the students’ survey. After, the teacher chose his preferred questions per area and constructed association rules using these preferred questions as attributes. The constructed rules are the context association rules. In other words, we obtained two different evaluations for each attribute, the one obtained from the
19
complete survey and the other one obtained from selection per area. The third component was the section of the reaction to low evaluation where the teacher evaluates the actionability of the low rated questions. The fourth component was the evaluation using the knowledge categories from Oliviera. The fifth and the sixth component has already been considered in the first and second components as the construction of the open and context association rules. These components helped evaluate the perception of the teacher about the students’ survey answers.
We described how we integrated the survey components in the construction of the utility measure in the methodology in Chapter 5.
For the construction of the utility formula for association rules, if the attribute appeared in the association rule, then the attribute had a utility value. For example, if communication attribute is important for the teacher, or if the development of the audiovisual material is important, then we defined the attribute frequency when it appeared in the antecedent or in the consequent of the rule. If the attribute was more frequent in the antecedent, then that attribute was considered as predictive attribute. We placed the predictive attributes in the antecedent side of the rule. If the attribute frequency was frequent in the consequent side of the association rule, then it was considered objective attribute. For the objective attributes, we used the objective oriented utility based association mining (OOA) (Yi-Dong, Zhong et al. 2002), that focuses on the semantic sense of the attributes considered by the user. We placed the objective attributes in the consequent side of the rule.
Additionally, because it was difficult to quantify the attributes that needed improvement, we included the effort as part of the utility measure to improve the low evaluated attributes. The utility measure helped to quantify subjective attributes which were not quantifiable such as: communication, organization, and respect. We will see the development of this measure in Chapter 5.
Once we measured patterns utility based on the objective and subjective datasets, we were interested in analysed the interviews from teachers to identify the wide variety of topics teacher talks in class. This bring us to our third paper, therefore, we applied topic modeling to the interview data of all teachers and obtained categories in teachers’ interviews. We explained this in section 1.7.
1.7 Probabilistic Topic modeling and measuring the model
Teacher answered the interviews and gave their perspective during it. For the analysis of this information we applied a technique called probabilistic topic modeling to understand the relation between documents representing the interviews. Applying topic modeling we obtained the most representative topics and classified the interviews sentences into them. We asked two experts to help us classifying by hand the same sentences from the interviews to test the effectiveness of the constructing model. We applied Cohen Kappa measure to do this.
1.7.1 Probabilistic Topic Modeling.
We applied probabilistic topic modeling to the interviews from teachers. Probabilistic topic modeling are algorithms that work with statistical methods to identify the most relevant theme inside a group of documents (Blei 2012). They are also called mixed membership models in automatic content analysis methods (Grimmer and Stewart 2013). The theme or topic found by the topic modeling algorithm is a distribution of words over a fixed vocabulary (Blei 2012) where the topic is represented with the group of distributed words from the vocabulary along the documents. One of the statistical methods that topic modeling works with is LDA or Latent Dirichlet Allocation; the basic concept behind LDA is the use of joint and conditional distributions. This method is very useful when there is a group of documents with different themes or there is no categorization (Grimmer and Stewart 2013).
Using probabilistic topic modeling, the technique classified the topics among the interviews. In order to evaluate the machine classification, we asked two experts to classify too the
21
interviews ideas as the machine classification did. We used Cohen Kappa measure to evaluate how good the classification was made by our knowledge experts against the machine classification. We explained Cohen Kappa measure in next section.
1.7.2 Cohen Kappa
Cohen’s Kappa statistic is a measure for computing the inter-rater reliability coefficient, or the reliability between the opinions of two human categorizers. It is assumed that the categories should be disjoint (do not overlap) (Gwet 2015). It is used to compare the classification of a subject made by different human evaluators into different categories. It is constructed from the observed and expected frequencies on the diagonal of a square contingency table.
In Chapter 6, we explained deeply the use of LDA to obtain the categorization of themes and the use of Cohen Kappa measure to evaluate the relation between human categorizers’ opinions.
1.8 Conclusion of the review
After the analysis of the literature reviewed, we decided to use the framework from D3M methodology along with techniques from data mining. In our first contribution, we use objective and subjective information; part of the analysis includes experts’ knowledge that helps better understand the patterns obtained from the data mining process. For this reason, we needed a methodology that includes the use of knowledge. In this case, Crisp-DM or SEMMA methodologies were not appropriate since they only work with objective datasets; knowledge or meta-knowledge information could not be incorporated to the analysis. We chose the Actionable Knowledge Discovery framework, AKD, specifically PA-AKD, Post analysis based AKD, since it can handle objective and subjective aspects of the problem in a separate way, working with only one data source. Post Analysis Based AKD works with the knowledge and the meta-knowledge of the problem and proposes a mean to incorporate the experts in the loop; it also uses objective and subjective measures to evaluate the quality of
the patterns retrieved. To filter out our association rules, we use three objective measures, support, confidence and lift because they allow to analyze the attributes that are in the consequent and in the antecedent of the association rule; for the subjective measure we used unexpected, usefulness, obvious, previous, irrelevant, and actionable as actionable knowledge categories.
For our second contribution, we constructed our utility formula using two types of utility, transactional and external utility. Additionally, we used the frequency of the attributes presented in the association rules and focused in the fulfillment of the partial utility value from each attribute. We retained some concepts of Objective Oriented Utility Based Association Mining and identified objective and predictive attributes to generate association rules to be evaluated with the utility measure. Another consideration for the utility measure is the application of the analogy of a machine lever example to obtain the Effort teacher needs to improve an attribute. We based our utility formula on these elements.
Finally, for our last contribution, we used probabilistic topic modeling algorithms to obtain some clusters of words that represent topics; we applied LDA with Gibbs Sampling. LDA looks for the posterior distribution between the words in the interviews and the hidden topics. For the comparison between the interviews and the topics, we used Vector Space Model because it is the baseline model applied to compare text documents without using complexes approaches such as Natural Language Processing. We used Latent Semantic Indexing (LSI) to measure the Cosine similarity between a topic vector and an interview-paragraph vector. Cosine Similarity measure is a standard similarity measure in Vector Space Model problems. We worked with two human experts to test the classification of the model. We applied Cohen Kappa measure to evaluate the similarity among people and the model classification as well as between experts’ classifications. Cohen Kappa is one of the most commonly used to measure inter-expert agreement.
CHAPTER 2
GENERAL METHODOLOGY
This chapter presents the general methodology and the objectives we defined during the research. In the research, we used the students’ surveys and teachers’ surveys and interviews. We used machine learning tools to discover patterns, create a utility measure and apply LDA to understand better teachers’ interviews.
2.1 Methodology overview
The objective of this research was to create a methodology to integrate the objective analysis of students with the subjective considerations of teachers. With this objective we applied D3M that uses objective and subjective data sets. The D3M is based on objective, subjective and semantic interestingness measures. In order to achieve the aim of this thesis, we accomplished the general objective focusing the following three specific objectives:
• To build a representation using students’ and teacher’s perceptions based on actionable knowledge
• To construct a utility semantic measure to evaluate the usefulness of association rules within the model
• To discover new topics from the analysis of interviews to improve the teacher evaluation
We present in Figure 2.1 the conceptualization of our research objectives; the figure shows the data sources we used: teacher survey, students’ survey and the teachers’ interview. The figure includes the three specific objectives: the first objective is the building representation, the second one is the semantic measure and finally the third one is the new topic discovery; each objective is represented using circles with a number
Figure 2.1 Methodology and Research objectives
To obtain the model resulting from Objective 1, the domain driven data mining methodology integrates the data mining analysis, the domain knowledge and the meta-knowledge. To achieve the first objective, we used the data from two datasets, students’ surveys and the teacher’s survey. For the second objective, we used teachers’ surveys and generated the new dataset to feed Apriori. Then, we obtained association rules that contain predictive and objective questions that belong to a specific professor. Finally, to accomplish the last objective, we used teacher’s interviews and the information from the 23 questions. In this last objective, we applied the topic modeling to construct the dictionary from the 23 questions, evaluated the results from the model and from the human evaluators and obtained the new topics. We will explain in detail each objective in the next section.