Université de Montréal
Dietary patterns associated with diet quality among First
Nations women living on reserves in British Columbia
par Sandrine Mutoni
Département de nutrition, Université de Montréal Faculté de médecine
Mémoire présenté à la Faculté de médecine en vue de l’obtention du grade de Maîtrise
en Science (M.Sc. – Nutrition)
Mai, 2012
Faculté des études supérieures et postdoctorales
Ce mémoire intitulé :
Dietary patterns associated with diet quality among First Nations women living on reserves in British Columbia
Présenté par : Sandrine Mutoni
a été évalué par un jury composé des personnes suivantes :
Irène Strychar, président-rapporteur Olivier Receveur, directeur de recherche
i
Résumé
Les Indigènes canadiens vivent une rapide transition nutritionnelle marquée par une consommation accrue des produits commercialisés au dépit des aliments traditionnels. Ce mémoire cherche à identifier les patrons alimentaires associés à une meilleure alimentation des femmes autochtones vivant dans les réserves en Colombie Britannique. L’échantillon (n=493) a été sélectionné de l’étude ‘First Nations Food, Nutrition, and Environment Study’. L’étude a utilisé des rappels alimentaires de 24 heures. Pour identifier les patrons alimentaires, un indice de qualité alimentaire (QA) basé sur 10 éléments nutritionnels (fibre alimentaire, gras totaux/saturés, folate, magnésium, calcium, fer, vitamines A, C, D) a permis de classifier les sujets en trois groupes (tertiles). Ces groupes ont été comparés sur leur consommation de 25 groupes alimentaires (GAs) en employant des tests statistiques non-paramétriques (Kruskal-Wallis et ANCOVA). Une analyse discriminante (AD) a confirmé les GAs associés à la QA.
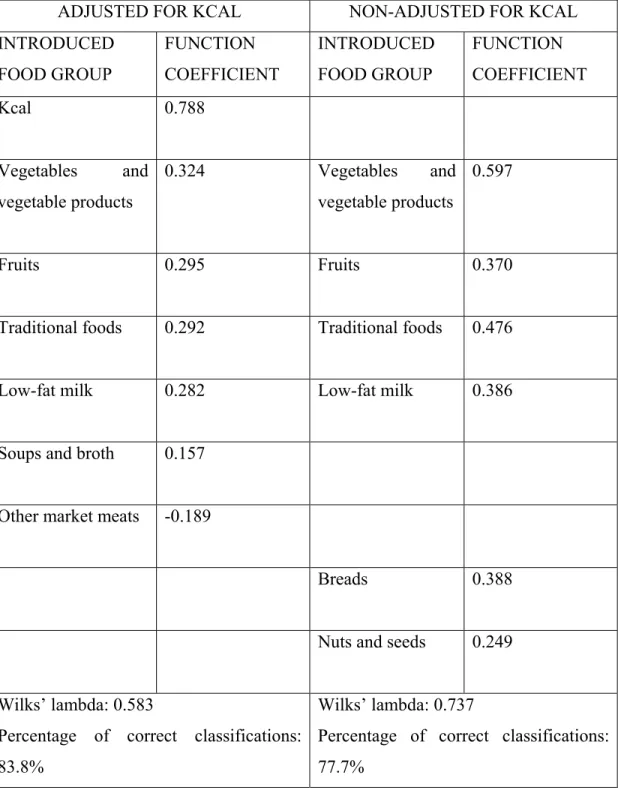
La QA des sujets était globalement faible car aucun rappel n’a rencontré les consommations recommandées pour tous les 10 éléments nutritionnels. L'AD a confirmé que les GAs associés de façon significative à la QA étaient ‘légumes et produits végétaux’, ‘fruits’, ‘aliments traditionnels’, ‘produits laitiers faibles en gras’, ‘soupes et bouillons’, et ‘autres viandes commercialisées’ (coefficients standardisés= 0,324; 0,295; 0,292; 0,282; 0,157; -0.189 respectivement). Le pourcentage de classifications correctes était 83.8%.
Nos résultats appuient la promotion des choix alimentaires recommandés par le « Guide Alimentaire Canadien- Premières Nations, Inuits, et Métis ». Une consommation accrue de légumes, fruits, produits laitiers faibles en gras, et aliments traditionnels caractérise les meilleurs patrons alimentaires.
Mots-clés : patrons alimentaires, qualité alimentaire, indice de qualité alimentaire, analyse
Abstract
Indigenous Canadians are going through a rapid nutrition transition marked by an increased consumption of market foods and a decreased intake of traditional products. The aim of this research is to identify dietary patterns associated with a better diet quality among Indigenous female adults living on reserve in British Columbia. The sample (n=493) was selected from the First Nations Food, Nutrition, and Environment Study. The study used 24-hour food recalls. To identify dietary patterns, individuals were classified in three groups (tertiles) according to points obtained on a dietary score (based on Dietary Reference Intakes for dietary fiber, total fat, saturated fat, folate, magnesium, calcium, iron, vitamins A, C, D). The tertiles were compared for their consumption of 25 food groups (FGs) using statistical non-parametric tests (i.e. Kruskal-Wallis and ANCOVA tests). A discriminant analysis was used to confirm the FGs significantly associated with diet quality.
Generally, subjects had poor diet quality since no food recall met the recommended intakes for all selected nutritional elements. The discriminant analysis confirmed that the FGs significantly associated with diet quality were “vegetables and vegetable products”, “fruits”, “traditional foods”, “low-fat dairy products”, “soups and broth”, and “other market meat” (standardized discriminant function coefficient= 0.324, 0.295, 0.292, 0.282, 0.157, -0.189 respectively). The percentage of correct classifications was 83.8%.
In conclusion, our findings support the promotion of dietary choices according to the “Eating well with the Canadian Food Guide – First Nations, Inuit, and Métis”. It is greater use of vegetables, fruits, low-fat dairy products, and traditional foods that characterizes better dietary patterns.
Keywords: Dietary patterns, diet quality, dietary score, discriminant analysis, Indigenous
iii
Table of contents
RÉSUMÉ ... i ABSTRACT ... ii LIST OF TABLES ... v LIST OF FIGURES ... viACRONYMS AND ABBREVIATIONS ... vii
ACKNOWLEDGEMENTS ... viii
CHAPTER I: INTRODUCTION ... 1
CHAPTER II: LITERATURE REVIEW ... 3
1. Introduction ... 3
2. Determination of diet quality of Canadian Indigenous populations ... 4
2.1. Nutrition-related health issues ... 4
2.2. Food choices of Indigenous Canadians: nutrition transition ... 5
2.3. Overall nutrient adequacy among Indigenous Canadians ... 8
3. Methods for measuring diet quality ... .11
3.1. Dietary indexes: the a priori technique ... 11
3.1.1. General aspects of dietary indexes ... 11
3.1.2. Food-based dietary references ... 14
3.1.3. Dietary references for nutrient-based indexes: using Dietary Reference Intakes (DRIs) as cut-offs for nutrient adequacy scores ... 17
3.1.4. Application of nutrient-based scores in defining healthier food patterns .. 19
3.1.4.1. Nutrient adequacy and “healthy” food choices ... 19
3.1.4.2. Nutrient adequacy and “unhealthy” food choices ... 22
3.1.5. The role of food diversity in diet quality scores ... 24
3.2. Statistical analyses: the a-posteriori technique ... 26
3.2.2. Cluster Analysis ... 28
3.2.3. Discriminant Analysis ... 30
3.3. Combination of methods used to identify dietary patterns ... 31
4. Conclusion ... 36
CHAPTER III: RESEARCH OBJECTIVE AND QUESTION ... 37
CHAPTER IV: METHODS ... 38
CHAPTER V: ARTICLE ... 41
CHAPTER VI: DISCUSSION ... 68
1. Contribution of food groups to diet quality... 68
2. Strengths and limits of the present research ... 74
3. Conclusion and future research ... 78
REFERENCES ... 80 ANNEXES ... ci
v
List of tables
Table 1: Socio-demographic and lifestyle characteristics of BC FN female adults living on reserves (n=493) ... 55 Table 2: List of the five main contributors to each group of the 25 food groups obtained from 24-hour recalls of BC FN female adults living on reserves (n=493) ... 56 Table 3: Absolute and adjusted intakes (g per day per person) of 25 food groups across diets of lower, mid, and higher quality among BC FN female adults living on reserves (n= 493) ... 64 Table 4: Adjusted and non-adjusted coefficients of standardized canonical discriminant functions ... 67
List of figures
Figure 1: Percentage of 24-hour recalls according to scorings of BC FN female adults living on reserves (n=493) on a dietary quality score and corresponding tertiles (i.e. lower, mid, and higher levels of diet quality) ... 63
vii
Acronyms and abbreviations
AMQI: Adolescent Micronutrient Quality Index BC: British Columbia
b.f.: butter fat
DBS: Dietary Behaviour Score DGI: Dietary Guidelines Index
DQI-I: Diet Quality Index- International DRI: Dietary Reference Intakes
FAO: Food and Agriculture Organization FN: First Nations
FNFNES: First Nations Food, Nutrition, and Environment Study FNRS: Framingham Nutritional Risk Score
HEI: Healthy Eating Index HS: Healthfulness Score IOM: Institute of Medicine MAR: Mean Adequacy Ratio
MAS: Micronutrient Adequacy Score MDS: Mediterranean Diet Score m.f. : milk fat
NAR: Nutrient Adequacy Ratio NAS: Nutrient Adequacy Score PCA: Principal Component Analysis SD: standard deviation
s.e.m: standard error of the mean
USDA: United State Department of Agriculture WHO: World Health Organization
w/: with w/o: without
Acknowledgements
I gratefully acknowledge my supervisor, Dr. Olivier Receveur, for his support and contribution to this research. It would not have been accomplished without his wise advice.
I also gratefully acknowledge Health Canada for its funding of the British Columbia First Nations Food, Nutrition, and Environment Study and all the people who participated in that project. (The information and opinions expressed in this publication are those of the
authors/researchers and not necessarily reflect the official views of Health Canada.) Finally, I would like to thank my family and any other person who supported me for this research.
Chapter I: Introduction
Nutrition-related chronic diseases, such as type 2 diabetes and obesity, are increasing among Canadian Indigenous peoples. Numerous studies done among these populations show that they are going through a rapid nutrition transition that largely explains these nutrition-related issues (Kuhnlein et al, 2004; 2007). This transition is characterized by an increased consumption of market foods and a decrease in their intakes of traditional foods. In general, when comparing their food choices to dietary food guidelines (c.f. “Eating Well with the Canada’s Food Guide – First Nations, Inuit, and Métis”), results indicate that they are not consuming the recommended daily servings for all the major food groups except the “meat and alternatives” food group (Chan et al, 2011; Garriguet, 2008; Kuhnlein et al, 1996; 2004). Furthermore, surveys that analyzed nutrient profiles of Canadian Indigenous individuals confirmed the inadequacies noted among their food choices. In fact, studies have reported insufficient intakes regarding multiple essential nutrients while other nutrients that require limited intakes are consumed in excess (Erber et al, 2010; Haman et al, 2010; Ho et al, 2008; Johnson-Down et al, 2010; Sharma et al, 2008; 2010). The way Indigenous communities acquire their food present many barriers to programs seeking to improve their diet quality (Receveur et al, 1997). Studies report limited access to traditional foods due to changes in the environment; government laws and regulations; energy, time, and cost of equipment required for traditional ways of acquiring food like fishing and hunting (Mead et al, 2010; Receveur et al, 1997). There is also limited access to certain store-bought food items with good diet quality like fruits and vegetables because they lack freshness and have high prices (Mead et al, 2010). Thus, one may question whether recommendations provided generally to the Canadian population are suitable to these specific cultures.
Many authors interested in populations that are living rapid nutrition transitions (e.g. Indigenous peoples, individuals residing in most developing countries, and immigrants) agree that public health agents should follow changes in dietary patterns of these populations, identify subgroups suspected to have diets with poorer quality, and thus
improve the prevention of nutritional-related problems like chronic diseases (Delisle et al, 2009; Satia, 2010; Tucker, 2010). In fact, even though nutritional epidemiology started with research on relationships between single food components and single health outcomes, nutritional epidemiologists now encourage the consideration of food patterns, i.e. a combination of food components and drinks, rather than individual nutritional elements, in the study of diet quality and/or nutritional effects on health (Kant, 1996). With increasing prevalence of chronic diseases, scientists are now suggesting that a maximum of dietary components should be considered simultaneously, i.e. as an unique exposure, in evaluating diet relation to health issues (Kant et al, 1996; 2004; 2010; Tucker et al, 2007). For instance, specific dietary patterns were thus linked to coronary heart diseases (Hu et al, 2000); to cardiovascular diseases (Nettleton et al, 2009); to type 2 diabetes (Nettleton et al, 2008), and obesity (Wolongevicz et al, 2009). Researchers support this innovative methodology for many reasons: for instance, they admit that foods, and nutrients and/or non-nutrients in a given diet, have synergistic interactions (when the foods are being metabolized in the body, processed, prepared or modified in any other way), which separate analysis of effects of a single nutritional element on single outcomes ignores (Tucker et al, 2010). Another reason is that the effect of single nutritional items on health may be too small to be seen when taken individually. Jones-McLean et al (2010) say that this is mostly the case for diet-cancer relationships. In fact, associations are found between prevention of many cancers and high consumption of fruits and vegetables; but isolating single nutrients and/or non-nutrients from the studied fruits and vegetables fails to ascertain those diet-cancer links (Baglietto et al, 2011; Hanf et al, 2005; Willett et al, 1994).
In summary, dietary patterns can help in operationalizing nutrient-based recommendations as well as departure from these recommendations (Hu et al, 2000; Jones-McLean et al, 2010; Pryer et al, 2001). We used this technique to identify the food patterns linked to a better diet quality among First Nations female adults living on reserves in British Columbia, Canada.
Chapter II: Literature review
1. Introduction
Nutrition transition is currently observed all around the world. Romaguera et al (2008) summarizes it as noteworthy changes in diet and activity patterns towards the “Western diet”; i.e. “a high-saturated-fat, high sugar, refined-and-processed foods and low-fiber diet and low physical work and leisure activities”. It is mostly a major concern for developing countries that not only face important migrations from rural regions to urban areas but also are submerged by influences from “western” countries (Becquey et al, 2010; Duravo-Arvizu et al, 2008). This process also characterizes some Indigenous populations, such as those residing in Canada (Kuhnlein et al, 2004; Kuhnlein et Receveur, 2007; Receveur et al, 1997). Thus, Canadian Indigenous peoples need strategies that would limit dietary shifts to diets of poorer and poorer quality.
In studying nutrition-related issues, researchers are favouring the determination of dietary patterns rather than effects of a single nutritional element on a given single outcome (Kant et al, 1996, 2004; Tucker et al, 2010). There are two distinct methods of defining food patterns: a priori opposed to a posteriori methods. Numerous scientists advance that the a priori technique, which evaluates the degree to which individuals or populations adhere to existing dietary guidelines, is simpler and more appealing. In fact, targeted populations would be more familiar with readily available, more sound recommendations that are developed specifically for them by truly qualified experts, i.e. mostly nutritionists (Hu et al, 2000; Reedy et al, 2010). The a posteriori technique requires statistical analyses after data collection on food and beverages consumption (Tucker, 2010; Kant et al, 2004).
This literature review presents the overall current diet quality of Canadian Indigenous populations on one hand and on the other methods utilized to determine dietary patterns among populations.
2. Determination of diet quality among Canadian Indigenous populations 2.1. Nutrition-related health issues
Prevalence of chronic diseases among Canadian Indigenous peoples has increased with an alarming pace. Scientists support that these diseases are largely correlated to these populations’ food choices (Sharma et al, 2008).
Kuhnlein et al (2004) did numerous investigations with Arctic Canadian Indigenous communities: for instance they evaluated the interconnection between nutrition transition, dietary patterns and obesity in three different communities; namely the Yukon First Nations, the Dene/Métis and the Inuit. They did not announce any gender dissimilarities in traditional food consumption, except for the 20- to 40-year-old age group (where men ate larger portions) and for Inuit aged 41 to 60 years. Moreover, when checking for obesity (i.e. Body Mass Index (BMI) equal or above 30Kg/m²) they said that it was more important among Inuit adults than Yukon First Nations; and BMI increased with age. However, even though consumption of traditional foods increased somehow with age within BMI groups, there were no significant associations between traditional food intakes and BMI within age groups for all communities.
Ho et al (2008) analyzed factors that predisposed First Nations to type 2 diabetes and observed that this population was eating high amounts of fat and sugar but low amounts of fibre because they were purchasing more non-nutrient dense foods and frying even healthy foods like fish. They also said that most of the male respondents were older men living by themselves who had unhealthy food preparation techniques. Food preparation was again a problem for younger people who felt less self-efficacious towards traditional practices because family structures were changing, i.e. there were less multigenerational households; and so, learning through role modelling and/or observation of older generations had lost solid ground. It was also noted that both employed and unemployed people faced
nutrition-5
related problems: the former obliged to leave the reserve they lived on and ended up eating unhealthy products from restaurants while the latter suffered more from food insecurity.
It was also published that big industrial companies invade Canadian Indigenous peoples, pollute the lands and waters that nourish them and so limit their access to safer foods (Chan et al, 2011).
Generally, changes observed in Indigenous populations’ food choices, which include more commercial foods and less traditional foods, explain these nutrition-related health problems.
2.2. Food choices of Indigenous Canadians: nutrition transition
Experts wrote extensively on nutrition transition in Indigenous cultures (Kattelmann, 2009). As a matter of fact, Kuhnlein and Receveur (1996) sought to identify determinants of Canadian Indigenous peoples dietary choices and classified them into three categories: food availability, cultural preferences and biological needs. They characterized these populations as communities that went through colonization but still distinguish themselves from the dominant societies they live in by fighting to keep their unique identity, i.e. their pre-colonial cultural practices, their social institutions, etc. Precisely, they maintain a special relationship with nature, which is regarded as a gift from the “Creator” and provides most of the things they consume, i.e. traditional foods. For instance, in Canada, hunting (i.e. consumption of birds and mostly terrestrial mammals such as caribou and moose), fishing (i.e. intake of fish like whitefish, salmon, char and trout) and gathering plants (e.g. intake of cloudberries and crowberries) still play key roles in nourishing households; so much so that many studies discovered more than one hundred wildlife species of animals, fish and plants being harvested (Kuhnlein et al, 2004; Kuhnlein and Receveur, 2007). But Indigenous peoples are going through rapid nutrition transitions where traditional foods are
being replaced by market items with less nutritious values.
Kuhnlein et al (2004) surveyed the Canadian Arctic areas and declared that from pre-colonial times until the turn of the 20th century dietary energy came 100% from wildlife resources; however, nowadays that amount has dropped to 10-36%. Actually, despite having access frequently to poor quality and yet very expensive groceries due to remoteness, these societies choose consuming provisions from stores because they are readily available, i.e. already prepared, and processed.
In addition, changes in social networks, like diminished transfer of cultural knowledge from older generations to younger ones, aggravate that shift (Kuhnlein et al, 2004). In fact, Kuhnlein and Receveur (2007) compared the intake of traditional and market foods in some communities located in the Yukon and the North-western Territories (5 communities) and noticed that on average Dene children (i.e. 10-12 year-olds) got only 4.5% of their energy intake from traditional foods while that portion increased to 15% for teens (i.e. 15-19 year-olds) and 28% for adults. Dene/Métis and Yukon children all taken together had similarly a poor consumption of traditional items. Another worrying factor was the high intake of animal-source products since they may contain too much saturated fat. It corresponded to 15% of total energy for those children and reached 35-37% for adults.
Sharma et al (2010) observed that Arctic Inuit (aged between 19 and 87 years) from two communities in Nunavut (i.e. one of the three territories in northern Canada) consumed more market foods than traditional foods. In fact, the most frequently eaten foods reported were coffee, white bread, sugar, juice, tea, butter or margarine; i.e. all purchased from stores. Precisely, sausages and lunchmeats, chips, pizza, and butter and margarine represented 25% of total fat in the diet while traditional foods corresponded to 14% of total fat. Sweetened juices and drinks like soft drinks represented above 30% of carbohydrates in the diet. These drinks in addition to sugar itself represented 73% of sugar consumption.
7
Although not being high in fibre, chips contributed 8% of fibre intake. Nevertheless, traditional foods still provided 41.3% of protein consumption and 41.2% of iron intakes.
Receveur et al (1997) showed not only gender variations in food sources but also variations among generations too. For instance, he noted that women opted more for grains to meet their energy requirements while men went for market meat (and more fat and sweets); and these divergences became more flagrant in older people. Older generations had certainly diets with less dairy products, fruits and vegetables, and mixed dishes; but they consumed more traditional fish and land mammals. In the same survey, Receveur et al (1997) observed that some community limited traditional food intakes were associated with community characteristics, namely population size, road access and availability of affordable market food, proximity to animal migration routes, and fishing and hunting practices currently employed. So, environmental barriers can not be overlooked as they are crucially linked to all elements that are needed for acquiring traditional foods, such as energy, time, financial expenses (for example in regards with equipment for hunting/fishing), and cultural practices.
Haman et al (2010) again studied the relationship between type 2 diabetes (and obesity) and dietary factors in First Nations. They stressed the importance of traditional foods in reducing the risk of having diabetes among a Northern Ontario (Canada) Indigenous community (i.e. the Oji-Cree of the Sandy Lake) but also in the sharing and the maintenance of their identity, their social norms and their spiritual practices. They also presented the threats rendering viability of those foods unsustainable, i.e. decreasing knowledge, economics, availability across the lands, land access, etc.
These shifts in food choices may negatively affect the adequacy of numerous nutritional elements among Canadian Indigenous populations.
2.3. Overall nutrient adequacy among Indigenous Canadians
Inadequate food choices result in insufficient nutrient intakes. This aspect is important in these cultures marked by considerable nutrition transitions, even the Arctic inhabitants who occupy the farthest regions of North America and so are thought to still rely on traditional foods the most. This is illustrated by considerable amount of research done in Baffin Island: for instance, a study conducted among the Inuit population showed that intake of nearly all considered nutrients did not match the corresponding Recommended Dietary Allowances (Kuhnlein et al, 1996). In fact, only 46% of the examined individuals consumed between 66.6% and 100% of their energy requirements; while 37.9% exceeded them. Protein and iron intakes were above recommendations for 93.4% and 87.4% people respectively. The greatest elements of concern were calcium and vitamin A: 44.5% and 50.3% of the sampled Inuit consumed 50% of the recommended intakes, respectively; and only 21.8% and 19.8% of the sample took 66.6% to 100% of those recommendations, respectively. Other surveys confirmed these nutrient inadequacy tendencies: in general, whenever macronutrients were examined, the researchers agreed that compared to market products, traditional foods allowed people to have high protein consumption because of increased intakes of meat (Receveur et al, 1997). This resulted again in great intakes of iron and zinc due to importance of their bioavailability in meats. Such diets also improved the status of many other essential micronutrients, namely vitamin D, vitamin E, riboflavin, vitamin B6, copper, magnesium, manganese, phosphorus, potassium, and selenium. However, they provided less vitamin A, vitamin C, folate and fiber at least for certain communities like the Canadian Inuit who still had better vitamin D intakes (Kuhnlein et al, 2004).
Kuhnlein and Receveur (2007) justified improved vitamin C and folate in market foods with dietary fortification. Moreover, as for the Baffin Island Inuit, calcium and fibre were further found to be largely insufficient in other Inuit communities, and also in the Yukon and Dene/Métis populations. All these societies had similar trends for high sodium intake,
9
which worsened when more market items were present in the diets. These patterns supplied also greater quantities of carbohydrates, total fats, sucrose, saturated fats and polyunsaturated fats. The rise in sucrose and saturated fats consumed was more noticeable among the young (Receveur et al, 1997).
Downs et al (2009) brought attention to nutritional preoccupations of Canadian Indigenous Cree children (in grades 4 to 6) living in northern Québec: 29.9% were found to be overweight and 34.4% obese with only 19.1% consuming at least two servings of milk and 98.5% with fewer than five servings of fruit and/or vegetables. Three percent of total energy came from traditional foods and were crucial contributors to iron and zinc intakes. According to the three-day dietary records, 77.6% ate at least one restaurant meal and 18.6% three or more (overall restaurant meals consumed ranged from 0 to 5). In comparison, they announced that 25% Canadian children (from the general population) ate fast foods on any given day. This explained in part increased intakes of total fat, saturated fat, and calcium but low consumption of protein. Zinc, calcium, and vitamin D intakes were inadequate. In conclusion, there was coupling of healthy or unhealthy foods, e.g. households with more fruit and vegetables had also more milk while those with more sodas had more potato chips too. House crowding was not associated with the diet (but like low income and/or poverty, it was a risk for inadequate health.
Another study done on diets of Indigenous children (i.e. Inuit aged 3 to 5 years) showed that energy-dense foods (i.e. high-sugar and/or high-fat foods) provided 35% of energy consumption while 8.4±13% of energy intake came from traditional foods (Johnson-Down et al, 2010). When children with no, low, or high traditional food intakes were compared, those with no consumption had lower intakes of protein, iron, zinc, and higher intakes of carbohydrates. The group with higher traditional food intakes had higher consumption of cholesterol, vitamins A and D, and magnesium. When fibre intake was energy-adjusted, overweight children had lower intake than normal-weight children (yet, the two groups
consumed similar amounts of vegetables and fruits, fruit juice, and high-sugar soft drinks and punches, and traditional foods).
Sharma et al (2008) tested a food-frequency questionnaire that would serve in determining food intakes and their relationship to chronic diseases in Canadian First Nations living in northern Ontario. They compared non-First Nations populations residing in the same area (i.e. from the Canadian Nutrition Survey/Ontario Food Survey) and observed that First Nations consumed more energy from fat (for women the proportion was 33% versus 32.2% and for men 35% versus 31.6%). In addition, lower vitamin intakes were reported except those of vitamin B12 (due to high intakes of fish and other wild foods but not enough fruit, vegetables and dairy). However, percent energy from protein was similar (meat and alternatives were above national recommendations). The paper cited studies reporting 15% higher energy intake among the indigenous populations as a result of more traded foods (e.g. tea, sugar, flour, lard, etc) being used.
Sharma et al (2010) continued the development of a dietary tool, i.e. a quantitative food-frequency questionnaire, which would help in monitoring nutritional transitions among Indigenous Canadians. They did a cross-sectional study among Inuit living in Nunavut. The results showed that the percentage of energy from protein was high with values of 21% for men and 20% for women. Mean daily fibre intakes of 9g for men and 8g for women were again low when compared to recommended adequate intakes of 38g for men and 25g for women. Intakes of vitamins A, D and E, and folate were also inadequate. Mean daily intakes of calcium were 467mg for men and 327mg for women and thus did not reach the recommended adequate intake of approximately 1000mg. For iron intakes, men consumed much higher amounts than the recommended intake due to high consumption of traditional foods (mainly red meat); however, women consumption failed to meet the recommended intake.
11
In short, intakes of many foods/nutrients for Canadian Indigenous peoples are far from being satisfactory and specific analytical techniques of diet quality that will help to better understand these issues, thus allowing promotion of appropriate dietary choices are needed.
As mentioned earlier, numerous authors wrote on the multiple functions of food patterns, notably in the study of dietary quality of individuals/populations. The following part presents some of those studies that researched the two techniques used to identify dietary patterns. For the a priori method, the chosen studies are mainly relevant to Canadian populations and to the method used in the present research, i.e. nutrient- versus food-based indexes. For the a posteriori method, there is firstly a quick presentation of studies that focused on the two mostly used techniques and on diets that are relevant to Canadian populations. Then, this is followed by a presentation of all studies found on the statistical method of identifying dietary patterns used in the present research.
3. Methods for measuring diet quality
3.1. Dietary indexes: the a priori technique 3.1.1. General aspects of dietary indexes
Kant et al (1996) presented three methods of constructing dietary indexes: indexes solely based on nutrients, those including foods or food groupings and finally those combining all these constituents. Numerous papers have been written on these a priori methods that combine either foods or food groups with nutrients. For example, the USDA Center for Nutrition Policy and Promotion, seeking to monitor dietary modifications among the American population, established the Healthy Eating Index (HEI) (Guenther, 2008; Wirt et al, 2009). On one hand, this original HEI covered food groups at the base of national nutritional recommendations, i.e. total fruit, total vegetables, total grains, milk (soy beverages included), and meat and beans (thus including meat, poultry, fish, eggs, soybean items except beverages, nuts, seeds and legumes). On the other hand, total fat, saturated fat,
cholesterol, sodium, and diet variety also constituted the HEI. Scoring ranged from 0 (undesirable) to 100 (best) points (from 0 to 10 for each component). Since then the HEI has on several accounts been slightly altered to better reflect the American population diet, e.g. it was changed to give the Alternative HEI, which, unlike the original HEI, used more detailed dietary recommendations within its food group components and acknowledged health benefits of unsaturated fats (McCullough et al, 2006); and to be suitable to other populations, e.g. the HEI-C was established for Canadians and was based on Canadian age- and sex-specific dietary recommendations (Shatenstein et al, 2005; Woodruff et al, 2009).
Seymour et al (2003) wrote on the Diet Quality Index (DQI) which again took foods and nutrients as an ensemble: six nutrients (total fat, saturated fat, cholesterol, protein, sodium and calcium) were added to two food groups (fruits/vegetables and grains) to define the DQI. Points allocated to each component were 0 when recommendations were met, 1 when they were almost met or 2 when they were not. A revised version of the DQI, termed as the DQI-Revised, was put together to better reflect renewed dietary guidelines (Haines et al, 1999).
Interestingly, these two American scores (i.e. the Healthy Eating Index and the Revised Diet Quality Index) led to a fully food-based dietary index. Indeed, when researching efficient tools for dietary monitoring or surveillance, McNaughton et al (2008) appreciated advantages scores based only on foods had on those solely based on nutrients and/or non-nutrients because the former better maintained the complexity of dietary intakes and could also give information on nutrients and non-nutrients in their food components. From there, they tempted to create a food-based dietary index specific to the Australian Adult population, the Dietary Guidelines Index (DGI). Basically, fifteen items related to recommendations on intakes of various food groups, nutrients, and drinks (i.e. vegetables and legumes, fruits, total cereals, meat and alternatives, total dairy, added sugar, sodium, saturated fats, and alcoholic) constituted the DGI. Data from a food habits questionnaire
13
was compared to age- and sex- specific recommendations from the Australian Guide to Healthy Eating for essential food groups (i.e. vegetables, fruits, cereals, meat and alternatives) and a group called 'extra foods' which is rich in non-required nutrients (e.g. too much fat, sugar and salt). In other terms, good dietary quality came from food groups that had a wide variety of items and included whole-grain cereals, lean meat, and low-fat dairy. Diet quality was precisely quantified by a scoring from 0 to 15 for each of the fifteen elements for a total of 0 to 150 points (the score increased as the participants met the recommendations). As a result, higher scores corresponded to lower intakes of energy, total fat, saturated fat, and monounsaturated fat but higher consumption of fibre, β-carotene equivalents, vitamin C, folate, iron, and calcium for both men and women (p<0.05 and energy-adjusted nutrient intakes showed similar results). Additionally, higher scores were related to increased intakes of protein, total sugars and carbohydrates.
In other cases, researchers have opted for indexes solely based on nutrients. Wolongevicz et al (2010), in order to better understand the incidence of obesity, utilized the Framingham Nutritional Risk Score (FNRS), a dietary index validated among the famous Framingham Offspring/spouse cohort. The FNRS was presented as a combination of nineteen nutrients, namely total energy, protein, total fat, monounsaturated, polyunsaturated and saturated fats, carbohydrate, fibre, alcohol, dietary cholesterol, sodium, calcium, selenium, vitamins C, B6, B12 and E, folate and β-carotene. They added that this selection was led by the implication of these nutrients in the occurrence of cardiovascular diseases. The FNRS was given a distinguishable, sample-dependent scoring, which consisted in ranking the participants according to data collected with three-day dietary records. In other words, quantities consumed by all individuals were ranked for each nutrient as follows: certain nutrients were classified low to high, i.e. energy, protein, alcohol, total, saturated, and monounsaturated fats, dietary cholesterol and sodium, and the remaining eleven nutrients high to low; as final goal, better nourished subjects received lower ranks. The final score was an average of the ranks separately attributed to all the nutrients. Ultimately, scores
were grouped into tertiles and found to be good predictors for risk of being overweight or obese; e.g. when compared to women in the lowest tertile, the risk of those in the highest tertile was 1.76 (95%CI: 1.16 – 2.69) times higher.
The following part presents references used to assess the adequacy of nutritional elements.
3.1.2. Food-based dietary references
Many countries have developed scores for monitoring population food intakes based on nationally generalized dietary recommendations because food guidelines often suit very particular populations. That is why most indexes were built at the national level from well-known food guides. As an illustration of that, one can name the Healthy Eating Index (HEI) and its variations. The HEI was constructed originally for the American population with the United State Department of Agriculture (USDA) Food Guide Pyramid as reference. Schuette et al (1996) analyzed how effective this food guide was in assessing dietary adequacy and quality by establishing a scoring system based on the number of food groups that had at least the minimum number of servings recommended by the guide (i.e. six servings from the group of bread, cereal, rice, and pasta; three servings of vegetables; two servings of fruits; two servings from the grouping of milk, yogurt, and cheese; and two servings from the meat, poultry, fish, dry beans, eggs, and nuts group). The Food Guide Pyramid is part of a long chain of nutritional guides developed by the USDA since 1894 and that received additional upgrades mainly to be replaced by a set of slightly renewed guidelines known as MyPyramid and more recently as MyPlate. The latest guide has been depicted as a plate with different food categories, namely grains, vegetables, fruits, and protein with portions of 30%, 30%, 20%, and 20% respectively. Moreover, a circle has been added to represent a small portion of dairy. This illustration of a healthy dietary pattern has been taken as a more comprehensive message to the public rather than the previous image of the guide as a pyramid divided into five food groups (i.e. grains, vegetables, fruits, milk, and meat and beans) and a set of steps meant to recall the
15
importance of physical activity. Each division has received specific recommendations such as at least half of consumed grains as whole grains; more selection of dark green and orange vegetables; more dry beans and peas; increased variety of fruits but reduced fruit juices; low-fat milk and meat products; and better sources of oils like fish and nuts (Guenther et al, 2008).
More than one American score, that again underlie the Dietary Guidelines for Americans, have come to light. For instance, the Dietary Behaviour Score (DBS) highlighted general key behaviours picturing those healthy eating patterns rather than a combination of segregated recommendations for key nutrients, i.e. in the form of individualized numerical goals (Kant et al, 2009). The DBS featured characteristics of the diet organized into six sections: servings of vegetables per week (not counting potatoes and salads); servings of fruit per week (not counting juices); usual intake of whole-grain cereals and breads; usual intake of lean meat and poultry without skin; usual intake of low-fat dairy; and usual addition of solid fat after cooking to certain foods (e.g. Pancakes, waffles, french toasts, potatoes, rice, pasta, and meat (i.e. gravy)).
Publications showed how the HEI was altered to include recommended food patterns of other populations. For example, the HEI-C was established for Canadians (Shatenstein et al, 2005; Woodruff et al, 2009) and the Dietary Guidelines Index (DGI) for Australians (Collins et al, 2008; McNaughton et al, 2008). Instead of American guidelines, the HEI-C referred to the Canada's Food Guide for Healthy Eating while the DGI references came from the Dietary Guidelines for Australian Adults.
Reports on disease-preventing diets, which have geographical and/or cultural ties to specific regions around the globe, are numerous. Probably, the Mediterranean regimen is the most chosen one as reference and yet the most intriguing, the most variable in terms of food choices: finding its origins in Crete, it further describes many Mediterranean regions
that have recipes composed with almost the same foods, i.e. with globally equal nutritious values. This dietary pattern is attractive for including foods found to convey protection against chronic diseases like type two diabetes and cardiovascular diseases. In general, on one hand it is found to be rich in whole-grain foods, legumes, fruits and vegetables and on the other hand poor in full-fat dairy, red meat and sweets. Additional foods highly present in the Mediterranean diet are nuts, olive oil and wine. As a consequence, this pattern is limited in saturated lipids (Rumawas et al, 2009; Trichopoulou et al 1995, 2003). In 1995, Trichopoulou et al published a paper on the Mediterranean Diet Score (MDS), a tool for assessing the degree to which an individual or a population adheres to the Mediterranean dietary pattern. The MDS was changed when fish was added as one of its components (Trichopoulou et al, 2003). A nine-point scale was allocated to this original MDS which included nine food groups, i.e. vegetables, legumes, fruits and nuts, milk and dairy products, cereals, meat and meat products, fish, moderate alcohol consumption, ratio of monounsaturated to saturated lipids. So, each food group could score 0 or 1 point depending on the sex-specific median which was used as cut-off (except for alcohol intakes), i.e. for advantageous food groups like vegetables, legumes, fruits and nuts, fish, and cereal, a consumption below the median corresponded to 0; while the other “unhealthy” constituents obtained 0 when the eaten amount was at or above the cut-off. Some authors introduced a few changes to the original MDS and tested its relationships to specific health outcomes (Fung et al, 2006; Lagiou et al, 2006; McNaughton et al, 2012); while others identified other culturally defined populations with superior diet qualities, for example the Japanese or the Scandinavians (Tucker, 2010).
Improving particular health status has been pivotal in identifying high quality diets. Notably, the Dietary Approaches to Stop Hypertension (DASH) diet was created for people with high blood pressure. The DASH pattern contains more whole grains, vegetables, fruits, low-fat milk and other dairy products, poultry, seafood, and nuts; but incorporates less sodium, red and processed meats, sweets, and beverages rich in sugar. Therefore, it has
17
improved the contribution to needs of potassium, magnesium, calcium, and moderately to protein; but stands in opposite direction with regards to total and saturated fats (Bhupathiraju et al, 2011; Levitan et al, 2009). Interested in the relationship of nutrition and the incidence of heart failure, Levitan et al (2009) originated a DASH diet score with seven food/ beverages groups and a nutrient, i.e. fruits, vegetables, nuts and legumes, dairy products, whole grains, processed meats, sweetened beverages, and sodium. Quintiles were formed and allocated points from one to five as follows: for the first five components of the score, people in the highest quintile scored five while those in the lowest got one; and on the contrary, when studying the last three components subjects in the lowest quintile received five while the highest gained one point (points were for each component individually).
3.1.3. Dietary references for nutrient-based indexes: using Dietary Reference Intakes (DRIs) as cut-offs for nutrient adequacy scores
DRIs are used to estimate the probability of dietary adequacy for a given person or population (Azadbakht et al, 2005; Britten et al, 2006; Murphy et al, 2002, 2006; Schenkel et al, 2007).
Preferably, the Estimated Average Requirements (EAR), i.e. a nutrient consumption supposed to meet the requirements of 50% of the healthy individuals in a gender- and age-specific group based on a review of the scientific literature, serves as benchmark for adequacy of nutritional intakes. In other words, the risk of inadequacy is measured as the number of individuals in the population whose usual intakes are below the EAR for a group. At an individual level, the EAR is used to show how one is confident that an individual’s usual intake (experimentally determined) is below (or above) his or her particular requirement. Indeed, the probability of inadequacy is theoretically calculated by comparing the mean observed intake to the EAR. On one hand, the calculation takes into
consideration the EAR and the standard deviation of the requirement (which shows how much an individual’s requirement for a given nutrient can deviate from the median requirement (EAR) of the population); and on the hand, it considers the usual intake and the within-person standard deviation of intakes (which shows how much the observed intake can deviate from the usual intake).
Unfortunately, not all nutritional elements have an EAR; in which case an adequacy intake (AI), i.e. a recommended consumption value based on observed estimates of nutrient intake by a group or groups of healthy people that are considered to be adequate, is assessed. In that case, assessment of inadequacy is based on a statistical hypothesis test (i.e. a z-test with the standard deviation of usual intake of the evaluated nutrient), where the empirically obtained intake is compared to the AI. However, one can assume that nutrient intake is probably adequate only when the observed consumption exceeds the AI; otherwise, no conclusions can be made. Fibre has been allocated an AI in numerous studies.
Additionally, the Tolerable Upper Intake Level (UL), i.e. the highest average daily nutrient intake level likely to cause no risk of undesirable health impacts to nearly all individuals in the general population, can provide the advisable nutrient consumption. The UL is often used in examining the amount of ingested sodium.
However, there are limitations when employing DRIs to study the nutrient adequacy of a given population. As a matter of fact, if the Recommended Nutrient Intake for Canadians (RNIs) (Ghadirian et al, 1996) (also known as the Recommended Dietary Allowance (RDA) for Americans), i.e. an intake level that exceeds the requirements of 97-98% of all the individuals when requirements of the population as a whole show a normal distribution, were taken as cut-off, the group nutrient inadequacy would be highly overestimated (Murphy et al, 2002). More problematic is the ability to describe usual intakes (Institute Of Medicine, 2000).
19
Nevertheless, the RDAs are useful in calculating two additional dietary references: the Nutritional Adequacy Ratio (NAR), i.e. the nutrient content measured as percentage of the RDA and truncated at 100, and the Mean Adequacy Ratio (MAR), i.e. the average of a given number of NAR.
Most dietary recommendations for macronutrients are given as percentages of total energy consumption: the Acceptable Macronutrient Distribution Ranges (AMDRs). Thus, ranges for carbohydrates, protein, total fat, and saturated fat were 45-65%, 10-35%, 20-35%, and <7% respectively (De Souza et al, 2008).
3.1.4. Application of nutrient-based scores in defining healthier food patterns 3.1.4.1. Nutrient adequacy and “healthy” food choices
When considering major food groups from food guides, researchers mainly report the protective effects of fruits, vegetables, fish, low-fat milk, and whole grains against chronic diseases due to their better nutrient profiles (Bhupathiraju et al, 2011; Langsetmo et al, 2010; Shatenstein et al, 2005). For instance, Sodjinou et al (2009) noticed that a micronutrient adequacy score (MAS) was positively linked to the consumption of cereals, roots and tubers (and legumes and nuts).
In their study of the USDA Food Guide Pyramid as reference for nutritional quality (and adequacy), Schuette et al (1996) chose five nutrients (calcium, magnesium, iron, vitamins A and B6) in the calculation of a MAR named the MAR-5 score in order to reassess dietary quality of collected food records.
Song et al (1996) also used the MAR-5 score and evaluated the impact of the American Food Guide Pyramid on nutritional adequacy of young Americans. Considering the food groupings of the guide, they identified food patterns in three ways: the average and median
intake of each food group by all subjects (men and women separately), the percent of subjects consuming different number of servings of each food group in relation to the recommended servings, and the creation of a ‘food group score’. The score was based on the consumption of the recommended servings of the five major groups (i.e. bread, cereal, rice and pasta; vegetables; fruits; milk, cheese and yogurt; and meat, poultry, fish, dry beans, eggs and nuts) from the Food Guide Pyramid, i.e. intake of at least the recommended servings scored 1 point for a range of 0 to 5 points. The patterns obtained then were further analyzed for nutrient adequacy using multiple approaches; namely the entire consumption of macro and micronutrients, nutrient density and MAR (named MAR-5 as an average of NARs of Ca, Fe, Mg, vitamins A and B6), the distribution of food group scores (FGS) in relation to MAR-5 scores, the odds ratio of food group pattern being adequate (i.e. FGS of 0 to 4 in reference to FGS of 5), and comparison of nutrient contents of FGS of 0 to 4 and FGS of 5. A score at or above 75% on MAR-5 was estimated adequate. In fact, the average nutrient density of those with MAR-5 at or above 75% differed significantly from those with MAR-5 below the cut-off point. When comparing FGS of 0-4 to FGS of 5, distribution of MAR-5 scores also differed significantly. From the odds ratios technique, the study found that for instance when comparing FGS of 4 to those of 5 inadequate servings from grain, vegetable, fruit, dairy, and meat food groups had 3.5, 7.0, 5.0, 8.8, and 2.0 times higher chances of being inadequate respectively. Nutrient contents of diets scoring 0 to 4 on the FGS diverged significantly from those scoring 5 for all nutrients and total energy.
Dairy products have been appreciated for their richness in many micronutrients. That is why many studies have analyzed the adequacy of multiple micronutrient intakes in relation to this food group. For instance, Nicklas et al (2009) recognized the important contribution of dairy products to intakes of three micronutrients, namely Ca, K, and Mg. Using data from the 1999-2004 NHANES database and American dietary guidelines, they determined dairy consumption in terms of daily servings and related it to the three considered nutrient adequacies. Adequacies were calculated according to percentages of people with mean
21
intakes at or above the AIs for Ca and K; while the EAR cut-point method was selected for Mg. The study confirmed the necessity of dairy products for adequacies of Ca, K, and Mg: for instance, people that consumed recommended daily servings or more were more likely to have mean intakes above the AI for Ca; in addition increasing dairy servings to 3-4 would double the portion of Americans having adequate K intake. Moreover, less than 1 daily serving resulted in children aged 2-8 years meeting 160% of the EAR for Mg while individuals aged 9-18 and > 51 years required 3.0 daily servings to meet 100% of the EAR and those aged 19-50 years 2.0 daily servings for the same goal.
McGill et al (2008) conducted a similar study and compared individuals consuming recommended daily servings of dairy products (as specified by the Dietary Guidelines for Americans 2005) to those who did not in terms of their K intake. The scientists used the AI for K to determine the adequate nutrient intake. They also concluded that the mean and the median K intakes were positively correlated to dairy intakes.
Chiplonkar et al (2010) noticed the importance of evaluating nutrient adequacy of vegetarians (precisely of female adolescents who they noted had greater tendencies to vegetarianism); and developed the Adolescent Micronutrient Quality Index (AMQI), a score that referred to dietary guidelines for Americans (and particularly for Indians). Then, they determined how well it related to the micronutrient adequacy ratio (MNAR), i.e. the average of the ratios of the observed intake value to the Recommended Dietary Intake for vitamin C, β-carotene, thiamine, riboflavin, niacin, folic acid, iron, zinc, copper, and calcium. The AMQI was thus found to have positive and statistically significant correlations with micronutrient intakes and total bioavailability of iron and zinc.
Okubo et al (2011) observed that fish and meat intakes had positive and negative linkage to the risk of certain chronic diseases respectively. They then conducted a cross-sectional study among young Japanese women and analyzed the relationship between diet quality
and fish versus meat consumption. Using a diet history questionnaire they calculated the ratio of fish to meat intake and studied its relationship to other food groups consumption and other key nutrients. Results showed that a higher ratio was positively related to consumption of fish, potatoes, vegetables, fruits, pulses, dairy products, and alcoholic beverages while being negatively associated with intakes of meat, nonalcoholic energy-dense beverages, and fat and oils. The ratio was not associated with intakes of rice, bread, noodle, eggs, confectioneries, or seasonings.
3.1.4.2. Nutrient adequacy and “unhealthy” food choices
In measuring diet quality, indicators have evolved to include assessment of moderation in intakes of distinct elements (Kim et al, 2003; Liu et al, 2011; O'Neil et al 2011). There are some nutrients that the body needs in order to function correctly, but one has to keep an eye on their amounts in foods due to their positive association to many chronic diseases. In fact, dietary recommendations globally encourage individuals to limit intakes of added sugars and fats (mainly saturated and trans), sodium, and cholesterol. These elements are always negatively scored in dietary indexes. For instance, the DQI-I checks for correct total fat intake: the highest score corresponds to a consumption of total fat not above 20% of total energy intake; and the lowest score is given when that percentage exceeds 30%. Protective and harmful limits are provided for saturated fats, cholesterol, and sodium too. The DQI-I also emphasizes restriction for “empty calorie” foods, i.e. nutrient-poor but energy-rich foods like sweets, sodas, 100% fruit juices, etc.
Song et al (1996) completed their study on recommendations from the American Food Guide Pyramid looking at intakes of nutritional items to limit, i.e. added fat and sugar. They concluded that 31% of their subjects consumed the recommended fat intake of 30% or less of total energy and 61% the recommended 10% or less of total energy from added sugar. But only 4% of all individuals followed the two recommendations simultaneously.
23
Moreover, only 1% followed the two guidelines and scored the maximum 5 points on their ‘food group score’ (which evaluated diet quality from intake of five major food groups from the Guide). Thus, correlations between the FGS and intakes of added fat and sugar were weak.
Sodjinou et al (2009) found that their healthfulness score used to evaluate two distinct dietary patterns was negatively associated with the intakes of animal products, sweets and fast food.
Libuda et al (2009) evaluated the diluting effects of sugar-sweetened beverages (SSB) on nutrient contents in diets of German children and adolescents. Thus, they created scores for measuring nutrient adequacy of single nutrients and overall diet, the intake quality score (IQS) and the nutritional quality index (NQI). The former index was defined as the percentage of age- and sex-specific dietary reference values for nutrient intakes of the German Nutrition Society and inadequate intake were considered to be less than two-thirds of the reference value for each nutrient. The NQI was the harmonic mean of the IQS of all considered micronutrients, namely vitamins A, E, K, B6, B12, and C, and thiamin,
riboflavin, niacin, pantothenic acid, and folate, and Ca, Mg, Fe, P, K, and Zn. (i.e. NQI = n/Σ (1/IQS (i); with i =1 to n micronutrients.). NQI ranged from 0 to 100, i.e. 100
corresponded to a high diet quality meeting or exceeding the reference values of the studied micronutrients (values were truncated at 100 for values exceeding the reference values so that the excesses would not cover the deficiencies.). Regarding macronutrient intakes, the survey showed that SSB consumption was positively related to energy from carbohydrates but negatively associated to protein and fat intakes. However, the observed association with carbohydrate intakes was due to increased consumption of added sugars for energy from non-sugar carbohydrates decreased increased intakes of SSB. For micronutrient intakes among boys, negative associations with SSB consumption were observed for riboflavin, pantothenic acid, Ca, Fe, P, and K (with decrease of 6, 5, 6, 6, 5, and 3% respectively
according to reference values for each 1 MJ of SSB consumption). Positive correlations were found for vitamins E and C, and niacin due to SSB fortification. Among girls,
decreases of 9, 37, 8, 5, 9, 10, 6, and 9% were noticed for vitamin A, vitamin K, riboflavin, folate, Ca, Mg, P and K respectively for each 1 MJ of SSB consumption. NQI decreased by 1.4 and by 2.6 points for each 1 MJ of SSB intake among boys and girls respectively. Thus, SSB consumption had a negative impact over total diet quality and in general had a diluting effect on nutrient density of diets explained by increased energy from added sugars but decrease in the majority of required nutrients.
3.1.5. The role of food diversity in diet quality scores
On one hand, diet diversity is a major element in determining the degree to which food and/or nutrient intakes by individuals and/or populations are adequate (Fernandez et al, 2000). Thus, Kuhnlein and Receveur (2007) recognized that whenever North American dietary patterns comprised more diverse food items or groups dietary quality increased. Although many articles emphasize this idea, they employ a wide variety of methods to incorporate it in the particular indexes they build up. They also highlighted that various food sources contributed differently to food diversity: for instance, products taken from animals were not equal to those from plants in terms of nutrient densities; i.e. one animal food serving gave more nutrients than comparable amount of plant food.
Foote et al (2004) perceived this difficulty in providing a clear meaning to dietary variety that could be based on food codes, food groups or food ingredients (from decomposed mixed dishes). In other terms, they said that variety could be viewed as between-group variety (i.e. a count of unique food groups reported), within-group variety (i.e. a count of unique items within those different food groups), and/or total dietary variety (i.e. a simple count of unique foods on the report). Afterwards, they chose to briefly present the method used in the development of the HEI. For this index, diversity was thus regarded as the
25
number of food variety groups; and the USDA created a database where variety codes were attributed to each basic food (or ingredient of disaggregated complex recipes) while taking into account the commodity type (i.e. its agricultural properties) and its vitamin/mineral contents. Each code could be matched to specific Food Guide Pyramid.
Murphy et al (2006) took advantage of the HEI and defined dietary diversity in four different manners: firstly they counted the basic items consumed (i.e. commodity variety); which were followed by the USDA food codes announced (i.e. food code variety); then by a count of five Food Guide Pyramid food groups consumed (i.e. FGP5 variety); and finally they numbered the amount of foods consumed out of twenty-two Food Guide Pyramid subgroups (i.e. FGP22 variety). They further correlated these measurements to varying ways of assessing dietary quality and found correlations to be statistically significant: for energy intakes, correlations were between 0.28 and 0.46; for probability of nutrient adequacy, correlations varied from 0.43 to 0.46 for commodity and FGP22 varieties, then from 0.32 to 0.35 for FGP5 variety, and lastly from 0.22 to 0.24 for food code variety. Additional clarifications about dietary quality were made with a close look at added sugars, cholesterol, saturated fat, and sodium, (i.e. nutrients that need limited consumption); which had a weak association with dietary variety, yet statistically significant again. In final, they agreed that nutrient adequacy could be achieved by consuming at least a half-serving per day of diverse foods from the twenty-two Food Guide Pyramid subgroups. In their study on ways to measure food variety in relation to dietary quality, Murphy et al (2006) insisted in using fifteen vitamins and minerals (i.e. vitamins A, C, E, B6, and B12, and thiamine, riboflavin, niacin, folate, calcium, phosphorus, magnesium, iron, copper, and zinc) that had established DRIs in order to characterize the concept of diet quality.
In their analysis of the Australian diet with the DGI, McNaughton et al (2008) limited dietary diversity to food groups they considered to be at the core of the diets, i.e. fruits, vegetables, meat/protein, dairy, and cereals. And so, within each core food group it was
interpreted as the proportion of core foods minimally eaten once per week as a proportion of the total amount of core foods listed on the food-frequency questionnaire. Finally, the score was the summation of points (out of two) given to core food groups individually. The authors notified that this methodology was preferred to other definitions of diversity such as studies that only focus on variety in the fruit and vegetables classes or use collected data to create cut-offs like quartiles.
However, it has been advanced that promoting food variety could push people to
overconsumption (Mirmiran et al, 2006), especially in regard to nutritional factors that have undesirable effects. Indeed, individuals could see food variety as a ‘healthy’ way to
increase the number of food items they can eat and forget to limit their choices to their energy requirements and balance. This shows again how difficult it is to create dietary scores that capture well the idea of healthy/balanced patterns, i.e. food patterns that are adequate in terms of nutrient density/adequacy, macronutrient proportionality, moderation of less healthy items, and food variety.
3.2. Statistical analyses: the a posteriori technique
3.2.1. Factor Analysis/Principal Component Analysis (PCA)
Hu et al (2000) applied factor analysis which they defined as “a multivariate technique that, in a dietary context, uses information reported on food-frequency questionnaire or dietary records to identify common underlying factors (patterns) of food consumption.” to evaluate nutritional risk factors related to coronary heart diseases. They found two distinguish patterns addressed to as the “prudent” and the “western” diets. For further comparisons, they segregated each pattern into quintiles; thus noticed the degree to which the former was protective and the latter had opposite effects.
Becquey et al (2010) surveyed the effect of urbanization on dietary profiles and related health matters in developing world city (i.e. Ouagadougou). They obtained the food
27
patterns by principal component analysis (PCA), i.e. a statistical tool that enabled data reduction by creating in a multidimensional space component representing the maximum of variability between subjects. Again, one reason of this choice was that the PCA brought an advantage in the study of diet-health associations by maintaining the collinearity between nutrients or foods. In their analysis, they kept two components (or patterns) explaining 28.5% of the total variance in the data set; and identified them as the “snacking” (19% of the total variance) and “modern foods” patterns. The former had almost all food groups and largely foods consumed outside the main meals while the latter had foods opposed to traditional meals and local snacks. Thus, it was not surprising that one unit increase in the “modern foods” score was positively correlated with the risk of being overweight or being obese. However, no correlation existed between the above health risks and the “snacking” score after consideration of confounding factors.
In 2008 and 2009, Nettleton et al conducted two separate surveys with participants of the Multi-Ethnic Study of Atherosclerosis. In the oldest research, they tried to shed light on the impact of dietary behaviours on incidence of type 2 diabetes and defined four food patterns using PCA (added to one (a priori) low-disease risk, author-defined dietary pattern, that was summarized by a weighted sum intake (in terms of servings per day) of whole grains, low-fat dairy, coffee, vegetables, nut and seeds positively scored on one side [+1 each] and on the other red and processed meat, high-fat dairy, and soda scored negatively [- 1 each]). The four components from PCA were named “fats and processed meats”, vegetables and fish”, “beans, tomatoes and refined grains”, and “whole grains and fruit”; and had -0.52; 0.05; -0.17; and 0.63 for correlations with the low-disease risk, author-defined pattern. In a model that adjusted for energy intake, study center, age, sex, race-ethnicity, education, physical activity, current smoking status, smoking pack-years, and weekly dietary supplement use, the “beans, tomatoes, and refined grains” factor explained the greatest risk to diabetes with 18% increased risk (for one-standard deviation increase in the score) and the “whole grains and fruit” had the least risk for diabetes with a 15% reduced risk (for
one-standard deviation increase in the score). Also, food group taken individually were not independently related to risk of diabetes. In their most recent examination, they focused on incidence of cardiovascular diseases (CVD) while keeping the four identifications of nutritional patterns via PCA. Among their new findings was the fact that, after adjustment for energy intake and the other early-mentioned socio-demographic and lifestyle factors, subjects in the lowest “fats and processed meat” quintile and at the same time in the highest “whole grains and fruit” quintile had 72% decreased CVD risk with comparison to those simultaneously in the highest “fats and processed meat” and in the lowest “whole grains and fruit” quintiles.
Since PCA defines dietary patterns through correlations of reported food intakes, it does not give the prevalence of those patterns in the population under examination. In reality, another statistical tool (i.e. cluster or hierarchical analysis) is more useful for that purpose because its goal is to create relatively homogenous groups of individuals according to specific dietary attributes.
3.2.2. Cluster Analysis
Quatromoni et al (2002) followed an all-female cohort from the Framingham Offspring/spouse Study and investigated the associations between weight problems, i.e. being overweight, and dietary patterns. Although an analysis similar to factor analysis was firstly applied with the exception of getting non-overlapping groups; food profiles were mainly obtained from cluster analysis. Precisely, from 42 food categories, 13 food groups were statistically computed according to the level of frequency they were eaten, i.e. foods in the same group were consumed with a comparable daily frequency (e.g. reports of higher intakes of skinless poultry were associated with reports of higher intakes of other low-fat foods like fish and whole grains). After this method, cluster analysis was used to separate the women into groups with regard to the differences in their consumption of the 13 food
29
groupings. In the end, five clusters were retained and labeled as follows: “Heart Healthy” (i.e. the cluster with more servings of vegetables, fruits, low-fat milk, and other low-fat and fibre-rich foods but less diet beverages and firm vegetable fats); “High Fat” and “Empty Calories” clusters (i.e. the two clusters with more animal and vegetable fats, sweets and desserts, meats, and mixed dishes); “Light Eating” and “Wine and Moderate Eating” (i.e. the two more moderate eating clusters with higher amounts of beer and poultry with skin for the former and higher intake of wine for the latter). Cluster differences in food selection were mirrored in nutrient profiles (e.g. the “Heart Healthy” cluster consumed the least quantities of fat, saturated fat, and cholesterol; but had higher intakes of carbohydrate and fibre and overall more micronutrient density). They were again noticed in other characteristics and behaviours (e.g. compared to the “Heart Healthy” women, the “Empty Calorie” women were younger and less physically active; and presented an absolute increase of 17% in the risk of developing overweight, slightly diminished after adjustment for a couple of factors). These food patterns have been widely utilized in other investigations of dietary effects on health. Pencina et al (2008) reproduced these five patterns using the same methodology but they also included food choices of the male cohort. Men again were characterized by five clusters with differing labels, i.e. “Empty Calorie”; “Lower Variety”; “Higher Starch”; Transition to Heart Healthy”; and “Average Male” patterns.
Hulshof et al (1992) collected data by means of two-day food records from participants of the Dutch national food consumption survey. In the final, 26 food groups were conceptualized (with consideration of convergence in nutrient composition and/or origin) for cluster analysis. They then retained eight clusters. Each pattern received a score based on recommended intakes for fat, ratio of polyunsaturated to saturated fats, dietary fibre, cholesterol, mono- and disaccharides, and alcohol. Clusters 1, 2, 3, 4, 5, 6, 7, and 8 scored 42; 31; 64; 50; 46; 61; 67; and 74 respectively. Scores could range from 20 to 100; so, clusters 1, 2, 4, and 5 (i.e. with scores of 50 or below) had moderate to poor dietary