1 © The Author(s) 2019. Published by Oxford University Press on behalf of Entomological Society of America.
All rights reserved. For permissions, please e-mail: [email protected].
Plant–Insect Interactions
Reduction of Plant Suitability for Corn Leaf Aphid
(Hemiptera: Aphididae) Under Elevated Carbon Dioxide
Condition
Yu Chen,
1,2,Laurent Serteyn,
2Zhenying Wang,
1KangLai He,
1,3and Frederic Francis
2,31State Key Laboratory for Biology of Plant Disease and Insect Pests, Institute of Plant Protection, Chinese Academy of Agricultural Science, Beijing 100193, China, 2Functional and Evolutionary Entomology, Gembloux Agro-Bio Tech, Liège University, Passage des Déportés, 2, Gembloux, Belgium, and 3Corresponding author, e-mail: [email protected]; [email protected]
Subject Editor: Christopher Ranger
Received 7 February 2019; Editorial decision 3 April 2019
Abstract
In the current context of global climate change, atmospheric carbon dioxide (CO2) concentrations are continuously rising with potential influence on plant–herbivore interactions. The effect of elevated CO2 (eCO2) on feeding behavior of corn leaf aphid, Rhopalosiphum maidis (Fitch) on barley seedlings Hordeum vulgare L. was tracked using electrical penetration graph (EPG). The nutrient content of host plant and the developmental indexes of aphids under eCO2 and ambient CO2 (aCO2) conditions were also investigated. Barley seedlings under eCO2 concentration had lower contents of crude protein and amino acids. EPG analysis showed the plants cultivated under eCO2 influenced the aphid feeding behavior, by prolonging the total pre-probation time of the aphids (wandering and locating the feeding site) and the ingestion of passive phloem sap. Moreover, fresh body weight, fecundity and intrinsic population growth rate of R. maidis was significantly decreased in eCO2 in contrast to aCO2 condition. Our findings suggested that changes in plant nutrition caused by eCO2, mediated via the herbivore host could affect insect feeding behavior and population dynamics.
Key words: climate change, carbon dioxide, corn leaf aphid, feeding behavior, electrical penetration graph (EPG)
The world average carbon dioxide (CO2) concentration in the atmosphere has steadily increased from pre-industrial values of approximately 280 ppm to 401 ppm (Mauna Loa Observatory: NOAA-ESRL). Concentrations are projected to increase to 550 ppm by 2050 and may surpass to 700 ppm by 2100 (Stocker et al. 2013). Elevated atmospheric CO2 (eCO2) has marked impact on plant growth and individual composition (Hartley et al. 2000, Bae and Sicher 2004, Seneweera and Conroy 2005), which indirectly affects the performance of herbivorous insect pests (Bale 2002, Zavala et al. 2013). Consequently, eCO2 will in turn influence agro-ecosystem processes and crop productivity (Norby et al. 2005, Zvereva and Kozlov 2006, Lindroth 2010). CO2 is the raw material for carbo-hydrate production for plants during photosynthesis. In general, the most significant changes in foliar chemistry are due to increase of the carbon:nitrogen (C:N) ratio in phloem sap while plants grow under
eCO2 (Hartley et al. 2000, Johns and Hughes 2002, Chen et al. 2005, Ainsworth and Rogers 2007), where nitrogen, mostly bound in amino acids and proteins, is a limiting factor for phloem sap feed-ing herbivorous insects (Mattson 1980). Subsequently, this will lead to less fitness of host plants and adverse effects on insects due to nutrition deficiency (Chen et al. 2005), which will result in heavier
damage on the host plants (Marks and Lincoln 1996, Bezemer and Jones 1998, Sun et al. 2009a).
The phloem sap is sugar-rich with dominance of sucrose (Avigad and Dey 1997, Jensen et al. 2013) that is the most effective phago-stimulant for insect herbivores (Srivastava and Auclair 1971). Aphids overcome the sugar barrier to phloem sap utilization through their possession in the gut of sucrose-transglucosidase activity (Ashford et al. 2000, Cristofoletti et al. 2003, Douglas 2006). Overall, a posi-tive relationship between aphid performance and increasing sucrose concentration are mostly invariable (Srivastava and Auclair 1971, Kriegler 1972, Pescod et al. 2007, Puterka et al. 2017). However, the adapted range of sucrose concentrations by aphid is species-specific, which may link with its host range (Puterka et al. 2017). Oehme et al. (2013) reported that eCO2 enhanced significant fructose and glucose levels in spring wheat foliage, which positively affected the relative growth rate of R. padi. However, the concentration of sucrose tends to increase at leaf development stage and to decrease at stem elongation stage due to eCO2, but CO2-induced these changes were not statistically significant.
Nitrogen is a limiting nutrient source for many herbivores and phloem sap feeding aphid in terms of quality (nutritional
doi: 10.1093/ee/nvz045 Research
components) and quantity (concentration of individual nutritional component) (Mattson 1980). Although aphid can overcome the nitrogen barrier in terms of essential amino acids in phloem sap by relying on their symbiotic bacteria (endosymbionts) including
Buchnera aphidicola (Dadd 1985, Srivastava et al. 1985, Ohtaka and Ishikawa 1991, Douglas 1998, Spiteller et al. 2000, Nardi et al. 2002, Davis et al. 2006, Schloss et al. 2006, Crotti et al. 2010, Defossez et al. 2011). Histidine, isoleucine, and methionine are required dietary amino acids for Myzus persicae in the aphid-bacte-ria symbiosis (Mittler 1971).
Rising atmospheric CO2 directly impacts the plant nitrogen centration, is further transformed and affects the amino acid con-centration (Docherty et al. 1997, Bertrand and Bigras 2006, Stiling and Cornelissen 2007, Sicher 2008, Sun et al. 2009a,b). Due to feeding solely on the phloem sap, aphid is one of the most sensitive insect responding to changes in quality and/or quantity of plants exposed to eCO2 (Pritchard et al. 2007). Previous research suggests that the response of aphid to eCO2-mediated alternation of foliar quality and/or quantity is species-specific (Hughes and Bazzaz 2001, Himanen et al. 2008, Oehme et al. 2013), i.e., being positively, nega-tively, or not significantly affected at both individual and popula-tion in terms of growth, development, fecundity, and abundance (Sandström and Pettersson 1994, Awmack et al. 1997, Docherty et al. 1997, Sandström 2000, Hughes and Bazzaz 2001, Holopainen 2002, Mondor et al. 2005, Oehme et al. 2013, Jiang et al. 2016). Previous reports indicated the changes in individual amino acid levels of phloem sap possibly alter the aphid behavior. Glutamine concentration from high to low levels for aphids M. persicae and
Macrosiphum euphorbiae on potato plants could alter the fitness of
host plant to aphids (Sandström 2000, Karley et al. 2002). This high-lighted the importance of assessing the entire chemical profile rather than only total concentrations as commonly reported (Weibull 1987, Sandström and Pettersson 1994, Docherty et al. 1997, Sandström 2000).
Although some studies reported eCO2-induced less fitness of host plant by altering foliar nutrient availability (Lincoln et al. 1993, Schädler et al. 2007, Cornelissen 2011), a recent research demon-strated that eCO2-mediated increasing in foliar soluble sugars, free amino acids, and fatty acids could be favorable for ingesting cotton sap by Aphis gossypii (Glover), and consequently leading to in-creases in body weight, fecundity, and population abundance (Jiang et al. 2016). Srivastava et al. (1983) proved that eleven nonessen-tial amino acids and amides play various roles in phagostimulation, growth and survival in Acyrthosiphon pisum (Harris). We suspected that changes in foliar compositions would alter the feeding behavior and therefore to change in suitability of corn leaf aphid under eCO2.
Corn leaf aphid, Rhopalosiphum maidis, (Fitch) is a worldwide pest which often cause significant damage on cereal crops such as barley (Hordeum vulgare L.), corn (Zea mays L.), pearl millet (Pennisetum glaucum), wheat (Triticum aestivum L.), sorghum (Sorghum bicolor L. Moench), and broad bean (Vicia faba L.) (El-Ibrashy et al. 1972). Corn leaf aphid also a vector of plant viruses including sugarcane mosaic virus (SCMV), maize dwarf mosaic virus (MDMV), which often result in serious yield loss (Everly 1960, Foott and Timmins 1973, Bing et al. 1991, Blackman and Eastop 2000). Prior research reported that eCO2 positively affected the fecundity of corn leaf aphid (Xie et al. 2014). The objective of this study was to assess eCO2-mediated changes in the composition of phloem sap in barley and the resulting consequences for corn leaf aphid. Thus, we quantified eCO2-mediated changes in leaf chemistry including crude protein, carbohydrates like glucose, fructose, sucrose and free amino acids in barley seedlings; examined the biological parameters
of aphid developed on barley grown under ambient CO2 (aCO2) and
eCO2 conditions; and analyzed the effects of eCO2 on aphid stylet ingestion on host plants by tracking corn leaf aphid feeding behavior with electrical penetration graph (EPG).
Materials and Methods
CO2 Condition Chambers
Six transparent conditioned chambers (L 60 × W 50 × H 50 cm, PLEXIGLAS GS, clear 0F00 GT, 8 mm thick; Evonik Industries, Essen, Germany) were used for rearing plants and insects. In each chamber, a constant airflow (30 liters/min) was pushed using an air pump (Koi flow 30; Superfish, the Netherlands). Two levels of atmospheric CO2 concentrations were applied, i.e., ambient level (aCO2: 450 ± 50 ppm) and elevated level (eCO2 = aCO2 + 350 ppm). The eCO2 was achieved by using a CO2 gas tank (>99% purity; Airliquide, Paris, France). Three chambers were used for each CO2 level. These chambers were maintained at 23.0 ± 1.0°C and 60.0 ± 10.0% RH, with a 16 h light period under cool white light-emitting diode (LED) lights (77 lmol/sqm/s). CO2 concentrations, tempera-ture, and RH were continuously monitored in each chamber with MCH-383 SD data loggers (Lutron, Taipei, Taiwan).
Plant Material
Barley, H. vulgare L., was sown in black plastic pots (7.5 cm diam-eter, 9 cm high), with 30 seeds per pot, no chemical fertilizers or in-secticides were used. After sowing, 25 pots/chamber were randomly transferred to aCO2 and eCO2 chambers. Two weeks old (14 d old), healthy barley seedlings were used for the experiment.
Aphid Rearing
A colony of corn leaf aphid, R. maidis, was originated collected from a corn field in Langfang City, Hebei Province, North China. Virus free aphid and barley seedlings were reared under aCO2 and/or eCO2 chambers more than 10 generations.
Crude Protein Analysis
For the Dumas method (Dumas 1831), fresh barley seedlings (0.2 g) were weighed in four replicates per CO2 condition. Samples are wrapped in a tin foil, placed into an automated sample loader, and dropped into the induction furnace of an N analyzer. TruSpec CHNS Macro (Model CNS-2000, LECO, Inc.,St. Joseph, MI) instrument was used for the crude protein determination (Beljkaš et al. 2010). Crude protein content was calculated from the nitrogen content of the material, using a nitrogen conversion factor of 6.25 according to ISO/TS 16634-2 (2016).
Carbohydrate Contents Assay
Total soluble sugars were determined in four replicates per CO2 condition based on the method of phenolsulfuric acid (Dubois et al. 1956). 0.2 g fresh barley seedlings was homogenized with deionized water and centrifuged at 4500 rpm for 10 min. Then, 1 ml of ex-tract was treated with 0.125 ml 5% phenol and 2.5 ml 98% sulfuric acid. The mixture remained in the water bath at 30°C for 20 min. Absorbance was read at 490 nm using ultraviolet spectrophotometer (S 2100, Biochrom Ltd, England).
Glucose/Fructose/Sucrose contents of barley seedlings grown under both CO2 treatments were determined by a high-performance anion-exchange chromatography with pulsed amperometric detec-tion (HPAEC-PAD). The chromatographic system was a Dionex
ICS-5000+ model (Sunnyvale, CA) equipped with an electrochem-ical detector, and an SP gradient pump. The column was a Dionex CarboPac PA-100 (250 mm × 4 mm i.d.) coupled to a CarboPac guard column (40 mm × 4 mm i.d.). The mobile phase consisted of 500 mM sodium hydroxide (A) and water (eluent B). The flow rate was 1 ml/min and the injection volume was 25 µl. Four replicates were conducted for each treatment.
Amino Acid Assay
In order to define the composition of amino acids, 0.2 g flours of barley seedlings were prepared after hydrolysis under nitrogen with 6M HCl at 110°C during 24 h. High-performance liquid chroma-tography (HPLC) analysis (Biochrom 20 Plus amino acid analyzer, Pharmacia, Cambridge, United Kingdom) was performed (Moore and Stein 1954) using norleucine as an internal standard. The amino acids were separated by elution with suitable buffers of increasing pH and were detected with ninhydrin in a continuous flow photo-metric analytical system. Amino acid standard solutions (AA-S-18 from Sigma Aldrich, Steinheim, Germany) (500 nM) containing norleucine were separately injected to calibrate the analyzer and to calculate the amount of amino acid in the samples (Dakia et al. 2007). Four replicates were maintained for each CO2 level.
Feeding Behavior Test by EPG
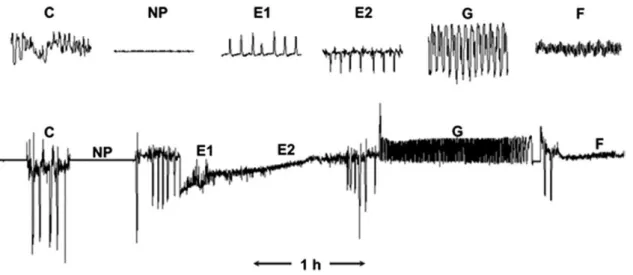
Feeding behavior of corn leaf aphid on aCO2 and eCO2 barley seed-lings was monitored by using the Giga-8 DC-EPG system (EPG sys-tems, Wageningen, the Netherlands) at constant temperature 23.0 ± 1.0°C. Wingless adults reared under aCO2 conditions were carefully collected by using a brush and then starved for about 30 min. A gold wire (diameter 20 μm, 3 cm length) was connected to the EPG ampli-fier with a copper wire attached to a copper nail. The other end of the gold wire was attached to the dorsum of the aphid with conduc-tive water-based silver glue. Once a set of eight aphids was wired, the plant electrode was inserted into the soil pot. The recordings started in the morning at 10:00 a.m. and lasted for 6 h. Each aphid and each plant was used only once and 21 successful replicates for each treatment (aCO2 and eCO2) were obtained. Data were recorded with the Stylet+d software and analyzed with Stylet+a (EPG systems, Wageningen, The Netherlands) and the feeding activity phases were distinguished based on waveforms resulting from voltage variations
(Fig. 1). EPG parameters, such as number or duration of waveform events, were automatically calculated using Excel workbook (Sarria et al. 2009).
Intrinsic Rate of Increase in Aphid Population Under
aCO2 or eCO2 Conditions
In both aCO2 and eCO2 chambers, one newborn aphid (<6 h) was placed into a ventilated transparent plastic clip cages (2.7 cm diam-eter, 2.7 cm high) and restrained on one fresh leaf of a barley seed-ling. The edge of the clip cage was covered with a sponge to avoid mechanical wounds to the leaf. Development and survival of nymphs and adults were checked daily. New offspring and dead adults were removed after daily counting. The intrinsic rate of increase (rm) for each system was calculated from the equation rm = 0.738 × (ln Md) / d where d is the period from the aphid birth to its first reproduction and Md is the number of progenies in a reproductive period equal to d (Wyatt and White 1977, Zhang et al. 2017). A total of 15 replicates per CO2 condition were maintained.
Mean Relative Growth Rate of Aphid
Twenty newborn aphid nymphs were collected from either aCO2 or eCO2 chambers, then placed on 9-cm-diameter filter paper and weighed. All aphids were transferred back to aCO2 or eCO2 cham-bers on barley seedlings in clip cages as described above. After 7 d, all 20 aphids were collected and weighed again. A total of 10 rep-licates were performed for each CO2 treatment. The mean relative growth rate (MRGR) of R. maidis was calculated with the equation: MRGR = (ln 7 d weight − ln birth weight) / 7 (Bruce et al. 2003). Statistical Analysis
The nutrient contents of barley seedling (including crude protein, carbohydrates, and amino acid concentrations) and the biological parameters of aphid (including the development time, fecundity,
rm, body weight and MRGR) were examined by using t test. EPG parameters were analyzed by a Mann−Whitney U test. Since EPG waveforms data was non-Gaussian random variables, Spearson’s correlation analysis was conducted to investigate the relationships among EPG waveforms, aphid biological parameters, and nutri-ent contnutri-ents of barley seedlings. Pearson’s correlation was used to analyze the relationship between aphid biological parameters and
Fig. 1. Typical waveforms recorded by the EPG (Tjallingii and Hogen-Esch 1993). C: penetration of stylets into the plant between epidermis and mesophyll cells; np: wandering or stationary on the surface of the plant; E1: saliva transferred into phloem sieve elements; E2: passive sap ingestion from the phloem; G: active sap ingestion from the xylem; F: derailed stylet mechanics.
nutrient contents of barley seedlings. All analyses were performed with IBM SPSS Statistics 20.0 (IBM Corp, New York, NY, 2011).
Results
Nutrient Contents in aCO2 and eCO2 Barley Seedlings
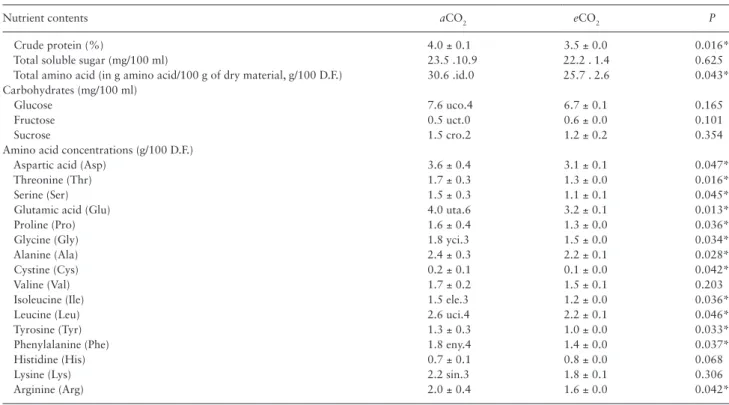
Crude protein and total amino acid were significantly decreased in barley seedlings grown at eCO2 when compared with aCO2 condi-tion. Though total soluble sugar was decreased at eCO2 treatment, there was no statistically significant difference between aCO2 and
eCO2 barley seedlings (Table 1). This indicated that eCO2 resulted in a relative nutrient deficiency of barley seedlings.
CO2 levels also have a major impact on the composition of in-dividual amino acids in barley seedlings (Table 1). In the study, Glu and Asp were the predominant free amino acids in barley seedlings. Significant decrease was found for 13 basic amino acids including Asp (−13.9%), Thr (−23.5%), Ser (−26.7%), Glu (−20.0%), Pro (−18.8%), Gly (−16.7%), Ala (−8.3%), Cys (−50.0%), Iso (−20.0%), Leu (−15.4%), Tyr (−23.1%), Phe (−22.2%), and Arg (−20.0%) in
eCO2 barley seedlings (P < 0.05). However, there is no significant difference in glucose, fructose and sucrose levels.
Aphid Feeding Behavior on aCO2 and eCO2 Barley
Seedlings
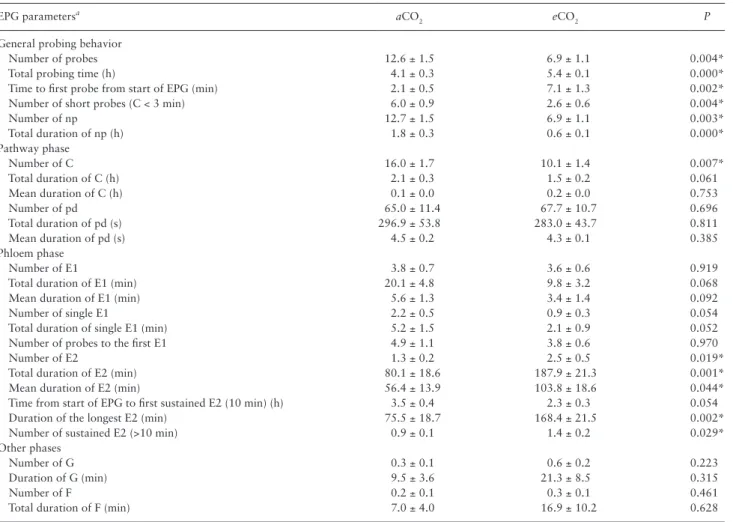
The plant CO2 treatment had a significant impact on aphid feeding behavior. In the study, the total probing time of aphid was signifi-cant longer on eCO2 barley seedlings. Aphid had a longer latency to start the first probe on eCO2 barley seedling than on aCO2 barley seedlings. The number and duration of np and of short probes were greater on aCO2 barley seedlings than on eCO2 barley seedlings. No significant difference was observed in total duration of C wave and pd between the two treatments. However, the passive sap ingestion (E2 waves) was significantly longer and more frequent in eCO2 than
in aCO2. Despite the absence of significant difference in xylem inges-tion phases between treatments, total durainges-tion of G waves in eCO2 barley seedlings was about twice longer than on aCO2 barley seed-lings (Table 2).
Biological Parameters of Aphid
The fecundity, rm and fresh body weight of 7 d R. maidis were sig-nificantly less under eCO2 condition thanunder aCO2 condition (Table 3). However, no significant differences were found in develop-ment time, weight of newborn nymphs, MRGR between aCO2 and
eCO2 treatments.
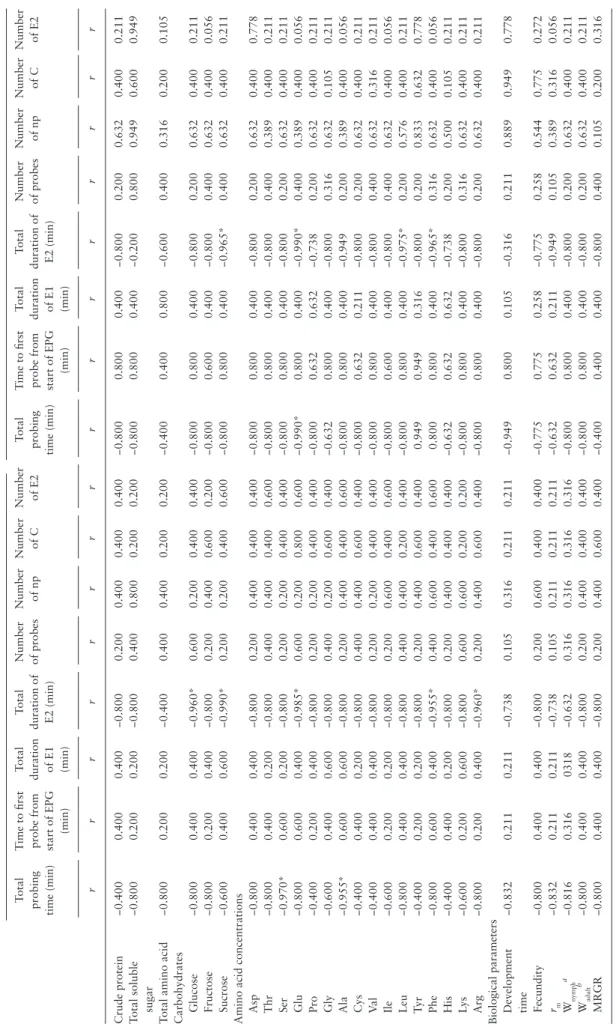
Relationships Among EPG Waveforms of Aphid Feeding, Nutrient Contents of Barley Seedlings, and Biological Parameters of Aphid
The total probing time and duration of E2 were negatively correl-ated with the nutrient contents of barley seedlings and biological parameters of aphid (Table 4). Under aCO2 and eCO2 conditions, the total probing time was significantly correlated with the concentra-tion of Ser, Ala, and Glu. The total duraconcentra-tion of E2 was significantly correlated with the concentration of sucrose, Glu, Phe in both treat-ments. In addition, glucose was also significantly correlated under
aCO2 treatment.
The biological parameters we tested were positively correlated with the nutrient contents of barley seedling under both aCO2 and
eCO2 treatments (Table 5). Furthermore, His, Lys, and Arg were significantly correlated with fecundity under aCO2 treatment. Rm was significantly correlated with crude protein, Arg under aCO2 treatment, while Gly, Ala, Ile, and Phe were significantly correlated under eCO2 treatment. Fresh body weight of 7 d old aphid was sig-nificantly correlated with the concentration of total soluble sugar, glucose, fructose, sucrose, and some individual amino acids like Ile, Lys, Arg under aCO2 treatment. Also, fructose, sucrose, Gly, Val,
Table 1. The concentration of crude protein, carbohydrates and amino acids in barley seedlings under aCO2 and eCO2 conditions
Nutrient contents aCO2 eCO2 P
Crude protein (%) 4.0 ± 0.1 3.5 ± 0.0 0.016*
Total soluble sugar (mg/100 ml) 23.5 .10.9 22.2 . 1.4 0.625
Total amino acid (in g amino acid/100 g of dry material, g/100 D.F.) 30.6 .id.0 25.7 . 2.6 0.043*
Carbohydrates (mg/100 ml)
Glucose 7.6 uco.4 6.7 ± 0.1 0.165
Fructose 0.5 uct.0 0.6 ± 0.0 0.101
Sucrose 1.5 cro.2 1.2 ± 0.2 0.354
Amino acid concentrations (g/100 D.F.)
Aspartic acid (Asp) 3.6 ± 0.4 3.1 ± 0.1 0.047*
Threonine (Thr) 1.7 ± 0.3 1.3 ± 0.0 0.016*
Serine (Ser) 1.5 ± 0.3 1.1 ± 0.1 0.045*
Glutamic acid (Glu) 4.0 uta.6 3.2 ± 0.1 0.013*
Proline (Pro) 1.6 ± 0.4 1.3 ± 0.0 0.036*
Glycine (Gly) 1.8 yci.3 1.5 ± 0.0 0.034*
Alanine (Ala) 2.4 ± 0.3 2.2 ± 0.1 0.028*
Cystine (Cys) 0.2 ± 0.1 0.1 ± 0.0 0.042*
Valine (Val) 1.7 ± 0.2 1.5 ± 0.1 0.203
Isoleucine (Ile) 1.5 ele.3 1.2 ± 0.0 0.036*
Leucine (Leu) 2.6 uci.4 2.2 ± 0.1 0.046*
Tyrosine (Tyr) 1.3 ± 0.3 1.0 ± 0.0 0.033*
Phenylalanine (Phe) 1.8 eny.4 1.4 ± 0.0 0.037*
Histidine (His) 0.7 ± 0.1 0.8 ± 0.0 0.068
Lysine (Lys) 2.2 sin.3 1.8 ± 0.1 0.306
Arginine (Arg) 2.0 ± 0.4 1.6 ± 0.0 0.042*
Each value is the mean ± SE of four replicates for both aCO2 and eCO2 barley seedlings. Asterisk indicates significant differences between treatments (P < 0.05).
Phe, His, Lys, and Arg were significantly correlated under eCO2 treatment.
Discussion
Elevated CO2 was found to affect the feeding behavior via the change of the plant nutrient contents and exerting an influence on the herbivore performance. Rearing in eCO2 condition, barley seed-lings significantly decreased the concentration of crude protein, total
amino acids, and 13 individual amino acids. The corn leaf aphid prolonged the total probing time and sustained ingestion on eCO2 barley seedlings but was lower in fecundity, rm and fresh body weight which negatively impacted population abundance of aphid.
Rising atmospheric CO2 is likely to decrease the protein concen-tration of many crops, including wheat (Jablonski et al. 2002, Loladze 2002), potato (Fangmeier et al. 2002), and soybean (Ainsworth et al. 2002). The reduced concentration of plant protein under eCO2 con-dition mainly due to accumulation of nonstructural carbohydrates
Table 2. EPG parameters of Rhopalosiphum maidis on aCO2 and eCO2 barley seedlings
EPG parametersa aCO
2 eCO2 P
General probing behavior
Number of probes 12.6 ± 1.5 6.9 ± 1.1 0.004*
Total probing time (h) 4.1 ± 0.3 5.4 ± 0.1 0.000*
Time to first probe from start of EPG (min) 2.1 ± 0.5 7.1 ± 1.3 0.002*
Number of short probes (C < 3 min) 6.0 ± 0.9 2.6 ± 0.6 0.004*
Number of np 12.7 ± 1.5 6.9 ± 1.1 0.003* Total duration of np (h) 1.8 ± 0.3 0.6 ± 0.1 0.000* Pathway phase Number of C 16.0 ± 1.7 10.1 ± 1.4 0.007* Total duration of C (h) 2.1 ± 0.3 1.5 ± 0.2 0.061 Mean duration of C (h) 0.1 ± 0.0 0.2 ± 0.0 0.753 Number of pd 65.0 ± 11.4 67.7 ± 10.7 0.696 Total duration of pd (s) 296.9 ± 53.8 283.0 ± 43.7 0.811 Mean duration of pd (s) 4.5 ± 0.2 4.3 ± 0.1 0.385 Phloem phase Number of E1 3.8 ± 0.7 3.6 ± 0.6 0.919
Total duration of E1 (min) 20.1 ± 4.8 9.8 ± 3.2 0.068
Mean duration of E1 (min) 5.6 ± 1.3 3.4 ± 1.4 0.092
Number of single E1 2.2 ± 0.5 0.9 ± 0.3 0.054
Total duration of single E1 (min) 5.2 ± 1.5 2.1 ± 0.9 0.052
Number of probes to the first E1 4.9 ± 1.1 3.8 ± 0.6 0.970
Number of E2 1.3 ± 0.2 2.5 ± 0.5 0.019*
Total duration of E2 (min) 80.1 ± 18.6 187.9 ± 21.3 0.001*
Mean duration of E2 (min) 56.4 ± 13.9 103.8 ± 18.6 0.044*
Time from start of EPG to first sustained E2 (10 min) (h) 3.5 ± 0.4 2.3 ± 0.3 0.054
Duration of the longest E2 (min) 75.5 ± 18.7 168.4 ± 21.5 0.002*
Number of sustained E2 (>10 min) 0.9 ± 0.1 1.4 ± 0.2 0.029*
Other phases
Number of G 0.3 ± 0.1 0.6 ± 0.2 0.223
Duration of G (min) 9.5 ± 3.6 21.3 ± 8.5 0.315
Number of F 0.2 ± 0.1 0.3 ± 0.1 0.461
Total duration of F (min) 7.0 ± 4.0 16.9 ± 10.2 0.628
aAll parameters were calculated for the whole 6-h recording. Each value is the mean ± SE of 21 replicates for both aCO
2 and eCO2 barley seedlings. Asterisk indicates significant differences between treatments (P < 0.05).
Table 3. Biological parameters (mean ± SE) of Rhopalosiphum maidis on aCO2 and eCO2 barley seedlings
Biological parameters aCO2 eCO2 t P
Development time (d) 7.0 vel.2 7.5 ± 0.2 −1.916 0.067
Fecundity 4.7 cun.2 3.3 ± 0.1 6.866 <0.001*
Intrinsic rate of increase (rm)a 0.4 tri.0 0.3 ± 0.0 5.514 <0.001*
Wnymphb 0.0 ± 0.0 0.0 ± 0.0 1.948 0.067
Wadultc 0.5 ult.0 0.4 ± 0.0 4.944 <0.001*
Mean relative growth rate (MRGR)d 0.4 GR .01 0.4 1 0.0 1.043 0.311
ar
m = 0.738 × (ln Md) / d, where d is the period from the aphid birth to its first reproduction and Md is the number of progenies in a reproductive period equal to d. Asterisks indicate significant differences between treatments (P < 0.05).
bW
nymph means fresh body weight of newborn nymphs (<6 h) (mg).
cW
adult means fresh body weight of 7 d adults (mg).
dMRGR = (ln 7 d weight − ln birth weight) / 7.
Table 4.
Coef
ficients of Spearman
’s cor
relation between EPG w
aveforms, nutrient contents of barley seedlings, biological parameter
s of Rhopalosiphum maidis under aCO 2 and eCO 2 conditions Components aCO 2 eCO 2 Total probing time (min) T
ime to first probe from start of EPG (min)
Total duration of E1 (min) Total duration of E2 (min) Number of probes Number of np Number of C Number of E2 Total probing time (min) T
ime to first probe from start of EPG (min)
Total duration of E1 (min) Total duration of E2 (min) Number of probes Number of np Number of C Number of E2 r r r r r r r r r r r r r r r r Crude protein −0.400 0.400 0.400 −0.800 0.200 0.400 0.400 0.400 −0.800 0.800 0.400 −0.800 0.200 0.632 0.400 0.211
Total soluble sugar
−0.800 0.200 0.200 −0.800 0.400 0.800 0.200 0.200 −0.800 0.800 0.400 −0.200 0.800 0.949 0.600 0.949
Total amino acid
−0.800 0.200 0.200 −0.400 0.400 0.400 0.200 0.200 −0.400 0.400 0.800 −0.600 0.400 0.316 0.200 0.105 Carbohydrates Glucose −0.800 0.400 0.400 −0.960* 0.600 0.200 0.400 0.400 −0.800 0.800 0.400 −0.800 0.200 0.632 0.400 0.211 Fructose −0.800 0.200 0.400 −0.800 0.200 0.400 0.600 0.200 −0.800 0.600 0.400 −0.800 0.400 0.632 0.400 0.056 Sucrose −0.600 0.400 0.600 −0.990* 0.200 0.200 0.400 0.600 −0.800 0.800 0.400 −0.965* 0.400 0.632 0.400 0.211
Amino acid concentrations Asp
−0.800 0.400 0.400 −0.800 0.200 0.400 0.400 0.400 −0.800 0.800 0.400 −0.800 0.200 0.632 0.400 0.778 Thr −0.800 0.400 0.200 −0.800 0.400 0.400 0.400 0.600 −0.800 0.800 0.400 −0.800 0.400 0.389 0.400 0.211 Ser −0.970* 0.600 0.200 −0.800 0.200 0.200 0.400 0.400 −0.800 0.800 0.400 −0.800 0.200 0.632 0.400 0.211 Glu −0.800 0.600 0.400 −0.985* 0.600 0.200 0.800 0.600 −0.990* 0.800 0.400 −0.990* 0.400 0.389 0.400 0.056 Pro −0.400 0.200 0.400 −0.800 0.200 0.200 0.400 0.400 −0.800 0.632 0.632 −0.738 0.200 0.632 0.400 0.211 Gly −0.600 0.400 0.600 −0.800 0.400 0.200 0.600 0.400 −0.632 0.800 0.400 −0.800 0.316 0.632 0.105 0.211 Ala −0.955* 0.600 0.600 −0.800 0.200 0.400 0.400 0.600 −0.800 0.800 0.400 −0.949 0.200 0.389 0.400 0.056 Cys −0.400 0.400 0.200 −0.800 0.400 0.400 0.600 0.400 −0.800 0.632 0.211 −0.800 0.200 0.632 0.400 0.211 Va l −0.400 0.400 0.400 −0.800 0.200 0.200 0.400 0.400 −0.800 0.800 0.400 −0.800 0.400 0.632 0.316 0.211 Ile −0.600 0.200 0.200 −0.800 0.200 0.600 0.400 0.600 −0.800 0.600 0.400 −0.800 0.400 0.632 0.400 0.056 Leu −0.800 0.400 0.400 −0.800 0.400 0.400 0.200 0.400 −0.800 0.800 0.400 −0.975* 0.200 0.576 0.400 0.211 Ty r −0.400 0.200 0.200 −0.800 0.200 0.400 0.600 0.400 0.949 0.949 0.316 −0.800 0.200 0.833 0.632 0.778 Phe −0.800 0.600 0.400 −0.955* 0.400 0.600 0.400 0.600 0.800 0.800 0.400 −0.965* 0.316 0.632 0.400 0.056 His −0.400 0.400 0.200 −0.800 0.200 0.400 0.400 0.400 −0.632 0.632 0.632 −0.738 0.200 0.500 0.105 0.211 Ly s −0.600 0.200 0.600 −0.800 0.600 0.600 0.200 0.200 −0.800 0.800 0.400 −0.800 0.316 0.632 0.400 0.211 Arg −0.800 0.200 0.400 −0.960* 0.200 0.400 0.600 0.400 −0.800 0.800 0.400 −0.800 0.200 0.632 0.400 0.211
Biological parameters Development time
−0.832 0.211 0.211 −0.738 0.105 0.316 0.211 0.211 −0.949 0.800 0.105 −0.316 0.211 0.889 0.949 0.778 Fecundity −0.800 0.400 0.400 −0.800 0.200 0.600 0.400 0.400 −0.775 0.775 0.258 −0.775 0.258 0.544 0.775 0.272 rm −0.832 0.211 0.211 −0.738 0.105 0.211 0.211 0.211 −0.632 0.632 0.211 −0.949 0.105 0.389 0.316 0.056 Wnymph a −0.816 0.316 0318 −0.632 0.316 0.316 0.316 0.316 −0.800 0.800 0.400 −0.800 0.200 0.632 0.400 0.211 Wadult b −0.800 0.400 0.400 −0.800 0.200 0.400 0.400 0.400 −0.800 0.800 0.400 −0.800 0.200 0.632 0.400 0.211 MRGR −0.800 0.400 0.400 −0.800 0.200 0.400 0.600 0.400 −0.400 0.400 0.400 −0.800 0.400 0.105 0.200 0.316 r = correlation coefficient.
Asterisks indicate level of significance:
P
< 0.05.
aW
nymph
means fresh body weight of newborn nymph (< 6h) (mg).
bW
adult
means fresh body weight of 7-d adult (mg).
dilutes the concentration of proteins (Kimball et al. 1994, Williams et al. 1998, Gifford et al. 2000). In this study, eCO2 level significantly decreased the concentration of 13 basic amino acids of barley seed-lings. In accordance, Wang and Nobel (1995) reported doubled CO2 concentrations led to 17% less amino acids in phloem of Opuntia
ficus-indica (L.). The amino acid concentrations were lower in
nee-dles of black spruce (Picea mariana Mill. B.S.P.) (Bertrand and Bigras 2006) and in phloem of cotton (Sun et al. 2009a) at eCO2 condition. Decreased amino acid concentration in plant under eCO2 condition may as a result of ‘nitrogen dilution’ (Docherty et al. 1997).
The eCO2 significantly increased the concentration of sucrose of soybean (Ainsworth et al. 2007) and broccoli (Krumbein et al. 2010). However, there was no significant effect on the concentration of sucrose in leaves of spring wheat under CO2 enrichment (Högy and Fangmeier 2008) and the concentrations of sucrose, fructose and glucose in maize leaves remained unchanged under eCO2 (Leakey et al. 2006). In our study, we also did not find any significant differ-ence in total soluble sugar, glucose, fructose, sucrose between aCO2 and eCO2 barley seedlings. The carbohydrates synthesis of young cereals may be less affected by eCO2 (Havelka et al. 1984, Cure and Acock 1986, Ryle et al. 1992), probably because they do not convert increased photosynthetic capacity in an increased level of extractable carbohydrates (Ingvardsen and Veierskov 1994).
The analysis of EPG recordings revealed that the cultivation of barley in different concentration of CO2 greatly affected the feeding behavior of R. maidis. The total probing time of R. maidis was sig-nificantly longer on eCO2 barley seedlings. In the study, the total duration of E2 was the main component of total probing time and which was also significant longer in eCO2 condition. The total dur-ation of E2 was negatively correlated with nutrient contents and biological parameters of aphid which indicates that the decrease in plant nutrient contents in eCO2 barley seedlings may increase the time spending in passive phloem feeding which were unfavorable for its reproductive and population abundance.
In contrast with eCO2 barley seedlings, aphid feeding on aCO2 barley seedlings had a higher frequency of probes, which sug-gested the absence of negative factors in epidermis that might have caused the withdrawal of stylets (Dancewicz et al. 2016). Long np phase observed of aphid on aCO2 barley seedlings would have indicated the presence of barriers during stylets insertion in plant tissues (Alvarez et al. 2006), and vice versa, aphid feeding on eCO2 barley seedlings may have more obstacles on the sur-face of epidermis and less barriers during stylets insertion in plant tissues. Rhopalosiphum maidis had a longer latency to begin its first probe also implied the epidermal obstacles on eCO2 barley seedlings, in addition, the result analysis pointed that the time
Table 5. Coefficients of Pearson’s correlation between nutrient contents of barley seedlings and biological parameters of Rhopalosiphum
maidis under aCO2 and eCO2 conditions
Components aCO2 eCO2
Development time
Fecundity rm Wnympha W
adultb MRGR Development time
Fecundity rm Wnymph Wadults MRGR
r r r r r r r r r r r r Crude protein 0.904 0.979* 0.954* 0.921 0.890 0.904 0.884 0.989* 0.896 0.746 0.825 0.808 Total soluble sugar 0.946 0.892 0.936 0.898 0.970* 0.911 0.597 0.932 0.892 0.877 0.938 0.836 Total amino acid 0.917 0.855 0.902 0.925 0.928 0.932 0.803 0.876 0.939 0.892 0.863 0.824 Carbohydrates Glucose 0.924 0.937 0.893 0.904 0.972* 0.946 0.85 0.872 0.934 0.811 0.879 0.862 Fructose 0.944 0.892 0.946 0.949 0.998* 0.914 0.759 0.915 0.880 0.904 0.953* 0.939 Sucrose 0.937 0.949 0.945 0.795 0.966* 0.873 0.585 0.725 0.941 0.877 0.99* 0.945
Amino acid concentrations
Asp 0.742 0.794 0.945 0.942 0.762 0.867 0.804 0.920 0.859 0.841 0.909 0.898 Thr 0.879 0.866 0.781 0.929 0.837 0.928 0.649 0.552 0.725 0.877 0.815 0.735 Ser 0.903 0.744 0.891 0.85 0.804 0.848 0.76 0.702 0.812 0.896 0.865 0.795 Glu 0.852 0.917 0.909 0.841 0.092 0.90 0.703 0.839 0.875 0.873 0.781 0.938 Pro 0.909 0.795 0.898 0.901 0.842 0.895 0.472 0.503 0.799 0.938 0.897 0.845 Gly 0.913 0.751 0.902 0.846 0.812 0.849 0.673 0.801 0.966* 0.925 0.985* 0.678 Ala 0.919 0.763 0.908 0.855 0.823 0.858 0.451 0.706 0.971* 0.874 0.912 0.937 Cys 0.932 0.833 0.922 0.918 0.876 0.919 0.636 0.87 0.921 0.92 0.875 0.929 Val 0.943 0.879 0.936 0.946 0.914 0.941 0.362 0.605 0.929 0.786 0.976* 0.897 Ile 0.926 0.93 0.936 0.759 0.955* 0.843 0.61 0.769 0.971* 0.917 0.932 0.921 Leu 0.892 0.890 0.788 0.887 0.938 0.921 0.783 0.737 0.831 0.896 0.875 0.808 Tyr 0.783 0.737 0.831 0.896 0.875 0.808 0.802 0.728 0.800 0.896 0.844 0.772 Phe 0.909 0.905 0.92 0.715 0.927 0.806 0.724 0.882 0.985* 0.934 0.972* 0.926 His 0.904 0.992* 0.909 0.931 0.922 0.87 0.455 0.522 0.83 0.922 0.975* 0.878 Lys 0.901 0.996* 0.908 0.894 0.988* 0.945 0.634 0.675 0.881 0.942 0.971* 0.893 Arg 0.946 0.986* 0.952* 0.882 0.995* 0.95 0.6 0.743 0.928 0.932 0.954* 0.928
r = correlation coefficient. Asterisks indicate level of significance: P < 0.05. Bold numbers corresponded to significant results at P < 0.05.
aW
nymph means fresh body weight of newborn nymphs (<6 h) (mg).
bW
aduit means fresh body weight of 7-d-old adults (mg).
to first probe was less affected by carbohydrate or amino acids content of plant.
The number of C wave refers to the ease at which aphid moved the stylets from the mesophyll to the phloem (Benatto et al. 2018). Feeding on eCO2 barley seedlings, aphid had a lower frequency of C phase suggested that aphid may reach easier to deep tissues of eCO2 barley seedlings by penetrating the meristematic tissues, which also supported the view that the aphid has less barriers during stylets insertion into the tissues of eCO2 barley seedlings. EPG results in our experiment showed that, aphid feeding on eCO2 barley seedlings may have obstacles in initial probing on the surface of the epidermis, but they were successfully penetrated into the deeper tissues of plant and sustained ingestion was significant longer when compared to the
aCO2 barley seedlings.
The biological parameters were positively correlated with nutri-ent contnutri-ents of barley seedlings, especially fecundity, rm, weight of 7 d old adults. Barley seedlings cultivation in eCO2 condition had a significantly lower concentration in crude protein, total amino acids, and 13 individual amino acids. Aphid performance on plants could not only be affected by the overall amino acid concentration, but also by the relative concentration of different amino acids (Mittler 1967). According to Dadd (1985), essential amino acids for aphid are His, Thr, Trp, Met, Val, Phe, Ile, and Lys. However, the demand of individual amino acids differs with the aphid species (Sandström and Moran 2001). While M. persicae needs Met and g-amino butyric acid, the amino acids Thr, His and Ala are important for R. padi Koch (Kazemi and Van Emden 1992).
Herbivore insects respond to the poor nutritional quality of the host plant by increasing their food consumption, prolonging devel-opment time, and reducing growth rates (Lincoln et al. 1993, Roth and Lindroth 1995, Brooks and Whittaker 1998, Williams et al. 2000, Tuchman et al. 2002, Hale et al. 2003). Our results support most of these predictions. R. maidis feeding on eCO2 barley seed-lings showed significantly decreased body weight, fecundity, and
rm, which may result in decreased of population abundance under elevated atmospheric CO2 environment. Further studies will be required to determine the defense mechanisms including epidermal integrity, defense proteins, and secondary metabolites of plant which might also hinder the penetration of stylets.
Acknowledgments
This research was supported by National Key R&D Program of China (2017YFD0201800) and Erasmus Mundus program. We thank Nicolas Poncelet, Sébastien Puigdevall for help with nutrient content assay. We thank Dr. Siva Prasath for helping with language correction.
References Cited
Ainsworth, E. A., and A. Rogers. 2007. The response of photosynthesis and stomatal conductance to rising [CO2]: mechanisms and environmental interactions. Plant. Cell Environ. 30: 258–270.
Ainsworth, E. A., P. A. Davey, C. J. Bernacchi, O. Dermody, E. A. Heaton, D. Moore, P. B. Morgan, S. L. Naidu, H. S. Y. Ra, and X. Zhu. 2002. A meta-analysis of elevated CO2 effects on soybean (Glycine max) physiol-ogy, growth and yield. Glob. Chang. Biol. 8: 695–709.
Ainsworth, E. A., A. Rogers, A. D. Leakey, L. E. Heady, Y. Gibon, M. Stitt, and U. Schurr. 2007. Does elevated atmospheric [CO2] alter diurnal C uptake and the balance of C and N metabolites in growing and fully expanded soybean leaves? J. Exp. Bot. 58: 579–591.
Alvarez, A., W. Tjallingii, E. Garzo, V. Vleeshouwers, M. Dicke, and B. Vosman. 2006. Location of resistance factors in the leaves of potato and wild tuber-bearing Solanum species to the aphid Myzus persicae. Entomol. Exp. Appl. 121: 145–157.
Ashford, D. A., W. A. Smith, and A. E. Douglas. 2000. Living on a high sugar diet: the fate of sucrose ingested by a phloem-feeding insect, the pea aphid
Acyrthosiphon pisum. J. Insect Physiol. 46: 335–341.
Avigad, G., and P. M. Dey. 1997. Carbohydrate metabolism: storage car-bohydrate, pp. 143–204. In P.M Dey and J.B. Harborne (eds.), Plant Biochemistry, Academic Press, San Diego.
Awmack, C., C. Woodcock, and R. Harrington. 1997. Climate change may increase vulnerability of aphids to natural enemies. Ecol. Entomol. 22: 366–368.
Bae, H., and R. Sicher. 2004. Changes of soluble protein expression and leaf metabolite levels in Arabidopsis thaliana grown in elevated atmospheric carbon dioxide. Field Crops Res. 90: 61–73.
Bale, J. S. 2002. Insects and low temperatures: from molecular biology to distributions and abundance. Philos. Trans. R. Soc. Lond. B. Biol. Sci. 357: 849–862.
Beljkaš, B., J. Matić, I. Milovanović, P. Jovanov, A. Mišan, and L. Šarić. 2010. Rapid method for determination of protein content in cereals and oilseeds: validation, measurement uncertainty and comparison with the Kjeldahl method. Accred. Qual. Assur.15: 555–561.
Benatto, A., A. F. Mogor, S. C. Penteado, L. S. Pereira, F. J. S. Salas, and M. A. C. Zawadneak. 2018. Influence of trichomes in strawberry cul-tivars on the feeding behavior of Chaetosiphon fragaefolii (Cockerell) (Hemiptera: Aphididae). Neotrop. Entomol. 47: 569–576.
Bertrand, A., and F. J. Bigras. 2006. Atmospheric carbon dioxide enrichment reduces carbohydrate and nitrogen reserves in overwintering Picea
mari-ana. Scand. J. Forest Res. 21: 3–13.
Bezemer, T. M., and T. H. Jones. 1998. Plant-Insect herbivore interactions in elevated atmospheric CO2: quantitative analyses and guild effects. Oikos. 82: 212–222.
Bing, J. W., W. D. Guthrie, F. F. Dicke, and J. J. Obrycki. 1991. Seedling stage feeding by corn leaf aphid (Homoptera: Aphididae): influence on plant development in maize. J. Econ. Entomol. 84: 625–632.
Blackman, R. L., and V. F. Eastop. 2000. Aphids on the world’s crops: an identification and information guide. 2nd ed, pp. 466. John Wiley & Sons, New York, NY.
Brooks, G. L., and J. B. Whittaker. 1998. Responses of multiple generations of Gastrophysa viridula, feeding on Rumex obtusifolius, to elevated CO2. Glob. Chang. Biol. 4: 63–75.
Bruce, T. J., J. L. Martin, J. A. Pickett, B. J. Pye, L. E. Smart, and L. J. Wadhams. 2003. cis-Jasmone treatment induces resistance in wheat plants against the grain aphid, Sitobion avenae (Fabricius) (Homoptera: Aphididae). Pest Manag. Sci. 59: 1031–1036.
Chen, F., F. Ge, and M. N. Parajulee. 2005. Impact of elevated CO2 on tri-trophic interaction of Gossypium hirsutum, Aphis gossypii, and Leis
axy-ridis. Environ. Entomol. 34: 37–46.
Cornelissen, T. 2011. Climate change and its effects on terrestrial insects and herbivory patterns. Neotrop. Entomol. 40: 155–163.
Cristofoletti, P. T., A. F. Ribeiro, C. Deraison, Y. Rahbé, and W. R. Terra. 2003. Midgut adaptation and digestive enzyme distribution in a phloem feeding insect, the pea aphid Acyrthosiphon pisum. J. Insect Physiol. 49: 11–24. Crotti, E., A. Rizzi, B. Chouaia, I. Ricci, G. Favia, A. Alma, L. Sacchi, K.
Bourtzis, M. Mandrioli, A. Cherif, et al. 2010. Acetic acid bacteria, newly emerging symbionts of insects. Appl. Environ. Microbiol. 76: 6963–6970. Cure, J. D., and B. Acock. 1986. Crop responses to carbon dioxide doubling:
a literature survey. Agric. For. Meteorol. 38: 127–145.
Dadd, R. H. 1985. Nutrition: organisms. Comp. Insect Physiol. Biochem. Pharmacol. 4: 313–390.
Dakia, P. A., B. Wathelet, and M. Paquot. 2007. Isolation and chemical evalua-tion of carob (Ceratonia siliqua L.) seed germ. Food Chem. 102: 1368–1374. Dancewicz, K., K. Sznajder, D. Załuski, B. Kordan, and B. Gabryś. 2016.
Behavioral sensitivity of Myzus persicae to volatile isoprenoids in plant tissues. Entomol. Exp. Appl. 160: 229–240.
Davis, J. A., E. B. Radcliffe, and D. W. Ragsdale. 2006. Effects of high and fluctuating temperatures on Myzus persicae (Hemiptera: Aphididae). Environ. Entomol. 35: 1461–1468.
Defossez, E., C. Djiéto-Lordon, D. McKey, M. A. Selosse, and R. Blatrix. 2011. Plant-ants feed their host plant, but above all a fungal symbiont to recycle nitrogen. Proc. Biol. Sci. 278: 1419–1426.
Docherty, M., F. Wade, D. Hurst, J. Whittaker, and P. J. Lea. 1997. Responses of tree sap-feeding herbivores to elevated CO2. Glob. Chang. Biol. 3: 51–59.
Douglas, A. E. 1998. Nutritional interactions in insect-microbial symbioses: aphids and their symbiotic bacteria Buchnera. Annu. Rev. Entomol. 43: 17–37.
Douglas, A. E. 2006. Phloem-sap feeding by animals: problems and solutions. J. Exp. Bot. 57: 747–754.
Dubois, M., K. A. Gilles, J. K. Hamilton, P. T. Rebers, and F. Smith. 1956. Colorimetric method for determination of sugars and related substances. Anal. Chem. 28: 350–356.
Dumas, J. B. A. 1831. Procedes de I’analyse organique. Ann. Chim. Phys. 47: 198–205.
El-Ibrashy, M. T., S. El-ziadys, and A. A. Riad. 1972. Laboratory studies on the biology of the corn leaf aphid, Rhopalosiphum maidis (Homoptera: Aphididae). Entomol. Exp. Appl. 15: 166–174.
Everly, R. T. 1960. Loss in corn yield associated with the abundance of the corn leaf aphid, Rhopalosiphum maidis, in Indiana. J. Econ. Entomol. 53: 924–932.
Fangmeier, A., L. De Temmerman, C. R. Black, K. Persson, and V. Vorne.
2002. Effects of elevated CO2 and/or ozone on nutrient concentrations
and nutrient uptake of potatoes. Eur. J. Agron. 17: 353–368.
Foott, W. H., and P. R. Timmins. 1973. Effects of infestations by the corn leaf aphid, Rhopalosiphum maidis (Homoptera: Aphididae), on field corn in southwestern Ontario. Can. Entomol. 105: 449–458.
Gifford, R. M., D. J. Barrett, and J. L. Lutze. 2000. The effects of elevated CO2 on the C:N and C:P mass ratios of plant tissues. Plant Soil 224: 1–14. Hale, B. K., J. S. Bale, J. Pritchard, G. J. Masters, and V. K. Brown. 2003.
Effects of host plant drought stress on the performance of the bird cher-ry-oat aphid, Rhopalosiphum padi (L.): a mechanistic analysis. Ecol. Entomol. 28: 666–677.
Hartley, S. E., C. G. Jones, G. C. Couper, and T. H. Jones. 2000. Biosynthesis of plant phenolic compounds in elevated atmospheric CO2. Glob. Chang. Biol. 6: 497–506.
Havelka, U. D., V. A. Wittenback, and M. G. Boyle. 1984. CO2 enrichment
effects on wheat yield and physiology. Crop Sci. 24: 1163–1168. Himanen, S. J., A. Nissinen, S. Auriola, G. M. Poppy, C. N. Stewart, Jr, J. K.
Holopainen, and A. M. Nerg. 2008. Constitutive and herbivore-inducible glucosinolate concentrations in oilseed rape (Brassica napus) leaves are not affected by Bt Cry1Ac insertion but change under elevated atmos-pheric CO2 and O3. Planta. 227: 427–437.
Högy, P., and A. Fangmeier. 2008. Effects of elevated atmospheric CO2 on
grain quality of wheat. J. Cereal Sci. 48: 580–591.
Holopainen, J. K. 2002. Aphid response to elevated ozone and CO2. Entomol.
Exp. Appl. 104: 137–142.
Hughes, L., and F. A. Bazzaz. 2001. Effects of elevated CO2 on five plant‐aphid
interactions. Entomol. Exp. Appl. 99: 87–96.
Ingvardsen, C., and B. Veierskov. 1994. Response of young barley plants to CO2 enrichment. J. Exp. Bot. 45: 1373–1378.
ISO/TS. 2016. Food products-Determination of the total nitrogen content by combustion according to the Dumas principle and calculation of the crude protein content. Part 2: cereals, pulses and milled cereal products. p. 25. International Organization for Standardization (ISO), Geneva, Switzerland.
Jablonski, L. M., X. Wang, and P. S. Curtis. 2002. Plant reproduction under elevated CO2 conditions: a meta‐analysis of reports on 79 crop and wild species. New Phytol. 156: 9–26.
Jensen, N., R. M. Allen, and D. J. Marshall. 2013. Adaptive maternal and paternal effects: gamete plasticity in response to parental stress. Funct. Ecol. 28: 724–733.
Jiang, S., T. Liu, F. Yu, T. Li, M. N. Parajulee, L. Zhang, and F. Chen. 2016. Feeding behavioral response of cotton aphid, Aphis gossypii, to elevated CO2: EPG test with leaf microstructure and leaf chemistry. Entomol. Exp. Appl. 160: 219–228.
Johns, C. V., and L. Hughes. 2002. Interactive effects of elevated CO2 and
temperature on the leaf-miner Dialectica scalariella Zeller (Lepidoptera: Gracillariidae) in Paterson’s Curse, Echium plantagineum (Boraginaceae). Glob. Chang. Biol. 8: 142–152.
Karley, A. J., A. E. Douglas, and W. E. Parker. 2002. Amino acid composition and nutritional quality of potato leaf phloem sap for aphids. J. Exp. Biol. 205: 3009–3018.
Kazemi, M., and H. Van Emden. 1992. Partial antibiosis to Rhopalosiphum
padi in wheat and some phytochemical correlations. Ann. Appl. Biol. 121:
1–9.
Kimball, B. A., R. L. LaMorte, R. S. Seay, P. J. Pinter, R. R. Rokey, D. J. Hunsaker, W. A. Dugas, M. L. Heuer, J. R. Mauney, G. R. Hendrey,
K. F. Lewin, and J. Nagy. 1994. Effects of free-air CO2 enrichment on
energy balance and evapotranspiration of cotton. Agric. For. Meteorol. 70: 259–278.
Kriegler, R. J. 1972. Neutralization of Na+ Ions in “HCl-Grown” SiO2. Appl.
Phys. Lett. 20: 449–451.
Krumbein, A., H. P. Kläring, I. Schonhof, and M. Schreiner. 2010. Atmospheric carbon dioxide changes photochemical activity, soluble sugars and volatile levels in broccoli (Brassica oleracea var. italica). J. Agric. Food Chem. 58: 3747–3752.
Leakey, A. D., M. Uribelarrea, E. A. Ainsworth, S. L. Naidu, A. Rogers, D. R. Ort, and S. P. Long. 2006. Photosynthesis, productivity, and yield of maize are not affected by open-air elevation of CO2 concentration in the absence of drought. Plant Physiol. 140: 779–790.
Lincoln, D. E., E. D. Fajer, and R. H. Johnson. 1993. Plant-insect herbi-vore interactions in elevated CO(2) environments. Trends Ecol. Evol. 8: 64–68.
Lindroth, R. L. 2010. Impacts of elevated atmospheric CO2 and O3 on forests:
phytochemistry, trophic interactions, and ecosystem dynamics. J. Chem. Ecol. 36: 2–21.
Loladze, I. 2002. Rising atmospheric CO2 and human nutrition: toward
glob-ally imbalanced plant stoichiometry? Trends Ecol. Evol. 17: 457–461. Marks, S., and D. E. Lincoln. 1996. Antiherbivore defense mutualism under
elevated carbon dioxide levels: a fungal endophyte and grass. Environ. Entomol. 25: 618–623.
Mattson, J. W. J. 1980. Herbivory in relation to plant nitrogen content. Annu. Rev. Ecol. Evol. Syst. 11: 119–161.
Mittler, T. E. 1967. Effect on aphid feeding of dietary methionine. Nature. 214: 386.
Mittler, T. E. 1971. Dietary amino acid requirements of the aphid Myzus
per-sicae affected by antibiotic uptake. J. Nutr. 101: 1023–1028.
Mondor, E. B., M. N. Tremblay, C. S. Awmack, and R. L. Lindroth. 2005. Altered genotypic and phenotypic frequencies of aphid populations under enriched CO2 and O3 atmospheres. Glob. Chang. Biol. 11: 1990–1996. Moore, S., and W. H. Stein. 1954. A modified ninhydrin reagent for the
pho-tometric determination of amino acids and related compounds. J. Biol. Chem. 211: 907–913.
Nardi, J. B., R. I. Mackie, and J. O. Dawson. 2002. Could microbial symbionts of arthropod guts contribute significantly to nitrogen fixation in terrestrial ecosystems? J. Insect Physiol. 48: 751–763.
Norby, R. J., E. H. Delucia, B. Gielen, C. Calfapietra, C. P. Giardina, J. S. King, J. Ledford, H. R. McCarthy, D. J. Moore, R. Ceulemans, et al. 2005. Forest response to elevated CO2 is conserved across a broad range of pro-ductivity. Proc. Natl. Acad. Sci. U. S. A. 102: 18052–18056.
Oehme, V., P. Högy, C. P. Zebitz, and A. Fangmeier. 2013. Effects of elevated atmospheric CO2 concentrations on phloem sap composition of spring crops and aphid performance. J. Plant Interact. 8: 74–84.
Ohtaka, C., and H. Ishikawa. 1991. Effects of heat treatment on the symbiotic system of an aphid mycetocyte. Symbiosis. 11: 19–30.
Pescod, K. V., W. P. Quick, and A. E. Douglas. 2007. Aphid responses to plants with genetically manipulated phloem nutrient levels. Physiol. Entomol. 32: 253–258.
Pritchard, J., B. Griffiths, and E. Hunt. 2007. Can the plant-mediated impacts on aphids of elevated CO2 and drought be predicted? Glob. Chang. Biol. 13: 1616–1629.
Puterka, G. J., S. J. Nicholson, and W. R. Cooper. 2017. Survival and feeding rates of four Aphid species (Hemiptera: Aphididae) on various sucrose concentrations in diets. J. Econ. Entomol. 110: 1518–1524.
Roth, S. K., and R. L. Lindroth. 1995. Elevated atmospheric CO2: effects on
phytochemistry, insect performance and insect-parasitoid interactions. Glob. Chang. Biol. 1: 173–182.
Ryle, G. J. A., C. E. Powell, and V. Tewson. 1992. Effect of Elevated CO2 on the photosynthesis, respiration and growth of perennial ryegrass. J. Exp. Bot. 43: 811–818.
Sandström, J. 2000. Nutritional quality of phloem sap in relation to host plant-alternation in the bird cherry-oat aphid. Chemoecology. 10: 17–24. Sandström, J. P., and N. A. Moran. 2001. Amino acid budgets in three aphid
species using the same host plant. Physiol. Entomol. 26: 202–211. Sandström, J., and J. Pettersson. 1994. Amino-acid composition of phloem
sap and the relation to intraspecific variation in pea-aphid (Acyrtosiphon
pisum) performance. J. Insect Physiol. 40: 947–955.
Sarria, E., M. Cid, E. Garzo, and A. Fereres. 2009. Excel workbook for automatic parameter calculation of EPG data. Comput. Electron. Agric. 67: 35–42. Schädler, M., M. Roeder, R. Brandl, and D. Matthies. 2007. Interacting effects
of elevated CO2, nutrient availability and plant species on a generalist invertebrate herbivore. Glob. Chang. Biol. 13: 1005–1015.
Schloss, P. D., I. J. Delalibera, J. Handelsman, and K. F. Raffa. 2006. Bacteria asso-ciated with the guts of two wood-boring beetles: Anoplophora glabripennis and Saperda vestita (Cerambycidae). Environ. Entomol. 35: 625–629. Seneweera, S. P., and J. P. Conroy. 2005. Enhanced leaf elongation rates of
wheat at elevated CO2: is it related to carbon and nitrogen dynamics within the growing leaf blade? Environ. Exp. Bot. 54: 174–181.
Sicher, R. C. 2008. Effects of CO2 enrichment on soluble amino acids and
organic acids in barley primary leaves as a function of age, photoperiod and chlorosis. Plant Sci. 174: 576–582.
Spiteller, D., K. Dettner, and W. Bolan. 2000. Gut bacteria may be involved in interactions between plants, herbivores and their predators: microbial biosynthesis of N-acylglutamine surfactants as elicitors of plant volatiles. Biol. Chem. 381: 755–762.
Srivastava, P. N., and J. L. Auclair. 1971. Influence of sucrose concentration on diet uptake and performance by the Pea Aphid, Acyrthosiphon pisum. Ann. Entomol. Soc. Am. 64: 739–743.
Srivastava, P. N., J. Auclair, and U. Srivastava. 1983. Effect of nonessential amino acids on phagostimulation and maintenance of the pea aphid,
Acyrthosiphon pisum. Can. J. Zool. 61: 2224–2229.
Srivastava, P. N., Y. Gao, J. Levesque, and J. L. Auclair. 1985. Differences in amino acid requirements between two biotypes of the pea aphid,
Acyrthosiphon pisum. Can. J. Zool. 63: 603–606.
Stiling, P., and T. Cornelissen. 2007. How does elevated carbon dioxide (CO2)
affect plant–herbivore interactions? A field experiment and meta-analysis of CO2-mediated changes on plant chemistry and herbivore performance. Glob. Chang. Biol. 13: 1823–1842.
Stocker, T. F., Qin, D., Plattner, G. K., Tignor, M. M., Allen, S. K., Boschung, J., Nauels, A., Xia, Y., Bex, V., Midgley, P. M. 2013. IPCC, 2013: Climate
Change 2013: The Physical Science Basis. Contribution of Working Group I to the Fifth Assessment Report of the Intergovernmental Panel on Climate Change. Cambridge University Press, Cambridge, MA.
Sun, Y. C., B. B. Jing, and F. Ge. 2009a. Response of amino acid changes in Aphis gossypii (Glover) to elevated CO2 levels. J. Appl. Entomol. 133: 189–197.
Sun, Y. C., F. J. Chen, and F. Ge. 2009b. Elevated CO2 changes
interspe-cific competition among three species of wheat aphids: Sitobion avenae,
Rhopalosiphum padi, and Schizaphis graminum. Environ. Entomol. 38:
26–34.
Tjallingii, W. F., and T. Hogen-Esch. 1993. Fine structure of aphid stylet routes in plant tissues in correlation with EPG signals. Physiol. Entomol. 18: 317–328.
Tuchman, N. C., R. G. Wetzel, S. T. Rier, K. A. Wahtera, and J. A. Teeri. 2002. Elevated atmospheric CO2 lowers leaf litter nutritional quality for stream ecosystem food webs. Glob. Chang. Biol. 8: 163–170.
Wang, N., and P. S. Nobel. 1995. Phloem exudate collected via scale insect stylets for the cam species Opuntia-ficus-indica under current and doubled CO2 concentrations. Ann. Bot. 75: 525–532.
Weibull, J. 1987. Seasonal changes in the free amino acids of oat and barley phloem sap in relation to plant growth stage and growth of Rhopalosiphum
padi. Ann. Appl. Biol. 111: 729–737.
Williams, R. S., D. E. Lincoln, and R. J. Norby. 1998. Leaf age effects of ele-vated CO2-grown white oak leaves on spring-feeding lepidopterans. Glob. Chang. Biol. 4: 235–246.
Williams, R. S., R. J. Norby, and D. E. Lincoln. 2000. Effects of elevated CO2
and temperature-grown red and sugar maple on gypsy moth performance. Glob. Chang. Biol. 6: 685–695.
Wyatt, I. J., and P. F. White. 1977. Simple estimation of intrinsic increase rates for aphids and tetranychid mites. J. Appl. Ecol. 14: 757–766.
Xie, H., L. Zhao, W. Wang, Z. Wang, X. Ni, W. Cai, and K. He. 2014. Changes in life history parameters of Rhopalosiphum maidis (Homoptera: Aphididae) under four different elevated temperature and CO2 combina-tions. J. Econ. Entomol. 107: 1411–1418.
Zavala, J. A., P. D. Nabity, and E. H. DeLucia. 2013. An emerging understand-ing of mechanisms governunderstand-ing insect herbivory under elevated CO2. Annu. Rev. Entomol. 58: 79–97.
Zhang, Y., J. Fan, F. Francis, and J. Chen. 2017. Watery Saliva secreted by the grain aphid Sitobion avenae Stimulates Aphid resistance in wheat. J. Agric. Food Chem. 65: 8798–8805.
Zvereva, E., and M. Kozlov. 2006. Consequences of simultaneous elevation of carbon dioxide and temperature for plant–herbivore interactions: a meta analysis. Glob. Chang. Biol. 12: 27–41.