UNIVERSITÉ DE MONTRÉAL
PRODUCTION OF CHEMICALS BY MICROWAVE
THERMAL TREATMENT OF LIGNIN
SHERIF FARAG
DÉPARTEMENT DE GÉNIE CHIMIQUE ÉCOLE POLYTECHNIQUE DE MONTRÉAL
THÉSE PRÉSENTÉE EN VUE DE L’OBTENTION
DU DIPLÔME DE PHILOSOPHIAE DOCTOR (GÉNIE CHIMIQUE)
DÉCEMBRE 2013
UNIVERSITÉ DE MONTRÉAL
ÉCOLE POLYTECHNIQUE DE MONTRÉAL
Cette thèse intitulée :
PRODUCTION OF CHEMICALS BY MICROWAVE
THERMAL TREATMENT OF LIGNIN
présentée par : FARAG Sherif
en vue de l’obtention du diplôme de : Philosophiae Doctor a été dûment acceptée par le jury d’examen constitué de : M. STUART Paul, Ph.D., président
M. CHAOUKI Jamal, Ph.D., membre et directeur de recherche M. AKYEL Cevdet, D.Sc.A., membre et codirecteur de recherche M. SRINIVASAN Bala, Ph.D., membre
DEDICATION
ACKNOWLEDGMENTS
Thanks be to God for everything I have in my life.
I would never have been able to finish this dissertation without the guidance of my supervisors, help from my friends, and support from my parents and my wife.
First of all, I would like to sincerely thank my supervisor, Dr. Jamal Chaouki, for his guidance, encouragement, understanding, patience, and most importantly, his friendship during my Ph.D. His mentorship was paramount in finding the optimum methodology and achieving my objectives. He encouraged me to grow as an independent thinker, which improved not only my scientific thinking, but all aspects of my life.
For everything you have done for me, Dr. Jamal Chaouki, I thank you.
I would like to express my deep thanks to my co-supervisor, Dr. Cevdet Akyel, for his support, guidance, encouragement, and helpful suggestions regarding the all issues belonging to his field. I am also thankful to all my committee members for agreeing to be a member of the jury.
I would also like to thank Dr. Amr Sobhy, who was the first researcher in this field in Dr. Chaouki’s group. He is a good friend and always willing to help and give excellent suggestions. I would like to extend my thanks to all my colleagues and friends in Dr. Chaouki’s group for sharing knowledge and ideas. I am thankful to Ms. Soumaya Benzennou, and Mr. Philippe Leclerc, for helping me to write the French section of this dissertation. Many thanks also to Dr. Levent Erdogan (Electrical Engineering Department, École Polytechnique de Montréal) for his assistance to measure the dielectric properties of the investigated materials.
Special thanks go to all secretaries and technical staff of the chemical engineering department; in particular, Ms. Martine Lamarche, Mr. Robert Delisle, Mr. Yazid Belkhir, Mr. Jean Huard, and Mr. Gino Robin, for their assistance.
I am grateful for the financial and technical support from Lignoworks NSERC Strategic Network (www.lignoworks.ca), and the Agricultural Biorefinery Innovation Network (ABIN).
I would never have accomplished this dissertation without the lovely life that I have with my family: my wife Mai Attia, and my kids Yara and Omer. I would like to express my deep thanks for their support, encouragement, patience, understanding, and unwavering love from my wife in good times and bad.
Finally, and most important, I would like to express my fervent thanks to my parents, for everything they have done for me. Indeed, they are the main reason behind all my successes. I also wish to extend my thanks to my sisters and brothers—and in particular, my older brother Nasser—for their love, support, and encouragement.
Sherif FARAG
École Polytechnique de Montréal Fall 2013
RÉSUMÉ
Ce travail a pour but d’étudier le potentiel de convertir un des composants de la biomasse lignocellulosique, la lignine, en produits à valeur ajoutée en utilisant la pyrolyse assistée par microondes (MWP). Pour atteindre cet objectif, plusieurs étapes ont été franchies. Nous avons tout d’abord réussi à prédire les profils de température au sein d’un matériau exposé aux ondes électromagnétiques (EMW) à l’aide d’un modèle mathématique tridimensionnel. Ensuite, un TGA-microondes (MW-TGA) original a été développé et mis en œuvre pour l’étude cinétique. Subséquemment, une comparaison entre la pyrolyse assistée par microondes et conventionnelle a été réalisée. L’étude structurelle détaillée de la bio-huile produite via MWP de la lignine kraft a été discutée en troisième étape. Finalement, un modèle cinétique des produits de la MWP ainsi que des produits chimiques extraits de la lignine kraft a été mis en place.
Tout d’abord, un modèle mathématique tridimensionnel a été présenté pour simuler le profil de température à l’intérieur d’un matériau exposé aux ondes électromagnétiques à 2.45 GHz. Les applications de COMSOL-Multiphysics ont permis de simuler le profil de température transitoire pour la pinède, le carbone, le Pyrex et des combinaisons de ces matériaux sous différentes conditions. Les résultats prédits ont été comparés aux données expérimentales pour la validation du modèle. Cette étude nous a permis de conclure que le chauffage microondes (MWH) induit à une distribution non-uniforme de la température dûment à la longueur de pénétration (Dp) et à la perte surfacique de chaleur. Toutefois, le gradient de température peut être minimisé significativement si l’on réduit les dimensions du matériau exposé à deux fois la Dp et l’on place un bon isolant thermique à sa surface. Le positionnement des matériaux avec forte/faible capacité de convertir la radiation microonde en chaleur pourrait favoriser des zones chaudes/froides désirées à l’intérieur du matériau chauffé, ce qui permet un profil spécifique de température. En outre, l’addition de matériaux de forte capacité de convertir les microondes en chaleur à la charge permet d’atteindre des températures beaucoup plus importantes comparées au cas du matériau seul exposé à la même puissance et temps de chauffage. Les discussions présentées dans cette étude visent à améliorer l’état de l’art par rapport aux profils de température dans un matériau
composite soumis au chauffage microondes ainsi qu’à développer une approche pour influencer/contrôler ces profils de température selon la sélection des matériaux.
L’objectif principal de la deuxième étape est d’étudier la cinétique de la MWP versus la pyrolyse conventionnelle (CP). Pour ce faire, un MW-TGA original a été construit et équipé d’un thermomètre novateur. Ce thermomètre est exempt des désavantages des thermomètres traditionnels dans le cas du MWH. Ainsi, le travail expérimental impliquant la MWP et la CP de la sciure de bois a été accompli. Des programmes MATLAB® ont été développés pour estimer les paramètres cinétiques, à savoir l’énergie d’activation, le facteur pré-exponentiel ainsi que l’ordre de la réaction (Ea, ko, et n, respectivement). Nous avons essentiellement conclu de ce travail que la MWP a une vitesse de réaction plus importante que celle de la CP. Ceci peut s’expliquer par le fait que les EMW oscillantes ont engendré un mouvement chaotique plus aigu des molécules ce qui influence le paramètre ko. Malgré cet effet remarquable sur ce ko, l’énergie d’activation demeure presque constante dans les deux cas. La possibilité de l’influence directe des ondes sur les liaisons intermoléculaires semble être ténue vu que la longueur des ondes est beaucoup plus grande que la distance intramoléculaire. Ce résultat est aussi puissant qu’il permettrait d’interpréter une grande majorité des effets du MWH reportés dans différentes réactions.
La troisième étape présente une analyse détaillée de la structure des huiles produites par MWP de la lignine kraft. L’effet de deux paramètres a été évalué : (1) l’ajout d’un bon convertisseur de microondes-en-chaleur (noir de carbone) entre 20 et 40 wt%, et (2) la puissance nominale des microondes entre 1.5 et 2.7 kW. Cinq combinaisons pour ces deux variables ont été choisies pour lesquelles la radiation microondes a été gardée pendant 800 s. Les températures finales atteintes, mesurées en tant que valeur moyenne spatiale, étaient 900, 980, 1065, 1150, et 1240 K. Les rendements en produits de pyrolyse, solides, gaz condensables, et gaz non-condensables ont été comparés pour les conditions opératoires étudiées. Les gaz condensables collectés ont été séparés selon une phase-huile, prédominée de produits chimiques, et une phase aqueuse contenant surtout de l’eau et ayant une densité moindre que la phase-huile. Les résultats obtenus montrent que l’augmentation de la vitesse de chauffe et de la température finale induit une augmentation du
rendement en produits liquides. Les produits identifiés dans les huiles par GC-MS étaient majoritairement aromatiques : gaïacols, phénols, and catéchols. Toutefois, autour de 60 wt% n’a pas pu être identifié par GC-MS d’où le recours à la spectroscopie RMN 31P et 13C offrant plus de détails sur la composition structurelle des huiles. Selon l’analyse RMN, 80% du carbone détecté dans la phase-huile était un carbone aromatique. Les groupes hydroxyliques aliphatiques perçus dans la matière première ont été éliminés significativement dans l’huile; ceci est attribué à la formation provisoire de la molécule d’eau pendant la MWP. La concentration en groupes hydroxyliques phénoliques C5 substitués/condensés a baissée en faveur des groupes gaïacol, p-hydroxyphenyl, et catéchol hydroxyle. Un cheminement de dégradation détaillé pour chacune de ces conversions a été suggéré. Une telle étude est essentielle à la compréhension du cheminement de dégradation ainsi qu’à la composition structurelle des huiles de pyrolyse.
La quatrième étape fait l’objet d’une étude cinétique pour la MWP de la lignine kraft en appliquant des modèles tridimensionnels. Pour atteindre cet objectif, le MW-TGA utilisé pour la deuxième étape a été modifié et utilisé. Les modifications apportées ont permis de séparer les gaz produits (condensables et non-condensables) en sept parties. Le matériau convertisseur de microondes-en-chaleur a été ajouté à 30 wt% de la masse totale et la puissance nominale était de 2.1 kW. Le premier modèle considère la conversion de la matière première en solide, gaz condensable et gaz non-condensable en considérant que chaque produit est un bloc individuel. Dans le second modèle, le liquide est séparé en huile, contenant que des produits chimiques et 0% d’eau, et en eau ne contenant aucun produit chimique. Les produits sont ainsi l’huile, l’eau, les gaz non-condensables et le solide. De plus amples recherches ont été réalisées dans le troisième modèle en analysant l’huile produite par GC-MS. L’huile est donc subdivisée en quatre catégories : (1) phénoliques, contenant tous les composés phénoliques identifiés, (2) aromatiques à haute masse moléculaire, comportant toutes les molécules lourdes et les produits non identifiés par GC-MS, (3) aromatiques monocyclique non-phénoliques et (4) aliphatiques. Par conséquent, le troisième modèle considère la pyrolyse de la lignine en sept produits : ceux cités précédemment plus l’eau, les gaz non-condensables et le solide. Les paramètres cinétiques de chaque modèle ont été estimés et appliqués pour prédire la distribution des produits pour chaque modèle. Finalement, les résultats prédits ont été comparés aux données expérimentales aux fins de validation.
ABSTRACT
This work investigates the potential of converting one of the lignocellulosic biomass components, lignin, into value-added bio-products using microwave pyrolysis (MWP). To achieve this objective, a multi-step process was devised and accomplished. First, temperature profiles within a material exposed to electromagnetic waves (EMW) were predicted using a three dimensional mathematical model. Second, an original microwave-thermo gravimetric analyzer (MW-TGA) was designed and built for kinetic purposes, and the kinetics of MWP were investigated in contrast to conventional pyrolysis (CP). Third, a detailed structural investigation of a bio-oil produced from of kraft lignin using MWP was discussed at various conditions. Finally, a kinetic modeling of the MWP products from kraft lignin was achieved quantitatively, as well as qualitatively.
In the first step, a three-dimensional mathematical model was created to simulate temperature profiles inside a material exposed to EMW at 2.45 GHz. COMSOL-Multiphysics applications were used to simulate transient temperature profiles of pinewood, carbon, Pyrex, and combinations of these materials under different conditions. The predicted results were compared against the experimental data in order to validate the presented model. The key conclusions of this study show that microwave heating (MWH) leads to non-uniform distribution of temperature due to material penetration depth (Dp) and surface heat loss. However, limiting the dimensions of the exposed material to twice the Dp and placing strong thermal insulation on the surface significantly minimize temperature gradients. The locations of materials which are strong or weak microwave-to-heat convertors can be manipulated to create desired hot or cold zones inside the heated material, which leads to specific temperature profiles. In addition, the homogenous mixing of a material strong microwave-to-heat converter with the payload exhibits a significant increase in temperature, compared to the virgin material exposed to the same power and heating time. This study aims at improving the understanding of temperature profiles within composite materials subjected to MWH, as well as developing approaches to influence/control temperature profiles through material selection.
The main objective of the second step was to investigate the kinetics of MWP in contrast to CP. To achieve this objective, an original MW-TGA was built and equipped with an innovative thermometer, which does not suffer from the traditional drawbacks, particularly in case of MWH. Subsequently, experimental work on MWP and CP of sawdust was conducted. MATLAB® program codes were employed to estimate the kinetic parameters, activation energy, pre-exponential factors, and reaction orders (Ea, ko, and n, respectively). The key conclusions of this investigation indicate that MWP has a faster reaction rate than CP. This is a consequence of enhancing the molecular chaotic motion resulting from the oscillating EMW: the molecular mobility, which is represented by ko. Even though this noticeable effect on ko, the estimated value of Ea was almost the same in both cases, this might be a consequence of the tenuous possibility of direct hacking the molecule-bonds by applied EMW, since the wavelength of EMW is much longer than the intermolecular distance of the target material. This result is so significant that it can account for most of the effects observed in different reactions when MWH is applied.
The third step investigated a detailed structural and compositional analysis of a bio-oil produced from kraft lignin using MWP. The effects of two parameters were considered: (1) loading of a strong microwave-to-heat convertor (char), 20-40 wt%, and (2) microwave nominal setting power, 1.5-2.7 kW. Five combinations of these two variables were chosen and applied for 800s of MWH. The reached final temperatures, measured as mean values, were 900, 980, 1065, 1150, and 1240 K. The yields of the pyrolysis products, solid, condensable gas, and non-condensable gas were compared at the conditions under investigation. The collected condensable gas was separated into oil phase, which is mostly chemicals, and aqueous phase, which is mostly water and lower density than the oil phase. The obtained results showed that increases the heating rate leads to an increase in the yield of the liquid product. The identified chemical compounds in the oil phase using GC-MS were mostly aromatics: guaiacols, phenols, and catechols. Nonetheless, at 60 wt%, the oil phases could not be identified using GC-MS. Therefore, 31P and 13C NMR spectroscopy were used to provide further detailed structural information. Based on the NMR analyses, up to 80% of the detected carbon atoms in the oil phase were aromatic carbons. The detected aliphatic hydroxyl groups in the virgin material were significantly eliminated in the oil phase, and this was attributed to water forming in the interim of MWP. The decreased concentrations of C5 substituted/condensed phenolic hydroxyl groups after MWP were attributed
to an increase in the concentrations of guaiacyl, p-hydroxyphenyl, and catechol hydroxyl groups. Detailed degradation pathways for each of those conversions were suggested. Such an investigation is significant because it aims at improving the understanding of the degradation pathways of a lignin network, as well as the structure of the obtained bio-oil.
In the final step, a kinetic investigation of kraft lignin products made from MWP was accomplished by applying three different models. To achieve this objective, the MW-TGA that was built in the second step was modified and used in this step. The modifications done on the MW-TGA enable the distribution of vapor products (condensable and non-condensable) up to 7 parts in the interim of MWP. The applied conditions were 30 wt% of char and a microwave nominal power setting of 2.1 kW. The first model considered the virgin material converted into condensable gas, non-condensable gas, and remaining solid, taking into consideration each product as an individual lump. In the second model, the liquid product was separated into oil, which is entirely chemical and contains 0 wt% water, and water, which contains 0 wt% chemicals. Therefore, the lumps of the second model were oil, water, non-condensable gas, and solid. Further investigations were achieved in the third model by analysing the oil product using GC-MS. The oil product was partitioned into four groups: (1) phenolics group, which contains all the identified phenolic components, (2) heavy molecular weight components group, which contents all the heavy molecular weight and the undefined components using a GC-MS analyzer, (3) aromatics with a single ring (non-phenolics) group, and (4) aliphatics group. Hence, the third model considered lignin converted into seven products, the above four groups, plus water, non-condensable gas, and solid. The kinetic parameters of each model were estimated, and then applied to predict the yield of each product at the selected temperatures. Finally, the predicted results were compared against the experimental data, which showed a high capacity of the presented models to estimate product yields.
TABLE OF CONTENT
DEDICATION ... III ACKNOWLEDGMENTS ... IV RÉSUMÉ ... VI ABSTRACT ... IX TABLE OF CONTENT ...XII LISTE OF TABLES ... XVI LISTE OF FIGURES ... XVIII LIST OF ABBREVIATIONS ... XXI
CHAPTER 1 INTRODUCTION ... 1
1.1 Background ... 1
1.2 The Lignocellulosic Biomass Components ... 1
1.3 Lignin Structure ... 3
1.4 Conversion of Biomass ... 4
1.4.1 Pyrolysis of Biomass ... 4
1.5 Microwave Heating Fundamentals ... 6
1.6 Microwave-Assisted Pyrolysis ... 10
1.7 Temperature Gradient in MWH ... 12
1.8 Effect of MWH on Different Reactions ... 12
1.9 Pyrolysis of Lignin and Products Investigation ... 14
1.10 Pyrolysis Modeling ... 16
CHAPTER 3 ARTICLE 1: TEMPERATURE PROFILE PREDICTION WITHIN
SELECTED MATERIALS HEATED BY MICROWAVES AT 2.45GHZ... 20
3.1 Introduction ... 22
3.2 Fundamentals of MWH ... 24
3.2.1 Microwave/Material Interaction ... 24
3.2.2 The Main Parameters Describing MWH ... 25
3.2.3 Dissipated/Absorbed Power ... 25
3.2.4 Penetration Depth and Power Penetration Depth ... 26
3.2.5 Estimation of the Dissipated/Absorbed Power Term ... 27
3.3 Mathematical Model ... 28
3.4 Results ... 29
3.4.1 The Effect of Dp on the Temperature Profile for a Pinewood Block ... 31
3.4.2 The Effect of Different Material Types ... 34
3.4.3 The Effect of Adding Material with Stronger Interaction with the EMW ... 34
3.4.4 The Effect of Replacing a Fraction of the Wood Block with Carbon ... 35
3.4.5 The Effect of the Spatial Position of Carbon within the Cube ... 36
3.4.6 The Effect of Two Carbon Cylinders in the Wooden Cube ... 37
3.4.7 The Effect of Replacing a Fraction of the Wood with Materials of Weak Interaction with EMW ... 39
3.5 Experimental Validation of the Model ... 39
3.6 Conclusion and Future Developments ... 41
CHAPTER 4 ARTICLE 2: A KINETIC INVESTIGATION OF MICROWAVE PYROLYSIS OF SAWDUST USING AN ORIGINAL MICROWAVE – THERMOGRAVIMETRIC ANALYZER ... 44
4.2 The Experimental Work ... 49
4.2.1 The Material ... 49
4.2.2 The Experimental Setup ... 50
4.3 The Development for Measuring the Transient Mean Temperature ... 51
4.4 The Conventional Pyrolysis Method ... 57
4.5 The Kinetic Model ... 57
4.6 Parameter Estimation ... 59
4.7 The Results ... 59
4.7.1 The Decomposition Fraction vs. Temperature ... 59
4.7.2 The Estimated Kinetic Parameters ... 60
4.8 The Discussion ... 62
4.9 The Conclusion ... 64
Acknowledgements ... 65
CHAPTER 5 ARTICLE 3: A DETAILED COMPOSITIONAL ANALYSIS AND STRUCTURAL INVESTIGATION OF A BIO-OIL FROM MICROWAVE PYROLYSIS OF KRAFT LIGNIN... ... 66
5.1 Introduction ... 68
5.2 The Experimental Work ... 71
5.2.1 The Virgin Material ... 71
5.2.2 The Experimental Design ... 72
5.2.3 The Experimental Setup ... 73
5.2.4 The Method ... 74
5.3 Results and Discussion ... 75
5.3.1 The Products Distribution ... 75
5.3.3 The Quantitative 31P NMR Analyses for the Oil Phase ... 80
5.3.4 Quantitative 13C NMR Analyses for the Oil Phase ... 86
5.4 Conclusions and Future Work ... 90
5.5 Acknowledgements ... 90
CHAPTER 6 ARTICLE 4: A LUMPED APPROACH IN KINETIC MODELING OF MICROWAVE-PYROLYSIS OF KRAFT LIGNIN ... 92
6.1 Introduction ... 94
6.2 The Experimental Work ... 96
6.2.1 The Virgin Material ... 96
6.2.2 The Experimental Setup ... 97
6.2.3 The Method ... 98
6.3 The Implemented Kinetic Models ... 100
6.3.1 The First Model ... 101
6.3.2 The Second Model ... 102
6.3.3 The Third Model ... 103
6.4 The Parameters Estimation ... 104
6.5 The Results and Discussions ... 105
6.6 Maximize the Phenolics Yield ... 115
6.7 The Validation of the Presented Models ... 116
6.8 The Conclusion and Future Work ... 118
CHAPTER 7 GENERAL DISCUSSION ... 120
CHAPTER 8 CONCLUSION AND RECOMMENDATIONS ... 124
8.1 Conclusions ... 124
8.2 Future Work and Recommendations ... 127
LISTE OF TABLES
Table 1.1: The dielectric properties of selected materials (Durka, Van Gerven et al. 2009) ... 8
Table 3.1: Input parameters for MWH model (Vos, Mosman et al. 2003, D.E. Clark 2005, Kol 2009) ... 30
Table 3.2: Domain characteristics defined in the model ... 30
Table 4.1: Summary of the effects of MWH on different reactions ... 47
Table 4.2: The estimated kinetic parameters in MWP and CP of sawdust ... 61
Table 4.3: Effect of MWH on reaction kinetics compared to CH ... 63
Table 5.1: The coded vales and the corresponding actual values applied in MWP of Kraft lignin ... 72
Table 5.2: The measured water content in the aqueous and oil phase at every run ... 77
Table 5.3: The identified chemical components in the oil and aqueous phases using GC-MS ... 79
Table 5.4: Concentrations of different hydroxyl groups determined by quantitative 31P NMR spectroscopy of the virgin lignin and the oil phases obtained after microwave pyrolysis at various power levels, char wt%, and temperatures. ... 82
Table 5.5: Concentrations of different types of carbon atoms measured by quantitative 13C NMR spectroscopy of the virgin lignin and the oil phase after pyrolysis at different power settings, char wt%, and temperatures ... 87
Table 5.6: Concentrations of different hydroxyl groups determined by quantitative 31P NMR spectroscopy of the virgin lignin and the oil phases obtained after microwave pyrolysis and conventional pyrolysis at various conditions ... 89
Table 5.7: Concentrations of different types of carbon atoms measured by quantitative 13C NMR spectroscopy of an oil phase produced after microwave pyrolysis and conventional pyrolysis at various conditions ... 89
Table 6.2: The The measured water content in the aqueous and oil phases ... 108 Table 6.3: The estimated kinetic parameters of the water and oil products. ... 110 Table 6.4: The identified chemical components in the oil and aqueous phases using GC-MS
[mg/g] ... 112 Table 6.5: The estimated kinetic parameters of the extracted chemical groups. ... 115
LISTE OF FIGURES
Figure 1-1: Schematic representation: (A) cellulose, (B) hemicellulose, and (C) lignin (Gu, Ma et
al. 2013) ... 2
Figure 1-2: The three monolignols of a native lignin network: (A) coumaryl alcohol, (B) coniferyl alcohol, and (C) sinapyl alcohol ... 3
Figure 1-3: Pyrolysis of a lignin network and produced fragments in the liquid phase. ... 5
Figure 1-4: The electromagnetic spectrum (source: image courtesy of NASA) ... 6
Figure 1-5: Molecular oscillations in present of an oscillating electromagnetic field ... 7
Figure 1-6: Evolution of scientific research in the area of MWP in 2010 as compared to previous years (Luque, Menendez et al. 2012) ... 10
Figure 1-7: Schematic diagram of pyrolysis in one direction (A) CP and (B) MWP ... 11
Figure 1-8: Materials heated by MWH, (A) rubber stopper and (B) wood cube ... 12
Figure 3-1: Wood blocks heated by 2.45 GHz microwaves for 360 s at: (A) 2.3 kW with FC, (B) 2.3 kW with PI, and (C) Power 2.7 kW with FC ... 23
Figure 3-2: Schematic representation of the thermal balance on a dielectric element in the system ... 29
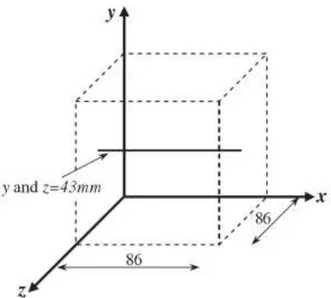
Figure 3-3: Line selected to simulate and measure the temperature profiles ... 31
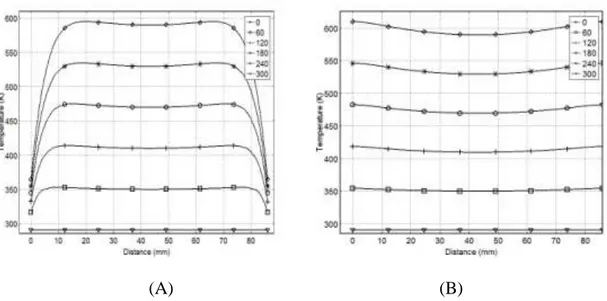
Figure 3-4: Temperature profiles on the selected line parallel to x axis and has 43 mm in y & z axis (time in seconds): (A) With FC and (B) With PI ... 32
Figure 3-5: The effect of heating time at constant microwave power on temperature profiles ... 32
Figure 3-6: Temperature profiles for FC: (A) For 200 mm cube side length and (B) For 400 mm cube side length ... 33
Figure 3-7: The effect of thermal conductivity values on Dp: (A) k=0.25 and (B) k=0.5 ... 34
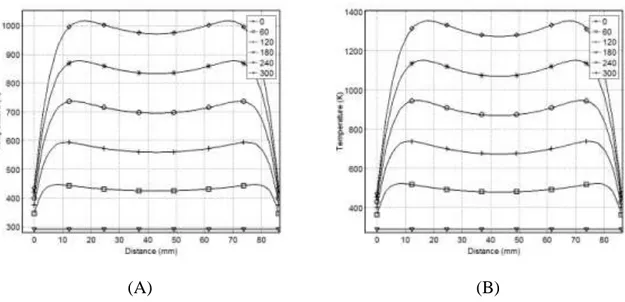
Figure 3-8: Effect of substituting wood with carbon over 300 s of MWH: (A) 50 wt-% carbon and (B) 75 wt-% carbon ... 35
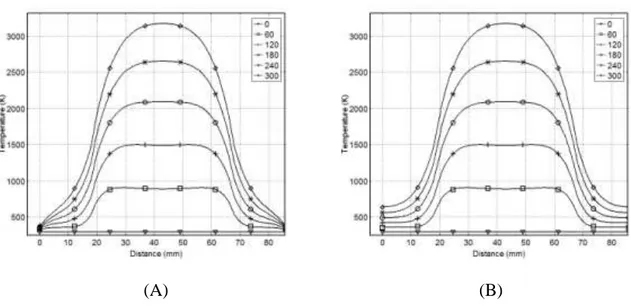
Figure 3-9: The effect of a carbon cube in the core of the wood block: (A) FC and (B) PI ... 36
Figure 3-10: The effect of a 3 mm carbon layer on the surface of the wood block: (A) FC and (B) PI ... 37
Figure 3-11: Wood block with two holes (D=13 mm) ... 38
Figure 3-12: Temperature profiles in the case of two carbon cylinders inside the wood block: (A) At the five points (A, B, C, D, and E) and (B) at the block center line ... 38
Figure 3-13: Effect of a Pyrex cube in the wood block core: (A) FC and (B) PI ... 39
Figure 3-14 Experimental and predicted results for validation of the model for the case of Free Convection (FC) ... 40
Figure 3-15: Experimental and theoretical results for verification of the model in the case of a wood block with two carbon cylinders ... 41
Figure 4-1: The microwave thermo-gravimetric analyzer setup ... 51
Figure 4-2: Drawing of the air-thermometer ... 53
Figure 4-3: The measured and the reference temperature values vs. the heating time ... 53
Figure 4-4: The axial transient temperature profiles within the sawdust (time in seconds) ... 56
Figure 4-5: The predicted mean temperatures vs. the experimental, within the heated material ... 56
Figure 4-6: (A) & (C) the decomposition fraction vs. temperature, experimental and predicted; and (B) & (D) the contour maps of CP and MWP respectively ... 60
Figure 4-7: The capability of the presented model: (A) CP and (B) MWP ... 61
Figure 5-1: The three monolignols of a lignin network: (A) coumaryl alcohol, (B) coniferyl alcohol, and (C) sinapyl alcohol ... 68
Figure 5-2: The experimental set-up ... 73
Figure 5-3: The transient mean temperature of MWP of Kraft lignin at two various conditions .. 74
Figure 5-4: The product distribution for the conditions under investigation ... 76
Figure 5-5: GC-MS chromatographs for the oil phase ... 78
Figure 5-7: Possible degradation pathways for: (A) aliphatic hydroxyl group, (B) carboxyl acid, and (3) guaiacyl hydroxyl groups ... 84 Figure 5-8: Possible degradation pathways of C5 substituted/condensed phenolic hydroxyl group:
(A) β-5, (B) 4-O-5, and (C) 5-5 ... 84 Figure 5-9: Quantitative 13C NMR spectra for the oil phase and the virgin material ... 86 Figure 6-1: The experimental setup, MW-TGA connected with a product manifold ... 97 Figure 6-3: The measured and the predicted transient mean temperature of the MWP of Kraft
lignin at 2.1 kW and 30 wt% char ... 100 Figure 6-4: (A) The experimental and predicted remaining solid fraction, (B) the contour map of
the calculated deviations using a first order reaction rate, (C) the transient condensable gas yield, and (D) the transient non-condensable gas yield ... 106 Figure 6-5: The experimental and predicted yield of: (A) the oil phase and (B) formed water. The
points are the experimental, and the line is the fitting ... 109 Figure 6-6: The typical GC-MS chromatographs: (A) the oil phase, and (B) the aqueous phase111 Figure 6-7: The experimental and predicted yields: (A) phenolics, (B) HMWC (C) ASR-Non-Ph,
and (D) aliphatics. The points are the experimental, and the line is the fitting ... 114 Figure 6-8. The estimated Phenolics yield at different heating rates and temperatures [g/g lignin]. ... 116 Figure 6-9: The capability of the presented models: (A) the first model, (B) the second model,
LIST OF ABBREVIATIONS
A Instantaneous yield of the aliphatic compounds
ASR-Non-Ph, Instantaneous yield of the aromatic single ring and non phenolic compounds
C Specific heat
Dp Penetration depth
Erms Root mean square of the electrical field
Ea Activation energy
f Frequency
G Transient yield of the non-condensable gas product
Hrms Root mean square of the magnetic field
K Thermal conductivity
k0 Pre-exponential factor
L Transient yield of the condensable gas product
m Mass
n Reaction rate
O Instantaneous yield of the oil product
P Power dissipated
pc Properties of carbon
Ph Instantaneous yield of the phenolics group
pm Properties of new mixture
pw Properties of pinewood
R The universal gas constant
S Remaining solid yield
T Temperature
t Time
V Volume
W Instantaneous yield of the water product
x Decomposition fraction
β Heating rate
𝜀∗ Complex permittivity
𝜀/ Dielectric constant 𝜀// Electric loss factor
𝜀0 Electric permittivity of free space 𝜀𝑒𝑓𝑓// Effective dielectric loss factor 𝜇0 Magnetic permeability of free space 𝜇𝑒𝑓𝑓// Effective magnetic loss factor
𝑡𝑎𝑛𝛿 Loss tangent
𝜔 Angular frequency
α Attenuation factor
CHAPTER 1
INTRODUCTION
1.1 Background
Forests are one the most significant of Canada’s resources, covering more than 400 million hectares, approximately half of the total area of the country and 10 per cent of the earth’s treed area (Benoit 2008). This potential has established the forest industry as one of the cornerstones of the Canadian economy. In 2006, this sector contributed 3% to Canada’s total gross domestic product (GDP). In addition, it provided more than 300,000 jobs, and between 500,000 and 600,000 indirect jobs across the country (Benoit 2008). Recently, however, the forest industry has reached a crossroads as it has been facing unexpected challenges for the past few years. The most serious of these challenges are increasing the competition with low-cost sources of wood, and the decline North American demand. The production of value-added forest-based products, in addition to traditional products, is one of the main solutions that can be applied to ensure a sustainable future for the industry. Therefore, this project aims to investigate the potential for converting lignocellulosic biomass/biomass waste into a value-added bio-product. This product diversification can deal with the current challenges, address the growing list of environmental concerns, and take advantage of expected rapid increase in price and demand of petrochemical-based energy and products.
1.2 The Lignocellulosic Biomass Components
Lignocellulosic biomass is composed of three intertwined components: cellulose, hemicellulose, and lignin. The distribution of each component depends on many factors, such as the species, the environment in which it was grown, and the extraction technique. Generally, the dry weight basis of each is 35-45% cellulose, 25–30% hemicellulose, and 20–35% lignin (Zakzeski, Bruijnincx et al. 2010, de Wild, Huijgen et al. 2012, Mu, Ben et al. 2013). The key to distinguishing between these three components is chemical structure, which can also help determine resistance to decomposition. As shown in Figure 1-1, hemicellulose is rich in branches and it is weakest compared with the other two components. It decomposes at a temperature range of 220-315 oC
with a solid residue of 20 wt% at 900 C. Cellulose consists of long polymers of glucose without branches; therefore, it is stronger than hemicellulose. It decomposes between 315 oC and 400 oC with 6.5 wt% of solid residue at 900 oC. Lignin mainly consists of aromatics with various branches, and the activity of the chemical bonds covers a wide range. Thus lignin is the strongest component compared to cellulose and hemicellulose; it decomposes over a temperature range of 100-900 oC with a solid residue of 45 wt% at 900 oC (Yang, Yan et al. 2007).
(A) (B)
(C)
Figure 1-1: Schematic representation: (A) cellulose, (B) hemicellulose, and (C) lignin (Gu, Ma et al. 2013)
1.3 Lignin Structure
Lignin is found in between and within plant cells, filling the cellulose and hemicellulose, and acting as a glue to hold them together. Lignin is not just one type; rather, it is many, all with complex chemical structures. Generally speaking, lignin is a three-dimensional amorphous polymer and one of the most complex organic aromatic polymers in nature (Zakzeski, Bruijnincx et al. 2010, Kibet, Khachatryan et al. 2012, Mu, Ben et al. 2013). Still, the exact structure of a native lignin network is unknown. However, it is believed to be based upon three aromatic alcohols: p-coumaryl, coniferyl, and sinapyl, as depicted in Figure 1-2 (Zakzeski, Bruijnincx et al. 2010, de Wild, Huijgen et al. 2012, Kibet, Khachatryan et al. 2012).
(A) (B) (C)
Figure 1-2: The three monolignols of a native lignin network: (A) coumaryl alcohol, (B) coniferyl alcohol, and (C) sinapyl alcohol
Although lignin is the only renewable resource among aromatics in nature, it has received less research attention than cellulose and hemicellulose (Ben and Ragauskas 2011, Mu, Ben et al. 2013). Furthermore, the annual production of lignin as a byproduct in the US paper industry is over 50 million tons, but only 2% of it is converted into bio-products, while the rest is combusted to recover energy (Ben and Ragauskas 2011). Accordingly, the production of value-added lignin-based products would valorize the material and deal with the waste issue. In addition, it will address the unexpected challenges faced by the Canadian forestry industry over the past few years.
1.4 Conversion of Biomass
Biomass can be converted into bio-products and/or energy using different routes, the most important being biochemical and thermochemical technologies. In the former, biological organisms and/or biological catalysts are used for the transformation. This can be effected through the application of different techniques such as fermentation, transesterification, and methane production in landfills. In the latter, heat and catalysts are employed using three main approaches, pyrolysis, gasification, and combustion, the key difference between them being the oxygen ratio: combustion is a complete oxidation, and gasification is a partial oxidization, whereas pyrolysis is a zero oxidation.
1.4.1 Pyrolysis of Biomass
Pyrolysis is a process of thermal decomposition of the chemical bonds of a target material, performed by heating the material in an inert environment. Thus it offers less pollution compared to the other thermochemical techniques, gasification and combustion. The decomposition temperature varies depending on the material, the type of pyrolysis process used, and a few other minor factors.
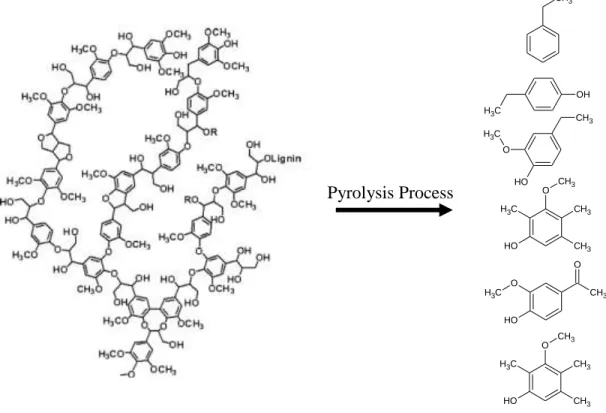
In general, pyrolysis produces three main products: (1) solid fraction, called ―char,‖ consisting mostly of carbon. Char has many potential uses, such as solid fuel, feedstock for gasification, feedstock for activated carbon production, a soil additive, and others (Imam and Capareda 2012). (2) Condensable gas (bio-oil), which is a potential source for value-added chemicals and/or alternative fuel sources that could replace petrochemicals (Motasemi and Afzal 2013). Bio-oil contains hundreds of chemical components as a result of the breakdown a virgin material network. Figure 1-3 shows an example for a lignin network and some of the fragments produced in the liquid phase via pyrolysis. (3) Non-condensable gas, which is combustible, and can be used directly to produce heat. It can also be considered as feedstock to produce chemicals via further processes (de Wild, Huijgen et al. 2012).
The yield and quality of the pyrolysis products depend primarily on the applied conditions. For instance, in slow pyrolysis (T=550-950 K and t=450-550 s) the main product is solid, while in fast pyrolysis (T=850-1250 K and t=0.5-10 s) and flash pyrolysis (T=1050-1300 K and t<0.5 s), the main product is liquid (Motasemi and Afzal 2013). Furthermore, the feedstock characteristics, presence of a catalyst, design of the pyrolyser, and other conditions will affect the product quantity and/or quality as well. For example, the pyrolysis of sawdust pellets produced 58 wt% of condensable gas (Ren, Lei et al. 2012), whereas the pyrolysis of polystyrene plastic waste produced up to 80 wt% liquid (Karaduman 2002). In sum, controlling the pyrolysis conditions could lead to the desired product, both quantitatively and qualitatively.
Figure 1-3: Pyrolysis of a lignin network and produced fragments in the liquid phase
The required heat energy in pyrolysis can be obtained via heat transfer from a heating source using any conventional heating (CH) technique. In this case, pyrolysis is called ―conventional pyrolysis‖ (CP). Alternatively, it can be generated within the material itself using microwave
O C H3 CH3 O H O H O C H3 CH3 CH3 CH3 O H O C H3 CH3 O O H O C H3 CH3 CH3 CH3 OH C H3 CH3 Pyrolysis Process
heating (MWH), which is called ―microwave pyrolysis‖ (MWP). MWP is selected for application in this work, as it can produce more bio-chemicals, particularly liquids, than the other thermochemical techniques, gasification and combustion. Further information regarding MWH as well as MWP will be presented in the next chapters.
1.5 Microwave Heating Fundamentals
Microwave heating is one of the electromagnetic processes, which also include X-ray, infrared, visible light, etc.; each holds a specific frequency range and corresponding wavelength. As depicted in Figure 1-4, the selected frequencies of MWH range between 0.3 and 300 GHz, in order to prevent overlap with other applications (Jones, Lelyveld et al. 2002). In North America, 2.45 GHz is the allowed frequency for laboratory applications (Tang, Xia et al. 2008, Chiavaro, Barnaba et al. 2009, Mutyala, Fairbridge et al. 2010).
Figure 1-4: The electromagnetic spectrum (source: image courtesy of NASA)
Microwave heating is a mechanism of converting electromagnetic waves (EMW) into heat energy within a target material. This conversion occurs inside the whole or a part of the payload as it depends on the penetration limits of the applied EMW. Therefore, MWH is defined as ―a volumetric energy conversion mechanism,‖ which is completely different than the superficial heat transfer of conventional heating. This mechanism depends mainly on the agitation of molecules of the exposed material in the presence of an alternating EMW. The molecules of the
exposed material form electric dipoles, which try to orient themselves to be in phase with the oscillating electric field, as depicted in Figure 1-5-A. This polarization is primarily responsible for generating heat energy inside the target material. On the other hand, as shown in Figure 1-5-B, free-moving ions are affected by the alternating field; however, this transformation is relatively small compared to that of the dipole oscillations.
(A) (B) Figure 1-5: Molecular oscillations in present of an oscillating electromagnetic field
Since the agitation is restricted by the molecular interactions, the system temperature is increased. As known, temperature is a measure of average kinetic energy of particles in a body (Clark, Folz et al. 2000, Oloyede and Groombridge 2000, Durka, Gerven et al. 2009). Certainly, this agitation depends on the specifications of the applied EMW, as well as the characteristics of the exposed material. The most affected parameters are ―dielectric constant‖ (ε/
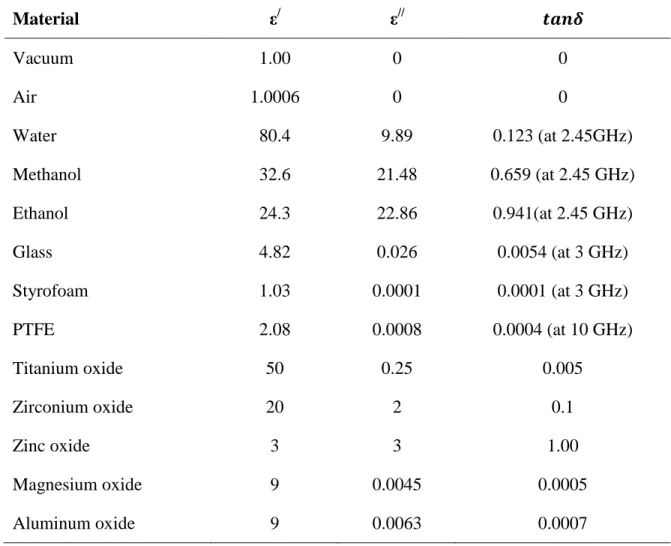
), which represents the amount of electric energy that can be stored within the heated material, and ―loss factor‖ (ε//), which represents the ability of the heated material to dissipate microwave energy. The ratio between these two parameters is called ―loss tangent‖ (tan δ), which is used to convert microwave energy to thermal energy within a material. Table 1.1 shows ε/, ε//, and tan δ of selected materials; further information regarding the parameters governing MWH will be presented in Chapter 3.
Alternating Electric field +
-
+-
+-
+-
+ + +Table 1.1: The dielectric properties of selected materials (Durka, Van Gerven et al. 2009) Material ε/ ε// 𝒕𝒂𝒏𝜹 Vacuum 1.00 0 0 Air 1.0006 0 0 Water 80.4 9.89 0.123 (at 2.45GHz) Methanol 32.6 21.48 0.659 (at 2.45 GHz) Ethanol 24.3 22.86 0.941(at 2.45 GHz) Glass 4.82 0.026 0.0054 (at 3 GHz) Styrofoam 1.03 0.0001 0.0001 (at 3 GHz) PTFE 2.08 0.0008 0.0004 (at 10 GHz) Titanium oxide 50 0.25 0.005 Zirconium oxide 20 2 0.1 Zinc oxide 3 3 1.00 Magnesium oxide 9 0.0045 0.0005 Aluminum oxide 9 0.0063 0.0007
Microwave heating could be employed to avoid many issues and limitations associated with CH, such as temperature gradient inside and outside the heated material, and char layer formation in conventional pyrolysis. In addition, under controlled conditions, MWH can save more in energy consumption as well as enhance product quantity and quality, as reported in numerous publications (Lucchesi, Chemat et al. 2004, Karthikeyan, Balasubramanian et al. 2006, Budarin, Clark et al. 2009, Pan, Wu et al. 2009, Zhang and Zhao 2010, Paixão, Monteiro et al. 2011, Chandra Shekara, Jai Prakash et al. 2012). Variously sized and non-homogeneous feedstock is acceptable since MWH is a volumetric heating mechanism; however, penetration limits must be considered. As well, MWH is easily and rapidly initiated and terminated, which would increase production speed in different sectors. EMW only interacts with particular types of materials; thus, it can effectuate selective heating. This dramatically reduces the amount of heat energy needed to
achieve a particular end, which results in lower running costs and decreases the potential of thermal hazards. Furthermore, MWH allows for a higher level of control and more compact equipment, which can result in higher precision and safety, and magnetrons are available in a wide range of power outputs, which makes the process highly scalable. Last but not least, EMW can be generated and then guided to a target material anywhere, which makes the process highly flexible.
In contrast to the above advantages of MWH, EMW radiation presents an additional hazard in relation to thermal heating. The advantage of EMW only interacting with particular materials can be a problem in some cases, which makes the use of a microwave-receptor essential. The materials used in the construction of reactors are limited according to the ability to interact with EMW. The more sophisticated MWH apparatuses require an increase in the initial cost of the total system, which often leads to the choice of multiple smaller units rather than one large unit.
Recently, MWH has attracted a staggering amount of attention in scientific research, which is realized in the number of publications and patent applications over the last few years (See Figure 1-6). Although MWH has been proven as a powerful heating mechanism, especially in converting of biomass/waste into value-added products; it has not been industrialized yet (Motasemi and Afzal 2013). However, it has been established in a number of other applications, such as drying, extraction, separation, and reactivation (Oloyede and Groombridge 2000, Jones, Lelyveld et al. 2002).
Figure 1-6: Evolution of scientific research in the area of MWP in 2010 as compared to previous years (Luque, Menendez et al. 2012)
1.6 Microwave-Assisted Pyrolysis
Employing MWH in pyrolysis would avert a number of issues/limitations associated with CH, the most important being char layer formation during CP. In CH, heat is transferred from a heating source to the outer surface of the heated material. Thus, surface temperature begins to rise, which results in heat transfer towards the core, primarily by thermal conduction. Once the temperature reaches the pyrolysis temperature, the heated material begins to decompose from the surface to the core. This forms a layer of char that grows in the same direction of the heat transfer, which behaves likewise a thermal insulator. This layer limits heat transfer through the heated material, which results in an outer surface hotter than the core, as shown in Figure 1-7-A. Consequently, volatile products would be affected quantitatively and/or qualitatively as a result of further thermal degradation during the flow out through this layer due to the pressure gradient at the pyrolysis zone. On the other hand, in MWH, EMW penetrate the entire heated material at almost the same time, limited only by penetration limits. Therefore, theoretically, MWH should lead to uniform temperature distribution within the heated material. However, in practice, it is likely to produce non-uniform temperature distribution, as the core is often hotter than the surface (Yang and Gunasekaran 2001, Cuccurullo, Berardi et al. 2002, Pandit and Prasad 2003,
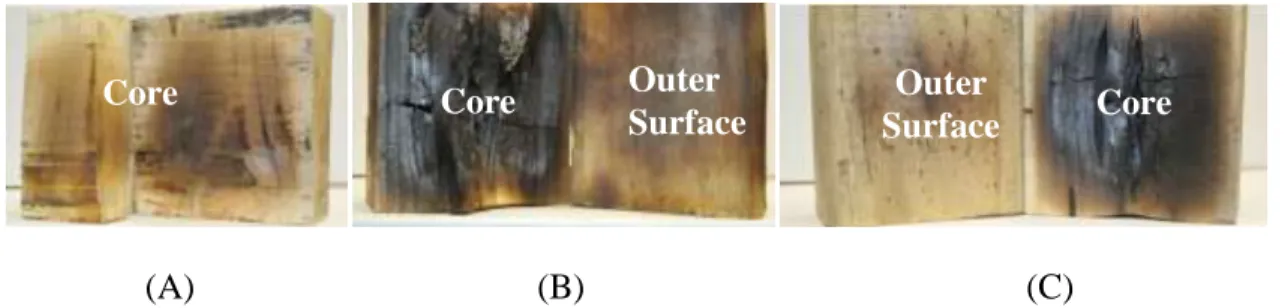
Campañone and Zaritzky 2005, Rattanadecho 2006, Gunasekaran and Yang 2007, Ciacci, Galgano et al. 2010). This is a result of different factors, which will be discussed in Chapter 3. Accordingly, in MWP, the char layer formation grows in the direction opposite to that of CP, starting in the core and moving toward the outer surface, as depicted in Figure 1-7-B. In MWP, volatile products flow out through virgin material, i.e., through zones with a lower temperature, which preserves their chemical structure. Figure 1-8 shows a rubber stopper and a wood block heated in a microwave oven (MWO) then cut into two halves. The difference in colour between the surface and the core can shows the char layer formation experimentally. In conclusion, using electromagnetic irradiation rather than superficial heat transfer in pyrolysis would produce a better product different in terms of quality and quantity compared to traditional pyrolysis.
(A) (B) Figure 1-7: Schematic diagram of pyrolysis in one direction (A) CP and (B) MWP
Heat transfer to surrounding
Virgin material and volatiles flow through
Heat transfer to surrounding
Char T em p er atu re G rad ien
t Virgin material and
volatiles flow through
Pyrolysis Zone Pyrolysis Zone Virgin material T em p er atu re G rad ien t
Char and volatiles flow through Char and volatiles flow through
Pyrolysis Zone
Pyrolysis Zone
Heat transfer from a heating source
(A) (B) Figure 1-8: Materials heated by MWH, (A) rubber stopper and (B) wood cube
1.7 Temperature Gradient in MWH
Although temperature gradient is a key factor in MWH, only a modest effort has been made to investigate this. For example, in brief, Ciacci, Galgano et al. (Ciacci, Galgano et al. 2010) simulated a MWP of a wood block, taking in to consideration heat and mass transfer. Campañone and Zaritzky (Campañone and Zaritzky 2005) predicted temperature profiles within different geometries: a sphere, an infinite cylinder, and a slab. Pandit and Prasad (Pandit and Prasad 2003) simulated temperature profiles within a potato, using finite element analysis. The key conclusion of those studies was that MWH leads to non-uniform temperature distribution and/or hot spots inside the heated material. The same conclusion was arrived at by Zhou, Puri et al. (Zhou, Puri et al. 1995), Rattanadecho (Rattanadecho 2006), Gunasekaran and Yang (Gunasekaran and Yang 2007), and Miura, Kaga et al. (Miura, Kaga et al. 2004). Further information regarding the examination of reviewing this aspect in the scientific literature will be presented in Chapter 3. In spite of the efforts made, the simulation of temperature profiles within materials exposed to EMW still needs further investigation. Approaches that can be employed to control in the reported observations are almost entirely absent. Furthermore, different scenarios required to investigate how to achieve a desired temperature profile. Therefore, a goal of this work is to investigate these missed points, which will be presented in Chapter 3.
1.8 Effect of MWH on Different Reactions
Indeed, in the scientific literature, extensive research has been reported on the effects of MWH on different reactions. This section summarizes the key conclusions of some of the publications
Surface Core
Core Core
related to this work; in addition, a further literature review will be presented in Chapter 4. Zhang and Zhao (Zhang and Zhao 2010) studied the production of 5-hydroxymethylfurfural and furfural from corn stalk, rice straw, and pine wood in an ionic liquid, and reported that MWH increased product yield and decreased reaction time. Budarin, Clark et al. (Budarin, Clark et al. 2009) investigated the preparation of bio-oils using MWP on wheat straw; the oils produced were rich in aromatics compared to those produced using CP. Krzan and Zagar (Krzan and Zagar 2009) studied the liquefaction of wood with glycols using p-toluenesulfonic acid as a catalyst, applying MWH. The authors concluded that MWH decreases the liquefaction time and minimizes the loading of catalyst. Menéndez, Domínguez et al. (Menéndez, Domínguez et al. 2004) investigated MWP of four different types of wet sewage sludge, and MWP was found to achieve the reaction much faster than through by CP; in addition, it produced more non-condensable gas yield. Lucchesi, Chemat et al. (Lucchesi, Chemat et al. 2004) studied solvent-free microwave extraction of oil from basil, garden mint, and thyme. The authors reported that MWH achieved the reaction in less time compared to CH. In addition, a noticeable savings in energy consumption were achieved: 0.25 kWh compare to 4.5 kWh with CH. Similar results were reported by Paixão, Monteiro et al. (Paixão, Monteiro et al. 2011). Orozco, Ahmad et al. (Orozco, Ahmad et al. 2007) found that MWH increased the glucose yield of grass and cellulose in dilution of phosphoric acid and water. Furthermore, it has higher reaction rate at moderate temperatures. Karthikeyan, Balasubramanian et al. (Karthikeyan, Balasubramanian et al. 2006) realized that MWH completed extraction of polycyclic aromatic hydrocarbon from airborne particles within minutes, compared to hours using CH, and the obtained products were different in quality. Sithambaram, Nyutu et al. (Sithambaram, Nyutu et al. 2008) found that MWH enhanced conversion of K-OMS catalyzed oxidation of tetralin compared to CH: (52–88%) and (42–80%), respectively. A similar conclusion was arrived at by Chandra Shekara, Jai Prakash et al. (Chandra Shekara, Jai Prakash et al. 2012) in an investigation of the solventless acylation of p-cresol with different carboxylic acids over BEA zeolite. To conclude, MWH shows noticeable demonstrated effects on reaction rate, reaction temperature, energy consumption, catalyst loading, and other parameters.
Although extensive research has been reported on this aspect, few attempts have been made to find a scientific explanation for the observed effects. Few researchers have done a comparison between MWH and CH based using a kinetic study. Adnadjevic and Jovanovic (Adnadjevic and
Jovanovic 2012), Adnađević, Gigov et al. (Adnađević, Gigov et al. 2008), Fukushima, Kashimura et al. (Fukushima, Kashimura et al. 2013), Sun, Wang et al. (Sun, Wang et al. 2012) Chen, Wang et al. (Chen, Wang et al. 2013), Yan, Hu et al. (Yan, Hu et al. 2012), Adnadjević and Jovanović (Adnadjević and Jovanović 2012), and Li, Han et al. (Li, Han et al. 2013) reported that reaction activation energy (Ea) in the case of MWH is less than that of CH as a result of an effect related to applied EMW. In fact, this is a doubtful statement because the wavelength of applied EMW, 12.24 cm, is much longer than the intermolecular distance of the heated material. On the other hand, Mazo, Estenoz et al. (Mazo, Estenoz et al. 2012) and Yadav and Borkar (Yadav and Borkar 2006) have found that the Ea is the same for both cases, MWH and CH. Regarding the effect on the pre-exponential factor (ko), Adnadjevic and Jovanovic (Adnadjevic and Jovanovic 2012), Adnađević, Gigov et al. (Adnađević, Gigov et al. 2008), and Mazo, Estenoz et al. (Mazo, Estenoz et al. 2012) reported that the ko in MWH is lower than that of CH. Indeed, this statement is not acceptable based on the MWH mechanism, which mainly depends on the agitation of the molecules of the heated material, i.e., ko should be higher in MWH than CH. On the contrary, Adnadjević and Jovanović (Adnadjević and Jovanović 2012), Li, Han et al. (Li, Han et al. 2013), Temur Ergan and Bayramoğlu (Temur Ergan and Bayramoğlu 2011), and Yadav and Borkar (Yadav and Borkar 2006) have found the opposite, that ko in MWH is higher than that in CH. To sum up, even though significant effects have been discovered in different MWH reactions, little effort has been made to interpret these observations. In addition, many of the published conclusions are inconsistent with each other. Thus another aim of this project is to investigate this, which will be presented in Chapter 4.
1.9 Pyrolysis of Lignin and Products Investigation
As mention earlier, pyrolysis, combustion, and gasification are the three techniques of thermochemical technology. Each is employed for a specific purpose: combustion is used to generate heat energy, whereas gasification is used to produce synthesized gas. Pyrolysis is applied to produce bio-products in the form of solid, condensable gas, and non condensable gas. Pyrolysis liquid has received more interesting than solid and gas products in scientific research, as it has the potential to produce value-added bio-chemicals. In addition, it can be used as a fuel resource to replace petrochemical-based fuels. However, the complexity of crude liquid created
by pyrolysis makes further processes for upgrading, such as dehydration and separation, essential. This level of complexity is affected by the pyrolysis condition, the structure of virgin material, and many other conditions. For example, liquids obtained from the pyrolysis of lignin are more complex than those obtained from cellulose and hemicellulose. Accordingly, the characterization of pyrolysis liquids is limited by many factors, in addition to the basic issues regarding the limitations of analyzers. Thus, scientific publications that present detailed structural investigations of bio-oils are quite scarce.
The pyrolysis of lignin, using MWH or CH, has been investigated for the past two decades, but few studies have examined the liquid product qualitatively; the majority investigated it quantitatively. This section presents a brief literature review of this aspect; in addition, further reviews will be presented in Chapter 5 and Chapter 6. Zheng, Chen et al. (Zheng, Chen et al. 2013) investigated the fast pyrolysis of lignin under a catalytic reaction of Mo2N/γ-Al2O3, using a pyrolysis-gas chromatography/mass spectrometry system (Py-GC-MS). Choi and Meier (Choi and Meier 2013) studied the pyrolysis of kraft lignin under effect of different temperatures and catalysts, using GC-MS/GC-FID to analyze the liquid product. Jiang, Nowakowski et al. (Jiang, Nowakowski et al. 2010) examined the temperature dependence of the composition of lignin pyrolysis products employing Pr-GC-MS. Lou, Wu et al. (Lou, Wu et al. 2010) investigated the effect of temperature and catalysts (sodium chloride, Permutite) on the pyrolysis of bamboo lignin, using Py-GC-MS. Zhang, Resende et al. (Zhang, Resende et al. 2012) studied the pyrolysis of three lignin types, prairie cord grass, aspen, and synthetic kraft lignin, using Py-GC-MS and TGA/FTIR. De Wild, Huijgen et al. (de Wild, Huijgen et al. 2012) investigated the pyrolysis of lignin from two different biomass sources using a fluidized bed reactor. In that work, the obtained condensable gas product was analyzed using GC-MS. Luo, Wang et al. 2012 (Luo, Wang et al. 2012) examined the thermal behaviour of organosolv lignin under the catalytic effect of zeolites using TGA-FTIR.
Most of the publications on this subject focus on investigating the liquid products from lignin pyrolysis employed GC-MS, TGA, and/or FT-IR analyses. However, these techniques are limited because of the complexity of the crude liquid, which results in many chemical compounds that
could not be identified. For instance, GC-MS cannot identify around 40 wt% of the cured oil, and using FT-IR for the quantitative analysis of a complex mixture is limited (Ben and Ragauskas 2011). Consequently, a full structural investigation of a bio-oil has not been achieved; in addition, scientific publications that present compositional analyses of bio-oils, particularly from lignin pyrolysis, are few in number. Therefore, the third aim of this project is the compositional analysis and structural investigation of a bio-oil from the MWP of lignin at various conditions, which will be presented in Chapter 5.
1.10 Pyrolysis Modeling
The pyrolysis of lignin has been investigated from different aspects, such as product distribution (Jiang, Nowakowski et al. 2010, Lou and Wu 2011), the presence of catalysis (Mullen and Boateng 2010, Rutkowski 2011), and kinetics (Ferdous, Dalai et al. 2002, Montané, Torné-Fernández et al. 2005, Mani, Murugan et al. 2008, Faravelli, Frassoldati et al. 2010, Jiang, Nowakowski et al. 2010, Janković 2011). Extensive studies have been conducted to model lignin pyrolysis using a single step global reaction. This model considers the virgin material as decomposed into volatiles and solid. However, it cannot distinguish between condensable and non-condensable products. Thus, an investigation of single/multi step parallel reactions is required, which can predict further outcomes.
Virgin material y char + (1-y) volatiles
Virgin Material Virgin Material
In spite of the extensive publications regarding this aspect, the kinetic modeling of individual pyrolysis products, both qualitative and quantitative, is scarce in the scientific literature. It may
Ks2 Non-Condensable Gas Condensable Gas Remaining Solid Ks Kl Kg Kl Kg2 Non-Condensable Gas Condensable Gas Remaining Solid Ks Kg
be a consequence of particular failings of the experimental setup. As a result, most of the current pyrolysis models investigate only volatile products quantitatively, without modeling their chemical composition. As will be discussed in Chapter 5, qualitative investigation is so significant because it can distinguish between products with the same yield. Therefore, the fourth step in this work aims to investigate the kinetics of the pyrolysis products as well as the extracted chemicals from MWP of lignin, which will be presented in Chapter 5. Such investigations will lead to an improved understanding of the underlying processes, and provide needed information for the rational design and scaling-up the pyrolysis reactor.
CHAPTER 2
OBJECTIVES AND METHODOLOGY
The main purpose of this work is to investigate the potential of converting lignin into value-added bio-products. In order to accomplish this, the following steps will be taken:
1. Simulate temperature profiles within selected materials exposed to microwave heating (MWH).
2. Design and manufacture an innovative thermometer that does not suffer from the drawbacks of traditional thermometers.
3. Design and build an original thermogravimetric analyzer that works using MWH and is equipped with a product manifold, for kinetic purposes.
4. Study the reaction kinetics of microwave pyrolysis (MWP), in contrast to conventional pyrolysis (CP) and interpret the obtained results.
5. Study the composition and structure of the condensable gases produced by MWP of kraft lignin using different analysis techniques.
6. Design a kinetic model of the MWP products of kraft lignin, both quantitatively and qualitatively.
Chapters 4 to 7 will present the achievement of these objectives and the scientific findings. Chapter 3 will first present a three-dimensional mathematical model to simulate temperature profiles inside a material exposed to electromagnetic irradiation at 2.45 GHz. In order to do this, COMSOL-Multiphysics applications will be used to simulate the transient temperature profiles of pinewood, carbon, Pyrex, and combinations of such under different conditions. Chapter 4 will present a kinetic investigation of the MWP of sawdust using an original MW-TGA. In this chapter, the full descriptions of the MW-TGA will be presented. Chapter 5 will discuss the detailed compositional analysis and structural investigation of a condensable gas phase obtained from the MWP of kraft lignin. In this chapter, different degradation pathways of a lignin network will be presented after analysing the obtained liquids. Chapter 6 will present a kinetic modeling of MWP products from kraft lignin using a lumped approach. Further investigations for the oil
phase will be presented using different techniques, which will enable modeling of the extracted chemicals as well. Finally, Chapter 7 will present the conclusions of this work and the recommendations for the future investigations.
CHAPTER 3
ARTICLE 1: TEMPERATURE PROFILE PREDICTION
WITHIN SELECTED MATERIALS HEATED BY MICROWAVES AT
2.45GHz
Sherif Faraga, Amr Sobhya, Cevdet Akyelb, Jocelyn Douceta and Jamal Chaoukia
a
CRIP-Biorefinery Centre, Department of Chemical Engineering, École Polytechnique de Montréal. b
Department of Electrical Engineering, École Polytechnique de Montréal. P.O. Box 6079, Station Centre-ville, Montréal, QC, Canada H3C 3A7.
(Published in Applied Thermal Engineering Journal - doi:10.1016/j.applthermaleng.2011.10.049)
Presentation of the article: A three-dimensional mathematical model to simulate transient temperature profiles within selected materials exposed to electromagnetic irradiation will be presented. COMSOL-Multiphysics applications will be employed to simulate the temperature profiles of pinewood, carbon, Pyrex, and combinations of such using different scenarios. The predicted results will be compared against experimental data to validate the model.
Abstract
This work presents a three-dimensional mathematical model to simulate temperature profiles inside a material heated by electromagnetic waves (EMW) at 2.45 GHz. COMSOL-Multiphysics was used to simulate transient temperature profiles of pinewood, carbon, Pyrex, and combinations of such under different conditions. The model predicts that, upon exposing an 86mm wooden cube to 2.45 GHz EMW for 300 s, the core temperature reached 595 K at a setting of 60K/min, while the outer surface 365 K at 15 K/min. By mixing 50% carbon with the wooden block, the model anticipated the cube core to reach 990 K at 140 K/min, compared to 1350 K at 212 K/min with 75% carbon at the same power and after the same time. By inserting a 125 cm3 carbon cube inside the wood cube, the core reaches 3200 K, while the outer surface was 375 K and 636 K for free convection (FC) and perfect insulator (PI), respectively. Placing the same volume of carbon on the surface of the wood cube yielded a maximum temperature of 660 K under FC, compared to 1280 K with PI. Changing the material of the core cube from Carbon to Pyrex yields a temperature of 324 K in the core, with 365 K and 605 K on the outer surface in the case of FC or PI, respectively. The average percentage relative error between the measured and the predicted temperatures was ±4% and ±15% inside the pinewood and carbon respectively.
Keywords: Microwave heating, Temperature profiles, Absorbing power, Temperature prediction,