UNIVERSITÉ DE MONTRÉAL
GENE SILENCING USING CHITOSAN BASED SIRNA DELIVERY SYSTEMS IN CELLS AND ANIMALS
MOHAMAD ALAMEH
INSTITUT DE GÉNIE BIOMÉDICAL ÉCOLE POLYTECHNIQUE DE MONTRÉAL
THÈSE PRÉSENTÉE EN VUE DE L’OBTENTION DU DIPLÔME DE PHILOSOPHIAE DOCTOR
(GÉNIE BIOMÉDICAL) JUIN 2017
UNIVERSITÉ DE MONTRÉAL
ÉCOLE POLYTECHNIQUE DE MONTRÉAL
Cette thèse intitulée :
GENE SILENCING USING CHITOSAN BASED SIRNA DELIVERY SYSTEMS IN CELLS AND ANIMALS
présentée par : ALAMEH Mohamad
en vue de l’obtention du diplôme de : Philosophiae Doctor a été dûment acceptée par le jury d’examen constitué de : Mme HOEMANN Caroline, Ph. D., présidente
M. BUSCHMANN Michael, Ph. D., membre et directeur de recherche M. LAVERTU Marc, Ph. D., membre et codirecteur de recherche M. DAMHA Masad José, Ph. D., membre
DEDICATION
To my mother, My sister
&
ACKNOWLEDGEMENTS
I would like to express my special gratitude towards my supervisor, Dr. Michael Buschmann who has been a tremendous mentor for me. His knowledge and motivation has allowed me to grow as a research scientist. I appreciate his contributions of time and ideas to make my Ph. D. experience productive and stimulating. He has always given me the freedom to pursue projects independently which has instilled confidence in my abilities. By providing me the opportunity to lead the group, he has expressed immense belief in my capabilities, for which I am extremely grateful.
I would also like to thank my co-supervisor, Dr. Marc Lavertu. His guidance and constant feedback have been extremely instrumental in achieving my Ph.D. I acknowledge the stimulating conversations which have provided critical insights into my projects and much needed breakthroughs throughout my research. In addition, I would like to recognize the role of Dr. Caroline Hoemann in letting me develop my teaching capabilities. I am thankful to her, and to Michael Buschmann for providing me the opportunities to teach several courses and mentor students which have led to the development of my communication and presentation skills.
I am indebted to the contribution of Chi-Yuan Chang in my research. He has been extremely supportive and instrumental in executing several of critical and challenging experiments of my research. Yuan was also a good listener, a confident in time of need, and a staunch supporter that stood for me. My deep appreciation goes out to Anik, Genevieve, Ashkan, Ousamah, Etienne and Nicolas for their time and assistance which have been immensely instrumental in the progress of my project.
Fun times with friends provide the much needed respite from the research life. I have deep appreciation for my friends Ghazal, Ashkan (or MY Akhi), Ibtissam, Emily-Jane, Fadi & Racha & Anthony Aris (Like father like son , let’s hope for the BB ya abo el fouf), Sana B, Imad Nasrallah, Abdallah Alameh (or THE khal), Mariam G, Daniel Del Balso, Pierrino Torbey, Bourak Gockcinar & Teoman, Mike Syrmakesian and Mohamad Karnib. I am extremely thankful to them for always being there in times of need and helping me face the challenges during Ph.D. I extend a special thanks to Garima Dwivedi, a true friend and very competent colleague, Colleen, Ashkan and Nic for their invaluable advices and feedback on my research. More often than not, they had faith in my intellect and encouraged me to work harder.
I would also like to express heartfelt gratitude towards Prime Minister Saad Rafik Hariri, Minister Marwan Hamadeh and Christiane Buck for their support, help and advices which has aided me in numerous ways during several phases of my PhD project and beyond.
Undertaking this PhD has been a truly life-changing experience for me and it would not have been possible to do without the support and guidance that I received from my family. Despite her own hardships in life, my mother has always supported my dreams, was and will always be the role model for me. I owe my success to her sacrifices and constant encouragement. She has always lent a patient ear to my venting in frustrating and testing times. I feel extremely fortunate to have a supportive and loving sister Lily-Isabelle, who has always been a sweet and lovely pain since childhood . I am also thankful to my grandmothers for their unconditional love and warmth throughout life which has constantly driven me towards achieving my goals. Finally, I would like to thank my dad, my grandfather, and my father figure Dr Talaat J, who have inspired me with their patience and life philosophies.
RÉSUMÉ
Le développement de vecteurs de livraison non viraux à des fins thérapeutiques a pris de l’ampleur dans les dernières années. Le chitosane est un polymère cationique naturel ayant la capacité de former des nanoparticules lorsqu’il est mélangé à des molécules polyanioniques comme les petits ARN interférents (pARNi). Les efforts pour identifier les paramètres moléculaires favorisant une bioactivité optimale n’ont pas été concluants en raison de différences expérimentales, d’un manque d’uniformité des protocoles de transfection, de la faible caractérisation du polymère et des différences au niveau des sources de chitosane utilisé. Cette thèse a été entreprise afin de répondre aux objectifs suivants: 1) Tester et valider l’efficacité de transfection de formulations, précédemment identifiées comme optimales pour la livraison d’ADN plasmidique, 2) Examiner l’influence des paramètres intrinsèques (dégrée de deacetylation (DDA), la masse moléculaire (Mn) et le ratio N:P) et extrinsèques (sérum, pH, force ionique et conditions de mélange) sur les caractéristiques physicochimiques des particules, leur internalisation dans les cellules, l’efficacité de silençage, la toxicité métabolique, la génotoxicité et l’hémocomptabilité, en utilisant une chimiothèque de chitosanes hautement caractérisés, et 3) Sélectionner des formulations ayant des caractéristiques optimales relatives à la taille, le potentiel zêta, l’intégrité des nanoparticules et la capacité de ces dernières à induire un silençage spécifique du gène en question tout en étant sécuritaire, et 4) Caractériser la biodistribution des nanoparticules, leurs toxicités et leurs potentiel de silençage génique suite à des injections intraveineuses chez la souris.
Une étude initiale a démontré que le chitosane interfère avec l’extraction d’acide nucléique de cellules transfectées in vitro. Une méthode enzymatique simple et peu coûteuse a permis de récupérer l’ARN totale pour des applications moléculaires tel que la PCR en temps réel. De plus, cette étude a permis de réduire le biais (~ 10-15 %) associé aux nanoparticules adsorbées à la surface des cellules lors de mesures du niveau d’internalisation par cytométrie en flux.
En outre, la digestion enzymatique du chitosane pourrait être effectuée en présence de guanidium, un agent chaotropique présent dans le tampon de lyse, démontrant ainsi l’efficacité et la simplicité de cette méthode. Avec la résolution de cet obstacle technique, nous avons sélectionné des formulations ayant démontré, auparavant, une efficacité de transfection élevée pour la livraison d’ADN plasmidique. Ces formulations ont été caractérisés pour leur taille, leur forme, leur potentiel
surfacique (potentiel zêta), leur capacité de protéger les pARNi contre les nucléases et leur efficacité à transfecter, de façon non toxique, différentes lignées cellulaires.
Les nanoparticules ainsi formées étaient sphériques et leur taille variait entre 40 et 100 nm. De plus, les résultats ont démontré que la protection contre les nucléases dépendait de la masse moléculaire et du ratio N:P. Par ailleurs, une haute efficacité (~80%) de silençage génique, en présence de sérum (10%), a pu être atteinte dans plusieurs lignées cellulaires. Pour la première fois, des nanoparticules avaient pu être obtenues à un faible ratio N:P marquant ainsi une différence frappante avec la littérature. Nos résultats ont pu démontrer la cause de ce bais favorisant la sélection de nanoparticules à haut ratio N :P testée dans la littérature.
Dans la perspective de comprendre l’influence du degré de désacétylation (DDA) et de la masse moléculaire (Mn) du chitosane ainsi que du ratio N :P sur l’efficacité de transfection in vitro, la toxicité, la génotoxicité, l’hémocompatibilité et la biodistribution in vivo, une chimiothèque de chitosans hautement caractérisés a été produite à de différents DDA (98%, 92%, 80% et 72%) et Mn (5, 10, 40, 80 et 120 kDa) et mélangée avec des pARNi à des ratios N :P de 5 :1 et 30 :1. Les nanoparticules, ainsi formées, ont été caractérisées pour leurs tailles et potentiel surfacique en présence de 10 et 150 mM de sel. L’efficacité d’encapsulation (EE) et de transfection a été mesurée à pH 6.5 et 8 (EE) et à pH 6.5 et 7.4 respectivement. Les formulations les plus performantes ont été sélectionnées pour une caractérisation plus poussée de l’influence de la Mn et du ratio N:P sur l’internalisation des nanoparticules, l’activité métabolique cellulaire, la génotoxicité et l’efficacité de transfection in vitro en présence de sérum. L’hémocompatibilité et la biodistribution in vivo ont également été examinées pour différents Mn, ratios N :P et doses. Nos résultats ont démontré que l’internalisation des nanoparticules et l’efficacité de silençage étaient positivement corrélées à l’augmentation du potentiel surfacique, obtenu en augmentant le DDA et la Mn. Une longueur minimale de ~60-70 monomères (Mn ~10 kDa) était requise pour garantir une stabilité et un silençage en présence ou absence de sérum. L’efficacité de silençage a atteint des niveaux équivalents (~ 80-90%) à ceux du contrôle positif (DharmaFECT®) sans toxicité métabolique ou génotoxicité démontrant ainsi la supériorité de notre système comparativement aux lipides cationiques qui ont diminué l’activité métabolique des cellules. La présence de concentration croissante de sérum a négativement influencé la transfection in vitro. Nos résultats indiquent que l’influence négative du sérum est inversement proportionnelle à une augmentation du DDA, de la
Mn et du ratio N :P. L’hémocompatibilité s’est révélée être dépendante de la dose, du DDA et de la masse moléculaire suggérant ainsi l’utilisation d’acide hyaluronique (HA), un polymère anionique et biocompatible, pour diminuer l’interaction avec les composantes du sang et améliorer la stabilité colloïdale.
Les études de toxicité in vivo ont démontré que les nanoparticules de chitosane formulées à N:P 5 pourraient être tolérées jusqu’à une dose de 2.5mg/kg siRNA, tandis que celles revêtues de HA améliorent la tolérabilité par un facteur d’au moins 4.
Contrairement aux nanoparticules lipidiques, les nanoparticules avec ou sans revêtement n’ont ni entraîné l’expression de cytokines pro-inflammatoires (ex. IL-1β, IL-6, TNF-α, IFN-γ et KC) ni l’augmentation de biomarqueurs sérologiques tels que l’ALT, AST, ALP, l’urée sanguine, et la créatinine. Une diminution des thrombocytes a été uniquement observée avec les formulations lipidiques soulignant ainsi des différences majeures avec le chitosane.
L’analyse histopathologique des tissus et le suivit des masses corporelles ont confirmés le profil d’innocuité observé avec le chitosane. L’étude de biodistribution chez la souris démontre une accumulation spécifique de nanoparticules dans les tubules épithéliaux proximaux du rein où 40-50% de silençage a été observé, suggérant ainsi des applications potentielles du système au niveau des maladies rénales.
ABSTRACT
Research to develop safe and efficient non-viral gene delivery vectors for clinical applications has gained momentum in recent years. Chitosan is a natural cationic polymer with a characteristic property of self-assembly with small interfering RNA (siRNA) to form nanoparticles with high in vitro and in vivo transfection efficiencies. Previous efforts to identify molecular parameters favoring optimal bioactivity failed to produce conclusive results because of experimental discrepancies, lack of uniformity in transfection protocols, differences in chitosan sources, and poor characterization. In the light of these lacunae, The project presented in this thesis was carried out with the following objectives 1) Test and validate the transfection efficiency of formulations, previously identified as optimal for plasmid DNA, 2) Investigate the effect of intrinsic (DDA, Mn and N:P ratio) and extrinsic parameters (serum, pH, ionic strength and mixing conditions) on nanoparticle physicochemical characteristics, in vitro cell uptake, knockdown efficiency, metabolic toxicity, genotoxicity and hemocompatibility using a library of precisely characterized chitosans, and 3) Identify formulations with optimal characteristics with respect to size, surface charge, integrity, knockdown, toxicity followed by the characterization of their in vivo biodistribution; toxicity and gene knockdown potential following intravenous administration. An initial study demonstrated that chitosan interferes with column based extractions of total RNA from low cell numbers. The digestion of chitosan using a relatively simple and inexpensive enzymatic method permitted total recovery of high-quality RNA. In addition, surface bound chitosan was shown to bias flow cytometry data, evaluating nanoparticle uptake through fluorescently labeled siRNA. Treatment of cells using the chitosanase method reduced false positive events by around 10-15%. Surprisingly, enzymatic digestion could be performed in guanidium, a chaotropic agent, containing lysis buffer demonstrating the convenience of the method and allowing for the extracted RNA to be used in quantitative PCR experiment. With the technical hurdle solved, specific formulations based on designs parameters for plasmid DNA were characterized for their size, shape, surface charge, nuclease protection and ability to transfect different cell lines and produce non-toxic target specific knockdown. In contrast to plasmid DNA, nanoparticles formed with siRNA were all spherical, and their size ranged from 40-100 nm. For the first time, nanoparticles could be obtained at low N:P ratio in striking difference with the literature. Nuclease protection was found to be molecular weight dependent, and gene silencing in
the presence of 10 % serum reached around 80%. This study demonstrated that nanoparticles formulated at low N:P ratio were able to form stable nanoparticles and induce target knockdown. In an attempt to understand the influence of chitosan molecular weight and degree of deacetylation on in vitro transfection efficiency, toxicity, genotoxicity, hemocompatibility and in vivo biodistribution, a library of precisely characterized chitosans was produced at different DDAs (98%, 92%, 80% and 72%) and Mn (5, 10, 40, 80 and 120 kDa). They were then mixed with siRNA at N:P ratios of 5:1 and 30:1, and nanoparticles were characterized for their size and surface charge in the presence of 10 and 150 mM salt. Encapsulation (EE) and transfection efficiencies were characterized at pH 6.5 and 8 for EE and pH 6.5 and 7.4 for in vitro transfection. Formulations were selected for further characterization of the influence of Mn and N:P ratio on nanoparticle uptake, metabolic activity, genotoxicity, and in vitro transfection in the presence of increasing concentrations of serum. Hemocompatibility and in vivo biodistribution were also investigated for several Mn, N:P ratio, and dose. Nanoparticle uptake and gene silencing correlated positively with increased surface charge, which in turn was obtained at high DDA and high Mn. A minimum polymer length of ~60-70 monomers, or Mn of ~10kDa, was required for stability and in vitro knockdown in the presence or absence of serum. In vitro knockdown reached levels equivalent to the DharmaFECT® (~ 80-90%) with no metabolic toxicity or genotoxicity, the former in contrast
to the lipid-based control which severely impaired metabolic activity. Serum had negative dose-dependent effects on biological performance, which correlated inversely with increased DDA, Mn and N:P. The poor in vitro performance above 50% serum concentration is believed to be multifactorial in cause and could not be elucidated. Despite the negative effect of serum on in vitro transfection efficiency, several reports have demonstrated in vivo efficacy. Hemocompatibility was found to be dose-dependent and increased with both Mn and DDA prompting the use of hyaluronic acid (HA), a biocompatible and negatively charged polymer, to coat nanoparticles for limited blood interaction and improved colloidal stability. Single ascending dose toxicity studies showed that uncoated chitosan-formulated at N:P 5 could be tolerated up to 2.5mg/kg siRNA dose, with nanoparticle coating improving tolerability by at least 4-folds. In contrast to commercially available, and liver-restricted lipid nanoparticles (LNPs), both uncoated and HA-coated did not induce pro-inflammatory cytokines such as. IL-1β, IL-6, TNF-α, IFN-γ, and KC, nor had obvious effects on the liver (ALT, AST, ALP) and kidney (BUN, Creatinine) biomarkers. Thrombocytopenia was only observed with the LNPs formulated with a native siRNA sequence
confirming previous reports and highlighting differences with chitosan. Repeated administration and histopathological analysis confirmed the safety profile of chitosan versus LNPs. In vivo biodistribution in mice showed accumulation of nanoparticles in the proximal epithelial tubules of the kidney, where 40-50% functional knockdown was observed and confirmed using multiple techniques, suggesting potential applications in kidney diseases.
TABLE OF CONTENTS
DEDICATION ... III ACKNOWLEDGEMENTS ... IV RÉSUMÉ ... VI ABSTRACT ... IX TABLE OF CONTENTS ...XII LIST OF TABLES ... XXI LIST OF SUPPLEMENTARY TABLES ... XXIII LIST OF FIGURES ... XXIV LIST OF SUPPLEMENTARY FIGURES ... XXXIX LIST OF BOXES ... XLIII LIST OF SYMBOLS AND ABBREVIATIONS...XLIV
INTRODUCTION ... 1
1.1 Introduction ... 1
1.2 Problematic ... 3
1.3 Research Hypotheses and Objectives ... 4
General objective ... 4 Study 1 ... 4 1.3.2.1 Hypothesis 1 ... 4 1.3.2.2 Objective 1 ... 4 Study 2 ... 5 1.3.3.1 Hypothesis 2 ... 5 1.3.3.2 Objective 2 ... 5 Study 3 ... 6
1.3.4.1 Hypothesis 3 ... 6
1.3.4.2 Objective 3 ... 7
1.4 Brief structure of the thesis ... 7
LITERATURE REVIEW ... 8
2.1 RNAi mechanism of action ... 8
2.2 Pharmacokinetic and pharmacodynamic considerations for effective RNAi ... 10
Physiological barriers to siRNA delivery... 10
Structural factors affecting siRNA-induced RNAi ... 12
Potential toxicities ... 12
2.2.3.1 MicroRNA like off-target effects ... 12
2.2.3.2 Immune stimulation properties... 14
2.2.3.3 Sequence-independent off-target effects. ... 15
Improvement of siRNA PK/PD properties through chemical modifications ... 15
2.3 Strategies for siRNA delivery ... 20
Nanoparticles based systems ... 20
2.3.1.1 Lipid nanoparticles (LNPs) ... 20
Polymer-based systems or polymer based nanoparticles ... 26
2.3.2.1 Polyethyleneimine (PEI) ... 26
2.3.2.1 Poly (β-amino ester) (PBAE) systems ... 27
2.3.2.2 Cyclodextrin-based systems ... 28
Conjugation-based systems ... 30
2.3.3.1 Lipid-siRNA conjugates ... 30
2.3.3.2 Dynamic Polyconjugates (DPC) ... 33
Chitosan for gene delivery ... 38
2.3.4.1 Chitosan for the delivery of plasmid DNA ... 40
2.3.4.2 Chitosan for the delivery of small interfering RNAs ... 42
2.4 Mechanisms of cell entry and endosomal escape of siRNA delivery systems ... 44
Mechanism of escape of lipid nanoparticles ... 47
Mechanism of escape of cationic polymers and cytoplasmic release ... 48
Mechanism of escape of molecular conjugates ... 48
ORGANIZATION OF ARTICLES ... 49
ARTICLE 1: CHITOSANASE-BASED METHOD FOR RNA ISOLATION FROM CELLS TRANSFECTED WITH CHITOSAN/SIRNA NANOCOMPLEXES FOR REAL-TIME RT-PCR IN GENE SILENCING ... 52
4.1 Introduction ... 53
4.2 Materials and Methods ... 55
Preparation of chitosan/siRNA polyplexes ... 55
Cell culture ... 55
Transfection with chitosan/siRNA nanoparticle complexes ... 56
Transfection with Dharmafect1TM ... 56
Chitosanase treatment of transfected cells and polyplexes degradation ... 56
FACS analysis ... 57
Confocal imaging ... 57
RNA extraction and assessment methods (yield, purity and integrity) ... 58
TaqMan® Gene Expression Assays – Endogenous controls ... 58
Universal Probe Library (UPL) Assays ... 58
Detection and analysis ... 59
4.3 Results ... 60
Cellular Uptake ... 60
Effect of low molecular weight chitosan on RNA recovery ... 62
Effect of lysis buffer on Chitosanase activity ... 63
Gene silencing ... 65
4.4 Discussion ... 66
4.5 Conclusion ... 68
ARTICLE 2: LOW MOLECULAR WEIGHT CHITOSAN NANOPARTICULATE SYSTEM AT LOW N:P RATIO FOR NONTOXIC POLYNUCLEOTIDE DELIVERY. ... 73
5.1 Introduction ... 75
5.2 Materials and methods ... 78
Synthesis siRNAs and dsODNs as a structural model of siRNA ... 78
Preparation and characterization of depolymerized chitosan ... 78
Preparation of chitosan nanoparticles ... 79
Nanoparticle size and ζ-potential analysis ... 80
High-vacuum scanning electron microscopy (ESEM) ... 80
Nanoparticle stability assessment by polyacrylamide gel electrophoresis ... 80
Nuclease protection assay ... 81
In vitro cell transfection ... 81
5.2.8.1 Cell culture ... 81
5.2.8.2 Cell transfection ... 82
5.2.8.3 Transfection with DharmaFECT ... 82
In vitro cell viability assay ... 82
5.2.10.1 Fluorescence-activated cell sorting (FACS) analysis ... 83
5.2.10.2 Confocal microscopy ... 84
Quantitative PCR (qPCR) analysis of RecQL1 and ApoB mRNA knockdown .... 84
5.2.11.1 RNA extraction and assessment methods (yield, purity, and integrity) ... 84
5.2.11.2 Reverse transcription ... 85
5.2.11.3 Gene expression assays ... 85
5.2.11.4 Detection and analysis ... 85
Statistical analysis ... 86
5.3 Results ... 86
Size and ζ-potential of chitosan nanoparticles ... 86
Chitosan/dsODN nanoparticle stability ... 87
Nanoparticle protection assay ... 89
In vitro cell uptake analysis by flow cytometry and confocal microscopy ... 90
Specific gene silencing and cell cytotoxicity evaluation of chitosan nanoparticles in different cell lines ... 94
5.4 Discussion ... 96
ARTICLE 3: SIRNA DELIVERY WITH CHITOSAN: INFLUENCE OF CHITOSAN MOLECULAR WEIGHT, DEGREE OF DEACETYLATION AND AMINE TO PHOSPHATE RATIO ON IN VITRO SILENCING EFFICIENCY, HEMOCOMPATIBILITY, BIODISTRIBUTION AND IN VIVO EFFICACY ... 109
6.1 Introduction ... 111
6.2 Materials and methods ... 113
siRNA sequences and chitosan characterization ... 113
Preparation of nanoparticles by manual mixing ... 116
Encapsulation efficiency and siRNA release ... 116
6.2.4.1 siRNA release at different pH ... 117
6.2.4.2 siRNA release in the presence of heparin ... 117
6.2.4.3 siRNA release in the presence of serum albumin ... 117
Cell culture ... 118
In vitro transfection ... 118
Assessment of EGFP knockdown and nanoparticle uptake using flow cytometry .. 118
MIQE compliant quantitative real-time PCR (qPCR) ... 119
Assessment of nanoparticle toxicity using the alamarBlue® assay ... 120
Assessment of nanoparticle genotoxicity using the comet or single cell gel electrophoresis assay. ... 121
Assessment of nanoparticle hemocompatibility at doses relevant for in vivo administration ... 121
In vivo biodistribution and efficacy studies ... 122
6.2.12.1 Determination of chitosan-siRNA biodistribution using ex-vivo whole organ imaging ... 123
6.2.12.2 Determination of in vivo functional gene knockdown ... 123
Assessment of in vitro knockdown and nanoparticle biodistribution using confocal microscopy ... 125
Statistical analysis ... 125
6.3 Results ... 127
Chitosan dictate nanoparticle uptake, target knockdown, ζ-potential and encapsulation efficiency at physiological pH while increasing Mn and N:P ratio have positive effects ... 127
In vitro knockdown efficiency is Mn independent above a certain threshold with chitosan found to disturb global gene expression. ... 136
In vitro lipid nanoparticle (LNP) like potency (EC50) can be achieved, in the presence
of serum, using chitosans with increasing Mn and N:P ratio ... 144
Reduction in knockdown efficiency due to serum can be mitigated by increasing Mn and N:P ratio ... 146
Metabolic and genotoxic testing demonstrate the safety of chitosan-siRNA nanoparticles at low/high Mn and N:P ratios ... 148
Chitosan induce Mn- and dose-dependent hemolysis and aggregation of red blood cells ... 151
Chitosan promotes extrahepatic siRNA delivery to proximal epithelial tubular cells of the kidney and induces target specific functional knockdown. ... 155
6.4 Discussion ... 160
6.5 Conclusion ... 166
ARTICLE 4: CHITOSAN SIRNA NANOPARTICLES PRODUCE SIGNIFICANT NON-TOXIC FUNCTIONAL GENE SILENCING IN KIDNEY CORTICES175 7.1 Introduction ... 177
7.2 Material and Methods ... 179
Materials ... 179
siRNA sequences and chitosan characterization ... 180
Preparation of chitosan-based nanoparticles ... 182
7.2.3.1 Preparation of chitosan, hyaluronic acid, and siRNA working solutions ... 182
7.2.3.2 Preparation, lyophilization and reconstitution of uncoated and HA-coated anti-ApoB nanoparticles (NPs) for the assessment of in vivo toxicity ... 182
7.2.3.3 Preparation of uncoated and HA-coated anti-GAPDH nanoparticles for assessment of in vivo target knockdown ... 183
Preparation of Invivofectamine®-siRNA-lipid nanoparticles (LNPs) ... 183
Hemocompatibility ... 184
In vivo studies ... 185
7.2.7.1 Determination of chitosan-siRNA biodistribution using ex-vivo organ imaging ... ... 185
7.2.7.2 Determination of chitosan-siRNA nanoparticle in vivo toxicity ... 186
7.2.7.3 Hematological and serological parameters ... 186
7.2.7.4 Determination of cytokine levels ... 186
Determination of chitosan-siRNA nanoparticle in vivo efficacy ... 187
7.2.8.1 Assessment of GAPDH enzymatic activity using the KDalert® assay ... 187
7.2.8.2 Western blotting ... 188
7.2.8.3 Clinical signs and body weight ... 189
7.2.8.4 Histology and immunohistochemistry ... 189
7.2.8.5 Confocal laser scanning microscopy ... 189
Statistical analysis ... 190
7.3 Results ... 191
Uncoated chitosan NPs induced hemolysis and hemagglutination at high doses which were abrogated by hyaluronic acid (HA) coating ... 191
Uncoated and HA coated chitosan NPs promoted extrahepatic delivery of siRNA to kidney proximal tubular epithelial cells (PTEC) ... 194
Characterization of the injected nanoparticles ... 196
Unlike Lipid nanoparticles, uncoated and HA coated chitosan NPs did not induce immune stimulation and hematologic toxicity upon intravenous administration ... 198
Liver and kidney biomarkers remain unchanged with uncoated and HA coated chitosan NPs while high doses of lipid NPs led to increased transaminase levels ... 203
Despite normal clinical signs post-administration of NPs, a decrease in body weight was observed with cationic lipid nanoparticles, specifically following multiple injections 205
Uncoated and HA coated chitosan NPs did not induce histopathological changes in
main organs following I.V injection at low and high doses ... 210
Uncoated chitosan NPs demonstrated functional gene-specific knockdown in kidney cortex independent of polymer length (Mn) ... 214
7.4 Discussion ... 217
7.5 Conclusion ... 224
GENERAL DISCUSSION ... 234
CONCLUSION AND RECOMMENDATIONS ... 244
LIST OF TABLES
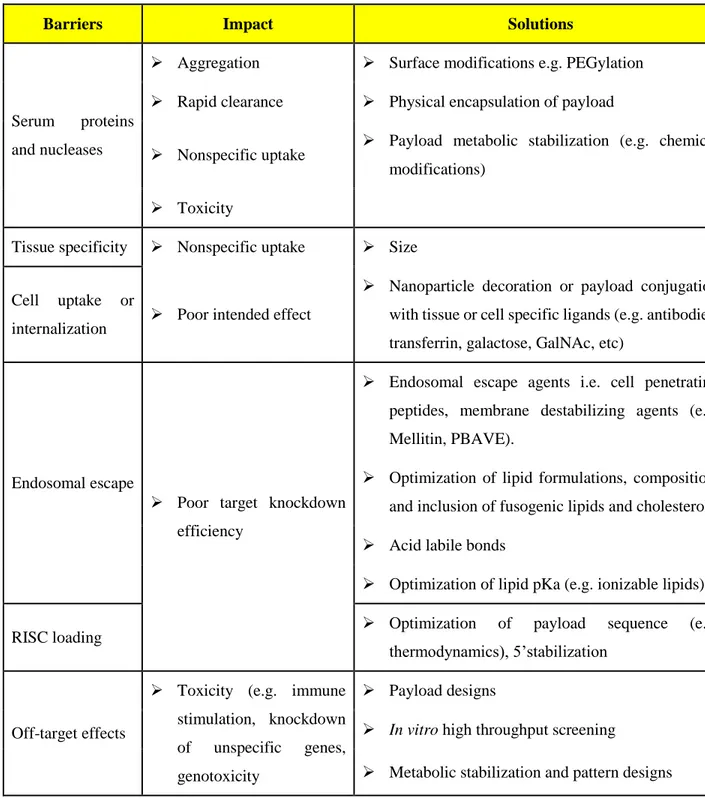
Table 2-1 Biological barriers for siRNA delivery, the impact of each barrier on performance and strategies to overcome the barriers. ... 11 Table 2-2 GalNAc based clinical candidates in development. ... 36 Table 4-1: Effect of chitosanase treatment on RNA extraction, Relative Integrity Number (RIN)
and real-time PCR (qPCR) analysis in three different DPP-IV expressing cell lines. Inhibition percentages of DPP-IV gene expression in siRNA/polyplexes transfected cells were determined in comparison with non-transfected cells: Effect of chitosanase treatment on RNA extraction, Relative Integrity Number (RIN) and real-time PCR (qPCR) analysis in three different DPP-IV expressing cell lines. Inhibition percentages of DPP-IV gene expression in siRNA/polyplexes transfected cells were determined in comparison with non-transfected cells ... 65 Table 5-1: Physicochemical characteristics of bulk chitosans ... 79 Table 5-2: Size and zeta potential values obtained by dynamic light scattering for chitosan/dsODN-RecQL1 and chitosan/dsODN-ApoB nanoparticles ... 87 Table 5-3: Safety and performance criteria for the development of effective nonviral gene delivery
systems ... 98 Table 6-1 Characterization of chitosans tested in this study. Different chitosans are denoted
according to their chemical composition using the nomenclature [DDA-Mn] and are represented in the first column of the table. The degree of deacetylation (DDA) was determined by 1H NMR. The number and weight average molecular weight (Mn and Mw) were determined by gel permeation chromatography (GPC). The polydispersity index (PdI) was calculated as Mw/Mn. The degree of polymerization (Dp) or chain length was computed
using the following equation 𝐷𝑝 = (𝑀𝑛 𝑐ℎ𝑖𝑡𝑜𝑠𝑎𝑛)/(𝑀𝑤 𝑚𝑜𝑛𝑜𝑚𝑒𝑟 𝑎𝑡 𝑠𝑝𝑒𝑐𝑖𝑓𝑖𝑐 𝐷𝐷𝐴) 115 Table 6-2 Effect of Mn and N:P ratio on in vitro dose-dependent knockdown. EC50 values were
derived from a 4-parameter sigmoid curve fitted to data derived from 2 independent experiments with 2 technical replicates per experiment; Figure S. 6-5 in supplemental data for more information, p-value <0.05... 145
Table 6-3 Effect of Mn and dose (concentration) on red blood cell agglutination. Agglutination was measured qualitatively and scored. (-) No aggregation, (+) Low agglutination, few aggregates (++) Medium agglutination, several large aggregates, (+++) Strong agglutination, clumps, (++++) Very strong agglutination, large clumps. ... 154 Table 7-1 Characterization of chitosans tested in this study. Different chitosans are denoted
according to their chemical composition using the nomenclature [DDA-Mn] and are represented in the first column of the table. The degree of deacetylation (DDA) was determined by 1H NMR. The number and weight average molecular weight (Mn and Mw) were determined by gel permeation chromatography (GPC). The polydispersity index (PdI) was calculated as Mw/Mn. The degree of polymerization (Dp) or chain length was computed
using the following equation 𝑫𝒑 =
𝑴𝒏 𝒄𝒉𝒊𝒕𝒐𝒔𝒂𝒏𝑨𝒗𝒆𝒓𝒂𝒈𝒆 𝒎𝒐𝒏𝒐𝒎𝒆𝒓 𝒎𝒐𝒍𝒂𝒓 𝒎𝒂𝒔𝒔 𝒂𝒕 𝒔𝒑𝒆𝒄𝒊𝒇𝒊𝒄 𝑫𝑫𝑨... 181 Table 7-2 Clinical signs collected following a single ascending dose of LNPs, uncoated and HA
coated chitosan-siRNA nanoparticles. General aspect score (GAS), or the general physical aspect of the animal (i.e. hunchback position, piloerection, vocalization …), the natural behaviour score (NBS), or the behavioral aspect of the animal relative to its habitat and littermates (i.e. litter aspect, activity, nesting …) and the provoked behaviour score (PKBS), or the animal response to stimuli (i.e. pen tap on the cage …) were collected by three independent scorers and reported in this table along with the frequency. ... 208
LIST OF SUPPLEMENTARY TABLES
Table S 6-2 Efficiency of the probe pairs used in this study. Reference gene specific primer-probe pairs were tested for their amplification efficiency on complementary DNA (cDNA) prepared from total RNA extracted from non-treated EGFP+ H1299 cells. In order to validate that chitosan treatment does not affect reaction efficiency, primer-probe pairs specific to β2M and RPL13A were also tested on cDNA prepared from total RNA extracted from cells treated (transfected) with 92-10-30. Formulations were designated [DDA(%)-Mn (kDa)-N:P ratio]. High N:P was chosen to ensure maximum potential contamination of total RNA with chitosan. Data show that almost all primer-probe pairs passed, except for ACTB, and that chitosan does not affect amplification efficiency ... 142 Table S 6-3 Descriptive statistics of the data collected for genotoxicity parameters ... 151
LIST OF FIGURES
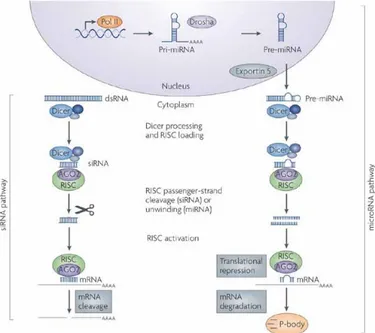
Figure 2-1: Mechanism of RNA interference induced the siRNA (left side) and the miRNA (right side) pathways. Adapted from [8]. Copyright 2017, with Nature Publishing Group permission. ... 9 Figure 2-2: The different categories of off-target effects observed with small interfering RNAs.
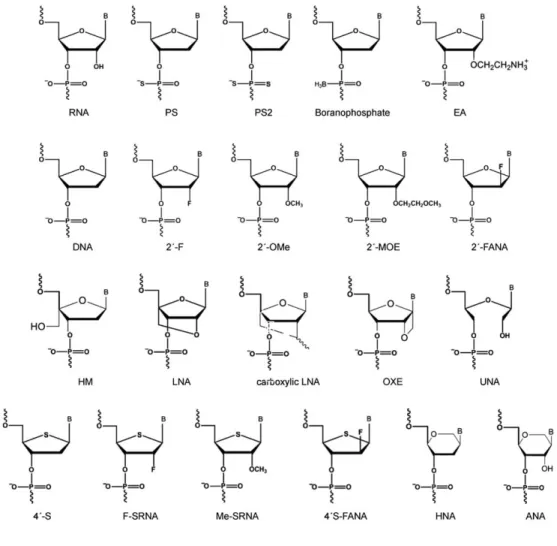
The cartoon depicts the on-target, or the intended effect (left), the off-target, or miRNA-like off-target silencing, occurring after siRNA recognition of imperfectly matched 3’UTRs sequences in the transcriptome (middle) and the immune stimulation off-target effect of siRNA and/or delivery material used i.e. lipid nanoparticle (right). Note: other off-target effects such as RISC saturation are not depicted in this cartoon. Image adapted from [5]. Copyright 2017, with Nature publishing group permission ... 13 Figure 2-3: Different chemical modification used in siRNA design. RNA, ribonucleic acid; PS,
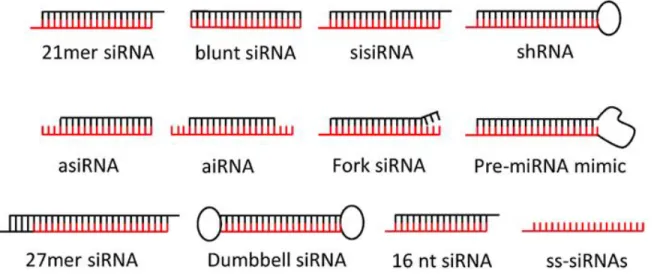
phosphothioate, PS2, phosphodithioate; EA, 2 0 -aminoethyl; DNA, deoxyribonucleic acid; 20 F, 20 fluoro; 20 OMe 20 Omethyl; 2 0 MOE, 20 Omethoxyethyl; FANA, 20 -deoxy-20 -fluoro-β-d-arabinonucleic acid; HM, 40 -C-hydroxymethyl-DNA; LNA, locked nucleic acid; carboxylic LNA 2 0 ,40 -carbocyclic-LNA-locked nucleic acid; OXE, oxetane-LNA; UNA, unlocked nucleic acid; 40 -S, 40 -thioribonucleis acid; F-SRNA, 2 0 -deoxy-20 -fluoro-40 -thioribonucleic acid; ME-SRNA, 2 0 -O-Me-40 -thioribonucleic acid; 40 -S-F-ANA, 20 -fluoro-40 -thioarabinonucleic acid; -S-F-ANA, altritol nucleic acid; HNA, hexitol nucleic acid; B, base. Adapted from [106]. Copyright 2017, with permission from Frontiers. ... 17 Figure 2-4: Different architectures of siRNA used in the literature. The canonical 21-nt siRNA is
the most popular siRNA design and continue to be used in most of the studies. Dicer-substrate siRNAs such as 27-nt siRNA, shRNA, pre-miRNA mimics, or fork siRNA have been associated with enhanced potency. Asymmetrical siRNAs (aiRNA), asymmetric shorter-duplex siRNA (asiRNA), bulge-siRNAs and sisiRNA were shown to improve silencing specificity and when associated with lipophilic conjugates become self-delivering. Blunt-end siRNA are reported to be more nuclease resistant but can be recognized by PRK and RIG-1. Single-stranded siRNAs (ss-siRNAs) and 16 nt are functional but may require higher siRNA concentrations. Dumbbell-shaped circular siRNAs may have longer silencing duration.
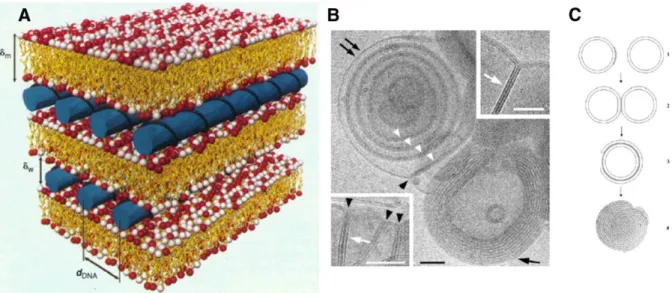
Passenger strands are shown in black and guide strands in red. Adapted from [106]. Copyright 2017, with permission from Frontiers. ... 19 Figure 2-5 Molecular structure and local arrangement of nucleic acid in lipid nanoparticles. A)
Schematic of the local arrangement of the nucleic acid between the lipid bilayers of multilamellar (MLV) lipid nanoparticles. B) Cryo-TEM images of fusion of DOTAP/Cholesterol (1:1) liposomes induced by the addition of oligonucleotides. Black arrows indicate membrane junctions and white arrows indicate a paired membrane. Scale bar: 50 nm. C) Schematic model of MLV liposome or lipoplex formation. Adapted from [136]. Copyright, 2017, Elsevier with permission. ... 22 Figure 2-6: Structure of the major siRNA delivery systems. A) First generation lipid nanoparticle
(LNP) used in pre-clinical and clinical settings [12, 121]. This type of LNPs is composed of a mixture of helper lipids i.e. DSPC (yellow), cholesterol (orange), the ionizable lipid DLinDMA and PEG-C-DMA. b) Cyclodextrin-based polymer nanoparticle (CDP). CDPs are synthesized through polymerization of diaminated cyclodextrin (dark green) yielding an oligomer with diamine groups (blue). The polymer is end-capped with imidazole to improve endosomal escape. Adamantan (AD), a hydrophobic molecule is used to conjugate both PEG and targeting ligands. AD incorporate into the cyclic core of the cyclodextrin. c) First generation dynamic polyconjugate composed of PBAVE, GalNAc, PEG and the siRNA. d) Trivalent GalNAs siRNA conjugate. The metabolically stabilized siRNA is conjugated at the 3ʹ terminus of the passenger strand to three GalNAc molecules through a triantennary spacer molecule. GalNAc mediates hepatocyte entry through receptor-based recognition and subsequent endocytosis. Adapted from [59]. Copyright 2017, Nature Publishing Group with permission. ... 23 Figure 2-7: Chemical structure of chitosan (A and D units represent N-acetyl-D-glucosamine and
D-glucosamine, respectively). Adapted from [28] Copyright 2017, with Elsevier’s permission. ... 39 Figure 2-8: Spontaneous assembly of a chitosan-nucleic acid polyelectrolyte complex, or
nanoparticle through electrostatic interactions. The nucleic acid depicted in this figure is a circular supercoiled plasmid DNA with a negatively charged phosphate backbone (blue) and the polymer is positively charged (red). The ball of wool or scrambled egg like structure has
pKa above the pKa of free polymer (pKa ~6.5). Adapted from [209]. Copyright 2017, with American Chemical Society permission. ... 40 Figure 2-9: Different type of endocytosis. Image adapted from [227]. Copyright 2017, Dove Press
with permission. ... 46 Figure 2-10 Schematic illustration of the uptake pathway and mechanism of endosomal release of
cationic lipid nanoparticles. The schematic considers a receptor-independent mechanism of uptake. The same principle is believed to occur for ionizable lipid nanoparticles following PEG hydrolysis and ionization in the acidic environment of the endosome lumen. Adapted [136], Copyright 2017, Elsevier with permission. ... 47 Figure 4-1. FACS analysis of chitosan/DPP-IVODN polyplexes uptake in HepG2 cell line. Uptake
of 5’-6FAM labeled DPP-IVODN in chitosanase treated and untreated cells 24 hours post transfection. a) Transfection efficiency was calculated as the percentage of 5’FAM-D ... 61 Figure 4-2. Confocal imaging of polyplexes uptake. Confocal microscopy images of HepG2 live
cells 24 h post transfection with chitosan/DPP-IVODN polyplexes (N/P=5). Chitosan 92-10
(DDA, MW) was labeled with Rhodamine (red), the DPP-IVODN with 6FAM at the
5’extremity (green) and the cell membranes were stained prior to imaging with cell mask (blue). Membrane staining was performed to differentiate between internalized and membrane bound polyplexes. ... 61 Figure 4-3: Effect of Streptomyces griseus chitosanase on yield and integrity of total RNA
extraction. Total RNA extraction was performed on HepG2 cells transfected with 10 pmol and 50 pmol of nanoparticles siRNA/chitosan at 3 different N/P ratios indicated by the formulation code 92-10-5, 92-10-10 or 92-10-20 (DDA, MW, N/P). Chitosanase was resuspended in DMEM pH 6.5 and directly applied to cells at a final concentration of 6.12mU/μg of chitosan. Total RNA was extracted from chitosan transfected cell treated with or without chitosanase. The different extractions were compared to control Dharmafect™ 1 transfected cells and non-transfected (NT) cells. (nt) = nucleotide, L= standard ladder, the green band is a lower marker, which allows sample alignment and permits comparison for RIN calculation. RIN= RNA integrity number, is an algorithm based numbering system that calculate RNA integrity with 10 being the most intact and 1 being fully degraded. ... 62
Figure 4-4: Polyacrylamide gel electrophoresis of chitosan/DPP-IVODN polyplexes bearing
different DDAs and N/P ratios, treated with or without Streptomyces griseus chitosanase. a) chitosan migration b) ODN migration. Lane 1 to 4 corresponds to chitosan/DPP-IVODN
directly incubated with chitosanase during 60 minutes at 37ºC. Chitosan digestion allows the ODN release. Lane 5 to 8 corresponds to chitosan/DPP-IVODN incubated at the similar
conditions without chitosanase. Faster chitosan migration was observed when comparing lanes 5 and 6 due to different MW of theses formulations. Increased band intensity (lane 4-8) results from greater amounts of chitosan at higher N/P ratios ... 63 Figure 4-5: Total RNA extraction from HepG2 transfected cells with 10 pmol siRNA. Following
transfection, cells were treated with chitosanase for: a) 30 min, b) 60 and c) 60 min in lysis buffer. ... 64 Figure 5-1: Environmental scanning electron microscopy images of spherical chitosan/dsODN
nanoparticles. (A) 92-10-5 chitosan/dsODN-RecQL1 nanoparticles; (B) 80-40-5 chitosan/dsODN-RecQL1 nanoparticles; (C) 80-10-10 chitosan/dsODN-RecQL1 nanoparticles; (D) 92-10-5 chitosan/dsODN-ApoB nanoparticles; (E) 80-80-5 chitosan/dsODN-ApoB nanoparticles, and (F) 80-10-10 chitosan/dsODN-ApoB nanoparticles. ... 86 Figure 5-2: Chitosan nanoparticle temporal stability. Stability was assessed at 0.5, 4, and 24 hours
after complex formation using polyacrylamide gel electrophoresis at a pH of 6.5 (MES 1X) and pH8 (TAE 1X). Chitosan 92-10 at different N:P ratios (0.5, 2, and 10) was complexed with (A) dsODN-RecQL1 at pH of 6.5; (B) dsODN-RecQL1 at a pH of 8; (C) ds-ODN-ApoB at a pH of 6.5, and (D) ds-ODN-ApoB at a pH of 8. Unstable nanoparticles release dsODNs which become visible following EtBr staining on polyacrylamide gel following eethidium bromide staining of the polyacrylamid gel. ... 88 Figure 5-3: Nuclease protection assays of chitosan/dsODN nanocomplexes. (A) Chitosan (92-10-5, 80-40-5 or 80-10-10) complexed with dsODN-RecQL1. (B) dsODN-RecQL1 remaining after the DNAse I digestion was assessed using the signal intensity of the treated samples with the control (ie, 0 U DNAse I = 100% intensity). This comparison was made between the samples of the same chitosan formulation. (C) Chitosan (92-10-5, 80-80-5 or 80-10-10)
complexed with dsODN-ApoB. (D) dsODN-ApoB remaining after the DNAse I digestion was similarly assessed as in (B). ... 90 Figure 5-4. Polyacrylamide gel electrophoresis of chitosan/DPP-IVODN polyplexes bearing
different DDAs and N/P ratios, treated with or without Streptomyces griseus chitosanase. a) chitosan migration b) ODN migration. Lane 1 to 4 corresponds to chitosan/DPP-IVODN
directly incubated with chitosanase during 60 minutes at 37ºC. Chitosan digestion allows the ODN release. Lane 5 to 8 corresponds to chitosan/DPP-IVODN incubated at the similar
conditions without chitosanase. Faster chitosan migration was observed when comparing lanes 5 and 6 due to different MW of theses formulations. Increased band intensity (lane 4-8) results from greater amounts of chitosan at higher N/P ratios ... 91 Figure 5-5: Cellular uptake of dsODN-ApoB nanoparticles 24 hours post transfection in HEK293,
Raw269.7, and HepG2 cell lines. Chitosan formulations 92-10-5, 80-80-5, and 80-10-10 were complexed to (6FAM) 5′ labeled dsODN-ApoB and transfected at 60 pmol/well 24 hours prior to fluorescence-activated cell sorting analysis. (A) Uptake efficiency of ApoB dsODN in percentage (%). (B) Uptake efficiency of ApoB dsODN in HepG2 cells at different passage number. DharmaFECT was used as the positive uptake control. ... 92 Figure 5-6: Confocal imaging of chitosan/dsODN nanocomplex uptake 24 hours post transfection.
Chitosan 92-10 (DDA, Mn) was labeled with rhodamine (red) and dsODNs were 5′ labeled
with (6FAM) (green). Chitosan 92-10 was complexed to dsODNs at an N:P ratio of 5. Cell membranes were stained prior to imaging with CellMask™ (blue) to differentiate between internalized and membrane-bound nanoparticles. Images shown represent each separate channel, with dsODNs in green, chitosan in red, membrane in blue, differential interference contrast image in grey, and the merged images shown on the bottom left quadrant. (A) LS174T cells transfected with chitosan/ dsODN-RecQL1nanoparticles. (B) HepG2 cells transfected with chitosan/dsODN-ApoB nanoparticles. (C) HEK293 cells transfected with ApoB nanoparticles. (D) Raw 294.7 cells transfected with chitosan/dsODN-ApoB nanoparticles. ... 93 Figure 5-7: Real-time polymerase chain reaction analysis of the inhibition of RecQL1 and ApoB
gene expression in specific cell lines. LS174T cells were transfected with chitosan (92-10-5, 80-40-5, and 80-10-10)/siRNA-RecQL1 nanoparticles, whereas HepG2 cells were transfected
with chitosan (92-10-5)/siRNA-ApoB nanoparticles. The inhibition percentage was obtained by comparing the transfected and nontransfected cells, using the ΔΔCT method. ... 95 Figure 5-8: Cell viability assessment using the alamarBlue® assay 24 hours post transfection with
different chitosan/siRNA formulations. To alleviate the apoptotic effect of RecQL1 gene silencing for a proper assessment of chitosan-siRNA toxicity, mock siRNA was used for transfection in the LS174T cell line. The HepG2 cell line was transfected with ApoB siRNA. DharmaFECT was used for comparison purposes whereas dimethyl sulfoxide was used as a positive control of toxicity. ... 96 Figure 6-1 Nanoparticle size and ζ-potential as a function of DDA, Mn, and amine to phosphate
ratio (N:P) measured in the presence of 10 and 150 mM NaCl. A) Nanoparticle size (Z-ave diameter) vs DDA, Mn and N:P ratio in the presence of low ionic strength (10 mM NaCl, pH 5.5, measurement at 2.5 min post incubation in medium). B) Nanoparticle surface charge (ζ-potential) vs DDA, Mn and N:P ratio in the presence of low ionic strength (10 mM NaCl, pH 5.5). C) Nanoparticle size vs DDA, Mn and N:P ratio in the presence of high ionic strength (150 mM NaCl, pH 5.5). D) Nanoparticle surface charge (ζ-potential) vs DDA, Mn and N:P ratio in the presence of high ionic strength (150 mM NaCl, pH 5.5). Data represent the average ± standard deviation of 3 independent experiments with 2 technical replicates per experiment (N=3, n=6). Measurements in 150 mM NaCl were taken immediately after adding 150 mM NaCl. Measurements in 10 mM NaCl were stable over time (see Supp Info Figure S. 6-1) ... 128 Figure 6-2 Effect of DDA, Mn and N:P ratio on the encapsulation efficiency at two different pH.
Nanoparticles were formed in water and incubated either in 25 mM MES (pH 6.5) or 1X TAE (pH 8.0) for 24 hours then assayed for siRNA release using the Quant-iT™ RiboGreen® assay. The percentage of siRNA release provided the percent encapsulation efficiency (% EE) computed relative to naked siRNA (N:P 0). Red color corresponds to 100% encapsulation efficiency (no release) while magenta corresponds to 0% encapsulation efficiency (all released). Average values from 2 independent experiments with 3-4 technical replicates per experiment. At pH 6.5, complete encapsulation (0% release) of the payload is observed at all DDA, Mn and N:P ratio used to form nanoparticles. However, at pH 8.0, chitosan glucosamine units become deprotonated and their interaction with siRNA phosphate groups decreases
promoting payload release. At pH 8, an increase in DDA, Mn and N:P ratio is required to maintain nanoparticle integrity. ... 130 Figure 6-3 Effect of DDA, Mn, N:P ratio and pH on the biological performance of chitosan-siRNA
nanoparticles. Nanoparticles were formed in water following 1:1 (v/v) mixing of chitosan to siRNA (0.1 mg/mL). EGFP+ H1299 cells were transfected at a final siRNA concentration of 100 nM. Data represent average ± standard deviation of at least 3 independent experiments with at least 2-3 technical replicates in each experiment (N=3, n=6-9). ... 132 Figure 6-4 Cell uptake, knockdown, correlations to size and charge, cell toxicity. A) The effects of
DDA, Mn and N:P ratio on uptake were measured in the EGFP+ H1299 cell line 48 hours post transfection at 100 nM siRNA B) Lack of correlation between EGFP knockdown and nanoparticle size measured at low and high ionic strength. C) Strong correlation between EGFP knockdown and nanoparticle surface charge (ζ-potential) measured at low and high ionic strength. D) Effect of different formulations prepared at N:P 5 on metabolic toxicity. All experiments in these figures were performed at pH 7.2-7.4 in the absence of serum. Media over cells was aspirated and replenished with complete media 44 hours before analysis. All data shown represent average of at least 3 independent experiments with 2-3 technical replicates per experiment (N=3, n=6-9). Correlation graphs represent average values of size or ζ-potential correlated with average values of EGFP knockdown. ... 135 Figure 6-5 Effect of Mn at 92% DDA (92-Mn) and N:P ratio on uptake and knockdown. The EGFP+
H1299 cell line was transfected in the presence of 10% serum at a final siRNA concentration of 100 nM. A) Uptake of DY647 labeled siRNA expressed as median fluorescence intensity (MFI). B) EGFP knockdown post transfection with anti EGFP nanoparticles. C) Lack of EGFP knockdown post transfection with non-targeting siNT nanoparticles; siNT represents a scrambled siRNA and is an indicator of specificity to the target siRNA sequence. D) Lack of EGFP knockdown following transfection with chitosan only. Data represent the average ± standard deviation of 3 independent experiments with 2 technical replicates per experiment (N=3, n=6). ... 137 Figure 6-6 Effect of FBS, chitosan Mn and N:P ratio at 92% deacetylation on EGFP knockdown
in H1299 cells. A) EGFP knockdown measured as the average fluorescence intensity (FI) relative to untreated cells 48 h post transfection with siEGFP. EGFP+ H1299 cells were
transfected in the absence or presence of 10% serum for a period of 5 hours, media aspirated and replenished with complete RPMI-1640 media (pH 7.2-7.4, 290 mOsm) and incubated for 44 hours before analysis. B) EGFP mRNA knockdown measured using qPCR, normalized using the geometric average of EIF, PUM-1, and GAPDH and calibrated to untreated cells. EGFP+ H1299 cells were treated as described in A. C) Representative confocal laser scanning microscopy (CLSM) images. EGFP is indicated in green. In all experiments, siRNA was delivered at a final concentration of 100 nM and data in A and B expressed as the average value of 3 independent experiments with 2-3 technical replicates per experiment (N=3, n=6-9), *p-value < 0.01. ... 139 Figure 6-7 Effect of chitosan and DharmaFect® 2 treatment on reference gene stability. A panel of
10 reference genes was tested for expression stability under diverse experimental conditions. EGFP+ H1299 cells were transfected with the following formulations i.e. 92-10-5, 92-10-30, 92-120-5, 92-120-30, 98-10-5, 98-10-30 and DharmaFect® 2 at a final siRNA concentration of 100 nM. Untreated cells were included in the analysis. A) panel shows the classification of the least to most stable (left to right) reference gene based on the average expression stability values, or geNorm M-Score, computed on the remaining control genes during stepwise exclusion of the least stable control gene, for samples from all treatments. B) panel shows the effect of the exclusion of DharmaFect® 2 from the statistical analysis. C) Panel shows the
effect of the exclusion of both DharmaFect® 2 and untreated cells from the analysis. The
M-Scores were computed using the geNorm statistical package on the average Cq of two independent experiments ... 141 Figure 6-8 Effect of increasing concentration of serum on the biological performance of
nanoparticles. A) Effect of increasing serum concentration on EGFP knockdown. B) Percent loss of EGFP knockdown in the presence of 94% serum compared to transfection without serum. C) Effect of physiological concentration of heparin sulfate (2.5 µg/mL) on payload release. Low (10 kDa) and high (120 kDa) 92% deacetylated chitosan was formulated with siRNA at different N:P ratio and incubated for 1 hour in the absence and presence of heparin sulfate (pH 7.4). Increased fluorescence indicates increased payload release D) Effect of physiological concentration of BSA (25 mg/mL) on payload release. Low (10 kDa) and high (120 kDa) 92% DDA chitosan was formulated with siRNA at different N:P ratio and incubated for 1 hour in the absence and presence of BSA (pH 7.4). ... 147
Figure 6-9 Effect of chitosan Mn and N:P ratio at 92% DDA on in vitro toxicity and genotoxicity. A) Metabolic activity relative to untreated EGFP+ H1299 cells measured by the alamarBlue®
assay. Activity was measured 48 h posttransfection. Mock chitosan (M) was used at N:P 30 to assess the effect of siRNA encapsulation on metabolic activity. DharmaFect® 2 (DF), a commercial lipid-based system, was used as a comparator. Dimethyl sulfoxide (DS) was used as positive control of toxicity. B) Effect of increasing Mn and N:P ratio on genotoxicity as measured using the comet assay parameter "% DNA in tail (PDT)". The PDT represents the percentage of DNA migrated in the tail of the comet or the proportion of damage to total DNA. C) Effect of increasing Mn and N:P ratio on genotoxicity as measured using the parameter "Olive tail moment (OTM)". OTM represents a parameter that is insensitive to the measurement of tail length. D) Correlation between median PDT and N:P ratio for 10 vs 120 kDa chitosan. For the alamarBlue® assay, data represent average metabolic activity ± standard deviation of 3 independent experiments with 2-3 technical replicates per experiment (N=3, n=6-9). For the comet assay, box plots were constructed from data of 2 independent experiments with more than 100 comet/experiment/treatment. ... 149 Figure 6-10 Effect of Mn and dose on hemocompatibility via red blood cell (RBC) lysis. Low (10
kDa) versus high (120 kDa) molecular weight chitosans were formulated with HPLC-grade siRNA at an N:P ratio of 5. Increasing doses of siRNA were mixed with human pooled blood and % hemolysis determined as per ASTM-E2524 [43]. The concentration of chitosan (mg/mL) in the test vial (equivalent to the concentration in total circulating blood volume or tCBV), the equivalent chitosan dose in mg/kg of body weight and the corresponding siRNA dose in mg/kg for N:P of 5 are shown. The inset shows data from positive and negative controls. Poly-L-Lysine (PLL), Triton-X-100 (TX-100), Polyethylene glycol (PEG), buffer (excipients at 1% trehalose, 5.8 mM histidine, pH 6.5), Hyaluronic acid 866 kDa (HA) and siRNA. Data represent the average ± standard deviation of 2 independent experiments with 3-6 technical replicate per experiment (N=2, n= 3-6-12). ... 153 Figure 6-11Effect of Mn on the bio-distribution of chitosan-siRNA nanoparticles. Nanoparticles
were injected in Balb/c nude mice at a dose of 0.5 mg/kg of DY647 labeled siRNA (equivalent dose of 1.4 mg/kg of chitosan) and organs imaged ex-vivo 4 hours post administration. ... 156
Figure 6-12 Histological and CLSM images of nanoparticles accumulated in PTEC. Nanoparticles were injected in Balb/c nude mice at a dose of 0.5 mg/kg of DY647 labeled siRNA (equivalent
dose of 1.4 mg/kg of chitosan), organs perfused and collected 4 hours post administration, fixed and cryosectioned (5 µm). For CLSM, sections were stained with phalloidin red and Hoechst. (PBS) Phosphate Buffered Saline, (siNaked) naked DY647 labeled siRNA, (InV LNP) Invivofectamine® 2.0-DY647 siRNA-lipid nanoparticles, (PTEC) Proximal epithelial tubular cells, (NPs) Nanoparticles. DY647 siRNA = Green, Nucleus = Blue and Brush borders= Red (actin staining). ... 157 Figure 6-13 Effect of DDA and Mn on in vivo knockdown in the kidney. A) Size of the injected
nanoparticles. Nanoparticles were rehydrated in excipients to reach a target dose of 2.5 mg/kg, injected and the remaining volume, diluted 1:8 in excipients and assessed for size using dynamic light scattering. B) Polydispersity index (PdI) of injected nanoparticles. The PdI was automatically computed during DLS in A. C) Changes in body weight following multiple injections. Mice body weight was monitored for a period of 8 days and measured before injection and at euthanasia as an indirect assessment of general toxicity. Arrows and cross represent injection and euthanasia respectively. D) Functional target knockdown in the kidney. Nanoparticles were manually prepared, freeze-dried, rehydrated with excipients and injected in Balb/c mice at a dose of 2.5 mg/kg siRNA. Seventy-two hours after the last administration, kidneys were collected, excised, lysed and the GAPDH enzymatic activity assessed using the KDalert® assay and normalized to total protein content. Cleveland dot plot represents 3 animals per treatment group, with average and standard deviation represented in the form of bars. Statistical significance was computed with One-Way ANOVA followed by Tukey test for multiple comparisons: *p< 0.01, **p <0.001, ***p < 0.00001 ... 158 Figure 7-1 Hemocompatibility profiling of uncoated and HA coated chitosan-siRNA nanoparticles
via red blood cell (RBC) lysis. Low (10 kDa) versus high (120 kDa) molecular weight chitosans were formulated with HPLC-grade siRNA at an N:P ratio of 5. HA coated formulations were formulated at an N:P:C of 2:1:1.5. Increasing doses of siRNA were mixed with human pooled blood and % hemolysis determined as per ASTM-E2524 [49]. The concentration of chitosan (mg/mL) in the test vial (equivalent to the concentration in total circulating blood volume or tCBV), the equivalent chitosan dose in mg/kg of body weight and the corresponding siRNA dose in mg/kg for N:P of 5 are shown. Inset shows data from
positive and negative controls. Poly-L-Lysine (PLL), Triton-X-100 (TX-100), Polyethylene glycol (PEG), Excipients (1% trehalose, 5.8 mM histidine, pH 6.5), Hyaluronic acid 866 kDa (HA), siRNA (8 mg/kg) and Invivofectamine® 2.0 (1 versus 8 mg/kg of siRNA). Data represent the average ± standard deviation of 2 independent experiments with 3-6 technical replicates per experiment (N=2, n= 6-12). ... 192 Figure 7-2 In vivo Biodistribution of uncoated and HA coated chitosan-siRNA nanoparticles. A)
Effect of Mn and HA coating on the biodistribution of chitosan-siRNA nanoparticles. Uncoated nanoparticles were injected in Balb/c nude mice at a dose of 0.25 mg/kg of DY647 labelled siRNA (equivalent dose of 0.7 mg/kg of chitosan), HA coated nanoparticles were injected at a dose of 0.165 mg/kg of DY647 labelled siRNA (equivalent dose of 0.2 mg/kg of chitosan) and organs imaged ex-vivo 4 hours post administration. B) Histological and CLSM images of nanoparticles accumulated in PTEC. Nanoparticles were injected as described above, organs perfused and collected 4 hours post-administration, fixed and cryosectioned (5 µm). For CLSM insets, sections were stained with phalloidin red and DAPI. (PBS) Phosphate Buffered Saline, (siNaked) naked DY647 labeled siRNA, (Invivofectamine) lipid nanoparticles, (PTEC) Proximal epithelial tubular cells, (NPs) Nanoparticles. Lumen (L), DY647 siRNA = Green, Nucleus (N) = Blue and Brush borders= Red (actin staining). ... 195
Figure 7-3 Size, polydispersity index and surface charge (ζ-potential) of chitosan-based siRNA nanoparticles and lipid-based nanoparticles (LNPs). Invivofectamine® 2.0 (Inv LNP) were
formulated with unmodified (siApoB Nat) or 2’O-methyl modified anti-ApoB siRNA (2’Ome siApoB) sequences (panels A, B and C). Invivofectamine® 3.0 and Altogen LNPs were formulated with LNA-modified anti-GAPDH siRNA (panels D, E and F). Low molecular weight chitosan, with a degree of deacetylation of 92% and molecular weight (Mn) of 10 kDa (92-10) was formulated with siApoB Nat or 2’Ome siApoB at an amine to phosphate ratio (N:P ratio) of 5 (panels A, B and C). Low Mn (10 kDa) and high Mn (120 kDa) chitosans were formulated with LNA-modified anti-GAPDH siRNA at an N:P ratio of 5 (panels D, E and F). Hyaluronic acid (HA, 866 kDa) coated chitosan nanoparticles (HA92-10) were prepared at an N:P ratio of 2 and coated with HA at a phosphate to carboxyl ratio (P:C) of 1.5 (panels A, B, C, D, E and F). Size, PdI and ζ-potential of lipid nanoparticles (LNPs) were measured in phosphate buffered saline (PBS, pH 7.4). Size, PdI and ζ-potential of uncoated and HA coated chitosan-siRNA nanoparticles were measured in excipients (1% trehalose
(w/w), 5.8 or 3.5 mM histidine, pH 6.5). A) Size (Z-ave diameter in nm), B) Polydispersity index (pdI), and C) Surface charge (ζ-potential) of nanoparticles injected for the assessment of toxicity. D) Size (Z-ave diameter in nm), E) Polydispersity index (pdI), and F) Surface charge (ζ-potential) of nanoparticles injected for the assessment of in vivo knockdown efficacy. Data represent the average ± standard deviation of 3 independent experiments with 2 technical replicates per experiment (N=3, n=6). ... 197 Figure 7-4 Cytokine induction 4 hours post injection of a single ascending dose of
Invivofectamine® 2.0, uncoated and HA coated chitosan-siRNA nanoparticles in CD-1® (ICR) mice. PBS (Phosphate buffered saline), LPS (Lipopolysaccharide), Inv LNP (Invivofectamine® 2.0-siRNA Lipid Nanoparticles), siApoB Nat (unmodified anti-ApoB siRNA sequence), siApoB 2’Ome (2’O methyl-modified anti-ApoB siRNA sequence), and HA (Hyaluronic acid, 866 kDa). Mice were I.V. injected with test articles, serum collected and analyzed 4 hours post injection using the BioPlex™ 200 system. Each symbol represents an animal and data represent average values ± standard deviation of 5-7 animals. Statistical significance versus PBS-treated animals was computed with One-Way ANOVA followed by Dunnett test for multiple comparisons: *p< 0.01, **p <0.001, ***p < 0.00001. Note: In order to not bias the average, cytokine levels (animals) below the range of detection (< OOR) were excluded and not considered as 0 or LLOQ (pg/mL). ... 199 Figure 7-5 Hematological profiling of Invivofectamine® 2.0, uncoated and HA coated
chitosan-siRNA nanoparticles following single ascending dose administration in CD-1® (ICR) mice.
PBS (Phosphate buffered saline), LPS (Lipopolysaccharide), Inv LNP (Invivofectamine® 2.0-siRNA Lipid Nanoparticles), siApoB Nat (unmodified anti-ApoB 2.0-siRNA sequence), siApoB 2’Ome (2’O methyl-modified anti-ApoB siRNA sequence), and HA (Hyaluronic acid, 866 kDa). Mice were intravenously injected with test articles, blood collected and analyzed 24 hours post injection at IDEXX Laboratories. Each symbol represents an animal and lines represent average values ± standard deviation of 5-7 animals except for InvLNP siApoB Nat (8 mg/kg) where 3 animals were assayed for hematology. The gray shaded area represents the normal values (95% confidence interval, N= 266 divided as 133 ♀ and 133 ♂) of 8-12 week old CD-1® (ICR) mice from Charles Rivers Laboratories (North American colonies) [59]. Statistical significance versus PBS-treated animals was computed with One-Way ANOVA followed by Dunnett test for multiple comparisons: *p< 0.01, **p <0.001, ***p < 0.00001.
Note: Normal range limits in this figure are not firm boundaries and should be used as guidelines since a large range of values was reported in the literature and could be accounted for by variation in age, sex, sampling technique and testing methodology (i.e. instrument, technique …). ... 202 Figure 7-6 Serological profiling of Invivofectamine® 2.0, uncoated and HA coated chitosan-siRNA
nanoparticles following single ascending dose administration in CD-1® (ICR) mice. PBS (Phosphate buffered saline), LPS (Lipopolysaccharide), Inv LNP (Invivofectamine® 2.0-siRNA Lipid Nanoparticles), siApoB Nat (unmodified anti-ApoB 2.0-siRNA sequence), siApoB 2’Ome (2’O methyl-modified anti-ApoB siRNA sequence), and HA (Hyaluronic acid, 866 kDa), BUN (Blood Urea Nitrogen), ALT (alanine transaminase), AST (aspartate transaminase), ALP (Alkaline phosphatase), γGTT (gamma glutamyl transferase). Mice were intravenously injected with test articles, blood collected and analyzed 24 hours post injection at IDEXX Laboratories. Each symbol represents an animal and data represent average values ± standard deviation of 5-7 animals except for InvLNP siApoB Nat (8 mg/kg) where 3 animals were assayed for hematology. The gray shaded area represents the normal values (95% confidence interval, N= 266 divided as 133 ♀ and 133 ♂) of 8-12 week old CD-1® (ICR) mice from Charles Rivers Laboratories (North American colonies) [59]. Statistical significance versus PBS-treated animals was computed with One-Way ANOVA followed by Dunnett test for multiple comparisons: *p< 0.01, **p <0.001, ***p < 0.00001. Note: Normal range limits in this figure are not firm boundaries and should be used as guidelines since a large range of values was reported in the literature and could be accounted for by variation in age, sex, sampling technique and testing methodology (i.e. instrument, technique …). ... 204 Figure 7-7 Changes in body weight following intravenous nanoparticle administration. A) Percent
change in body weight following a single intravenous injection in CD-1® (ICR) mice. Invivofectamine® 2.0 lipid nanoparticles (Inv LNP) were formulated with unmodified (siApoB Nat) and 2’O-methyl modified ApoB siRNA (siApoB 2’Ome) and injected at 1 and 8 mg/kg. Uncoated chitosan was formulated with siApoB Nat and siApoB 2’Ome at an N:P ratio of 5 and injected at 1 and 2.5 mg/kg. Hyaluronic acid (HA, 866 kDa) coated nanoparticles were prepared at an N:P:C of 2:1:1.5 and injected at 1 and 8 mg/kg. The injected doses were chosen from the hemocompatibility data (Figure 7-1) where the maximum dose results in hemolysis below the ASTM threshold. B) Percent change in body weight following three I.V.
injections in Balb/c mice. Invivofectamine® 3.0 (Inv LNP) and Altogen (Altogen LNP) lipid
nanoparticles were formulated with LNA-modified GAPDH siRNA (siGAPDH) and injected at 2.5 mg/kg. Low Mn (10 kDa) and high Mn (120 kDa) chitosan nanoparticles were formulated with siGAPDH at an N:P ratio of 5 and I.V. injected at 1 mg/kg. Hyaluronic acid (HA, 866 kDa) coated nanoparticles were prepared at an N:P:C of 2:1:1.5 and injected at 8 mg/kg. The injected doses were chosen from the hemocompatibility data (Figure 7-1) where the maximum dose results in hemolysis below the ASTM threshold and following personal communication with the manufacturers of Invivofectamine® 3.0 and Altogen. For panel A and B, body weight (g) was collected before each injection and at euthanasia. Red arrows and crosses illustrate injection and euthanasia respectively. Data represent the average ± standard deviation of 5-7 mice/group. Phosphate buffered saline (PBS) and lipopolysaccharide (LPS) were used as controls. ... 207 Figure 7-8 Histopathological comparison of liver and kidney tissue sections following intravenous
administration of high doses of uncoated and HA coated nanoparticles. Uncoated and HA coated nanoparticles were formulated with both unmodified (siApoB Nat) and 2’O-methyl modified ApoB siRNA sequences (2’Ome siApoB) at an N:P:C of 5:1:0 for uncoated and 2:1:1.5 for HA-coated formulations, freeze-dried, rehydrated using excipients and I.V. injected at a dose of 2.5 (uncoated) and 8 (HA coated) mg/kg siRNA. Animals were euthanatized 24 hours post-administration, organ collected, fixed and processed for histopathological analysis. Phosphate buffered saline (PBS) and lipopolysaccharide (LPS) were used as controls. Organs from at least two animals per treatment group were processed and analyzed. Heart, Lungs and Spleen tissues from low (1 mg/kg) and high doses (2.5 and 8 mg/kg) are depicted in Supplemental Figure S. 7-4. Tissues show the absence of morphological changes, alterations, clots, apoptotic/necrotic cells or infiltration of immune cells. ... 210 Figure 7-9 Efficacy of in vivo target knockdown. A) GAPDH activity (U) normalized per tissue
mass (mg). Kidneys were collected, snap frozen in liquid nitrogen, and cortex excised, homogenized, protein extracted and assayed using the GAPDH KDalert™ enzymatic kit. (ns) non-significant and numbers express % knockdown relative to PBS. B) Western blot detection of GAPDH in kidney lysate. GAPDH signal was normalized to the vinculin loading control. The inset shows an actual example of a western blot membrane used for quantification. The
membrane shows three different animals injected with PBS (control) and with 92-10-5 (1 mg/kg siGAPDH). Numbers in the histogram columns represent % knockdown relative to PBS. C) Qualitative assessment of GAPDH knockdown in the kidney by immunohistochemistry. Panels a, b, c, and d show a kidney section collected from a PBS-treated animal, stained with anti-GAPDH antibody (a and b) and isotype control (c and d). Panels e, f, g, and h show a kidney section collected from a chitosan (92-10-5) treated animal, stained with anti-GAPDH antibody (e and f) and isotype control (g and h). Data represent average values ± standard deviation of 5 animals except for 92-120-5 siGAPDH (1 mg/kg) where 4 animals were assayed. Statistical significance versus PBS-treated animals was computed with One-Way ANOVA followed by Dunnett test for multiple comparisons: *p< 0.01, **p <0.001, ***p < 0.00001. ... 216

![Figure 2-6: Structure of the major siRNA delivery systems. A) First generation lipid nanoparticle (LNP) used in pre-clinical and clinical settings [12, 121]](https://thumb-eu.123doks.com/thumbv2/123doknet/2322715.29452/71.918.158.769.110.883/figure-structure-delivery-generation-nanoparticle-clinical-clinical-settings.webp)
![Figure 2-9: Different type of endocytosis. Image adapted from [227]. Copyright 2017, Dove Press](https://thumb-eu.123doks.com/thumbv2/123doknet/2322715.29452/94.918.444.810.144.457/figure-different-endocytosis-image-adapted-copyright-dove-press.webp)


