UNDERSTANDING THE IMPACT OF CLOUD COMPUTING PATTERNS ON PERFORMANCE AND ENERGY CONSUMPTION
SEYED AMIRHOSSEIN ABTAHIZADEH
DÉPARTEMENT DE GÉNIE INFORMATIQUE ET GÉNIE LOGICIEL ÉCOLE POLYTECHNIQUE DE MONTRÉAL
MÉMOIRE PRÉSENTÉ EN VUE DE L’OBTENTION DU DIPLÔME DE MAÎTRISE ÈS SCIENCES APPLIQUÉES
(GÉNIE INFORMATIQUE) AOÛT 2016
c
ÉCOLE POLYTECHNIQUE DE MONTRÉAL
Ce mémoire intitulé:
UNDERSTANDING THE IMPACT OF CLOUD COMPUTING PATTERNS ON PERFORMANCE AND ENERGY CONSUMPTION
présenté par: ABTAHIZADEH Seyed Amirhossein
en vue de l’obtention du diplôme de: Maîtrise ès sciences appliquées a été dûment accepté par le jury d’examen constitué de:
M. GAGNON Michel, Ph. D., président
M. KHOMH Foutse, Ph. D., membre et directeur de recherche M. DAGENAIS Michel, Ph. D., membre
ACKNOWLEDGMENT
First and foremost, I would like to thank my thesis advisor Prof. Foutse Khomh of the Computer Engineering department. The door to his office was always open whenever I ran into a trouble spot or had a question about my research or writing. He consistently allowed this thesis to be my own work, but steered me in the right direction whenever he thought I needed it. I am grateful that I’ve studied under his supervision and I was able to explore and obtain a variety of knowledge in Cloud Computing and related topics.
I would like to thank members of the jury, who have reviewed my thesis.
Finally, I would like to thank Amazon Inc. for supporting me through their AWS in Education Grants.
RÉSUMÉ
Les patrons infonuagiques sont des solutions abstraites à des problèmes récurrents de concep-tion dans le domaine de l’infonuagique. Bien que des travaux antérieurs aient prouvé que ces patrons peuvent améliorer la qualité de service des applications infonuagiques, leur impact sur la consommation d’énergie reste encore inconnu. Pourtant l’efficacité énergétique est un défi majeur pour les systèmes infonuagiques. Actuellement, 10% de l’électricité mondiale est consommée par les serveurs, les ordinateurs portables, les tablettes et les téléphones intelli-gents. La consommation d’énergie d’un système dépend non seulement de son infrastructure matérielle, mais aussi de ses différentes couches logicielles. Le matériel, le firmware, le sys-tème d’exploitation, et les différentes composantes logicielles d’une application infonuagique, contribuent tous à déterminer son empreinte énergétique. De ce fait, pour une meilleure effi-cacité énergétique, il est important d’améliorer l’effieffi-cacité énergétique de toutes les couches matérielles et logicielles du système infonuagique, ce qui inclut les applications déployées dans le système infonuagique.
Dans ce mémoire, nous examinons l’impact de six patrons infonuagiques (Local Database proxy, Local Sharding Based Router, Priority Queue, Competing Consumers, Gatekeeper and Pipes and Filters) sur la consommation d’énergie de deux applications multi-traitement et multi-processus déployées dans un système infonuagique. La consommation d’énergie est mesurée avec l’outil Power-API, une interface de programmation d’application (API) écrite en Java et permettant de mesurer la consommation d’énergie au niveau du processus. Les résultats de nos analyses montrent que les patrons étudiés peuvent réduire efficacement la consommation d’énergie d’une application infonuagique, mais pas dans tous les contextes. D’une manière générale, nous prouvons qu’il y a un compromis à faire entre performance et efficacité énergétique, lors du développement d’une application infonuagique. De plus, nos résultats montrent que la migration d’une application vers une architecture de micro-services peut améliorer les performances de l’application, tout en réduisant considérablement sa con-sommation d’énergie. Nous résumons nos contributions sous forme de recommandations que les développeurs et les architectes logiciels peuvent suivre lors de la conception et la mise en œuvre de leurs applications.
ABSTRACT
Cloud Patterns are abstract solutions to recurrent design problems in the cloud. Previous works have shown that these patterns can improve the Quality of Service (QoS) of cloud applications, but their impact on energy consumption is still unknown. Yet, energy con-sumption is the biggest challenge that cloud computing systems (the backbone of high-tech economy) face today. In fact, 10% of the world’s electricity is now being consumed by servers, laptops, tablets and smart phones. Energy consumption has complex dependencies on the hardware platform, and the multiple software layers. The hardware, its firmware, the operat-ing system, and the various software components used by a cloud application, all contribute to determining the energy footprint. Hence, increasing a data center efficiency will even-tually improve energy efficiency. Similarly, software itself can affect the internal design of cloud-based applications to optimize hardware utilization to lower energy consumption. In this work, we conduct an empirical study on two multi-processing and multi-threaded cloud-based applications deployed in the cloud, to investigate the individual and the com-bined impact of six cloud patterns (Local Database proxy, Local Sharding Based Router, Priority Queue, Competing Consumers, Gatekeeper and Pipes and Filters) on the energy consumption. We measure the energy consumption using Power-API, an application pro-gramming interface (API) written in Java to monitor the energy consumed at the process-level. Results show that cloud patterns can effectively reduce the energy consumption of a cloud application, but not in all cases.
In general, there appear to be a trade-off between an improved response time of the applica-tion and the energy consumpapplica-tion. Moreover, our findings show that migrating an applicaapplica-tion to a microservices architecture can improve the performance of the application, while sig-nificantly reducing its energy consumption. We summarize our contributions in the form of guidelines that developers and software architects can follow during the design and imple-mentation of their applications.
TABLE OF CONTENTS
ACKNOWLEDGMENT . . . iii
RÉSUMÉ . . . iv
ABSTRACT . . . v
TABLE OF CONTENTS . . . vi
LIST OF TABLES . . . viii
LIST OF FIGURES . . . ix
LIST OF ABREVIATIONS . . . x
LIST OF APPENDICES . . . xi
CHAPTER 1 INTRODUCTION . . . 1
1.1 Concepts and Definitions . . . 2
1.2 Research Objectives . . . 5
1.3 Thesis Plan . . . 5
CHAPTER 2 LITERATURE REVIEW . . . 6
2.1 Object-Oriented Design Patterns and Software Quality . . . 6
2.2 Evaluation of Cloud Patterns . . . 7
2.3 Green Software Engineering . . . 8
2.4 Software-defined Power Meters . . . 8
2.4.1 Power-API . . . 9
2.4.2 TPC-Energy . . . 10
2.4.3 Joulemeter . . . 10
2.4.4 jRAPL . . . 10
2.4.5 Power Gadget . . . 11
CHAPTER 3 CLOUD PATTERNS . . . 12
3.1 Cloud Patterns . . . 14
3.1.1 Local Database Proxy . . . 14
3.1.3 Priority Message Queue . . . 15
3.1.4 Competing Consumers . . . 16
3.1.5 The Gatekeeper . . . 17
3.1.6 Pipes and Filters . . . 18
CHAPTER 4 METHODOLOGY AND DESIGN . . . 19
4.1 Context and Problem . . . 19
4.2 Study Definition and Design . . . 19
4.2.1 Research Questions . . . 19
4.2.2 Experimental Setup . . . 20
4.2.3 Implementation of the Patterns . . . 25
4.2.4 Hypotheses . . . 29
4.2.5 Analysis Method . . . 30
4.2.6 Independent Variables . . . 31
4.2.7 Dependent Variables . . . 31
CHAPTER 5 THE IMPACT OF CLOUD PATTERNS ON PERFORMANCE AND ENERGY CONSUMPTION . . . 32
5.1 Results of Experiment 1 . . . 32
5.2 Results of Experiment 2 . . . 37
5.3 Threats to Validity . . . 46
CHAPTER 6 CONCLUSION . . . 47
6.1 Summary of the Results . . . 47
6.2 Future Work . . . 49
REFERENCES . . . 50
LIST OF TABLES
Table 3.1 Common Problems in Cloud Area and Suggested Patterns . . . 13
Table 4.1 List of Microservices and their Tasks . . . 23
Table 4.2 Patterns chosen for the experiments . . . 25
Table 4.3 SQL injection rules applied in the Gatekeeper pattern . . . 28
Table 5.1 p-value of Mann–Whitney U test and Cliff’s δ effect size for the first application . . . 32
Table 5.2 p-value of Mann–Whitney U test and Cliff’s δ effect size for the second application, individual patterns . . . 37
Table 5.3 p-value of Mann–Whitney U test and Cliff’s δ effect size for the second application implementing a combination of patterns . . . 41
LIST OF FIGURES
Figure 2.1 Power-API distortion test . . . 9
Figure 3.1 Basic orientation for developing cloud applications (Homer et al., 2014) 12 Figure 3.2 Local Sharding-Based Router Pattern . . . 15
Figure 3.3 Priority Message Queue Pattern . . . 16
Figure 3.4 Competing Consumer Pattern . . . 16
Figure 3.5 Gatekeeper Pattern . . . 17
Figure 3.6 Pipes and Filters Pattern . . . 18
Figure 4.1 Architectural Design of the First Experiment . . . 20
Figure 4.2 First Experiment Test Scenario . . . 21
Figure 4.3 Architectural Design of the Second Experiment . . . 23
Figure 4.4 Second Experiment Test Scenario . . . 24
Figure 5.1 The Impact of Proxy Pattern . . . 33
Figure 5.2 The Impact of Sharding Pattern . . . 34
Figure 5.3 The Impact of Proxy Pattern Combined with Message Queue Pattern 35 Figure 5.4 The Impact of Sharding Pattern Combined with Message Queue Pattern 35 Figure 5.5 The Impact of Sharding Pattern Combined with Proxy Pattern . . . 36
Figure 5.6 The Impact of Proxy Pattern . . . 38
Figure 5.7 The Impact of Sharding Pattern . . . 39
Figure 5.8 The Impact of Gatekeeper Pattern . . . 39
Figure 5.9 The Impact of Competing Consumers Pattern . . . 40
Figure 5.10 The Impact of Pipes & Filters Pattern . . . 40
Figure 5.11 The Impact of Proxy Pattern Combined with Message Queue Pattern 42 Figure 5.12 The Impact of Sharding Pattern Combined with Message Queue Pattern 43 Figure 5.13 The Impact of Sharding Pattern Combined with Pipes & Filters Pattern 43 Figure 5.14 The Impact of Sharding Pattern Combined with Competing Con-sumers and Pipes & Filters Patterns . . . 44
Figure 5.15 The Impact of Sharding Pattern Combined with Competing Con-sumers, Gatekeeper and Pipes & Filters Patterns . . . 45
LIST OF ABREVIATIONS
IT Information Technology QoS Quality of Service SLA Service Level Agreement
API Application Programming Interface EC2 Amazon Elastic Computing
AWS Amazon Web Services IaaS Infrastructure as a Service SaaS Software as a Service PaaS Platform as a Service
MS-Azure Microsoft Azure: Cloud Computing Platform and Services VMM Virtual Machine Monitor
SSL Secure Sockets Layer TLS Transport Layer Security
HTTPS Hypertext Transfer Protocol over TLS ACID Atomicity, Consistency, Isolation, Durability BASE Basic Availability, Soft-state, Eventual consistency HPC High Performance Computing
SEE Software Engineering Environment SOA Service Oriented Architecture CLI Command-Line Interface
MQ Priority Message Queue pattern SHRD Sharding pattern
PRX Proxy pattern
CCP Competing Consumers pattern P&F Pipes and Filters pattern GK Gatekeeper pattern
LIST OF APPENDICES
CHAPTER 1 INTRODUCTION
Cloud computing systems are now pervasive in our society. As a consequence, the energy consumption of data centers and cloud-based applications has become an emerging topic in the software engineering research communities. Energy consumption has complex dependen-cies on the hardware platform, and the multiple software layers. The hardware, its firmware, the operating system, and the various software components used by a cloud application, all contribute to determining the energy footprint; making energy optimization a very chal-lenging problem. The role of software components and coding practices has been recently investigated, and researchers have proposed energy-aware algorithms (Prosperi et al., 2012)
and sensor relocation techniques (El Korbi and Zeadally, 2014) to help optimizing software energy consumption. When developing an energy efficient cloud-based application, develop-ers must seek a compromise between the application’s Quality of Service (QoS) and energy efficiency. Manually finding such a compromise is a daunting task, and developers should be supported by guidelines and–or tailored recommendations in the form of best practices. Cloud patterns, which are general and reusable solutions to recurring design problems, have been proposed as best practices to guide developers during the development of cloud-based applications. However, although previous work (Hecht et al., 2014) has shown that these cloud patterns can improve the QoS of cloud based applications, their impact on energy consumption is still unknown. In this study, we evaluate the impact on energy consumption of six cloud patterns: Local Database Proxy, Local Sharding-Based Router, Priority Queue, Competing Consumers, and Pipes and Filters. The study is performed using two different applications exhibiting the behavior of a real cloud-based application.
The first experiment uses a RESTful multi-threaded application written in Java, and the sec-ond experiment consists of an application implemented with the Python Flask microframe-work, using both multi-processing and multi-threaded scenarios, deployed in the Amazon EC2 cloud. These two systems are also implemented with different combinations of the afore-mentioned patterns. The second application is also decomposed into seven microservices in order to enable investigating the impact of microservices design architecture in a cloud-based scheme. Energy consumption is measured using Power-API, an application programming interface (API) written in Java that can monitor the energy consumed by an application, at the process-level (Noureddine et al., 2012).
1.1 Concepts and Definitions
In this section, brief summaries of essential concepts related to the research topic are pre-sented (Furht and Escalante, 2010):
Cloud Computing: ISO/IEC 17788:2014 (Author, 2014) defines cloud computing as a “paradigm for enabling network access to a scalable and elastic pool of shareable physical or virtual resources with self-service provisioning and administration on-demand”. In fact, we can say that cloud computing is a computing model, not a technology. In cloud computing, Information Technology (IT) experts and end users can access cloud resources such as servers, networks and applications via the Internet, following a Pay-As-You-Go model in which users pay only for the amount of computing services that they consumed.
Cloud Patterns: Cloud design patterns are determined solutions to frequent design prob-lems in cloud applications. These patterns are repeatable, and they describe the context in which they should be applied, the problem that they solve and the solution to this problem. Vertical Scaling: Consists in increasing the capacity of existing commodity hardware or software by adding more resources such as memory or CPU when needed. In other words, enhancing an individual computing resource capabilities by providing more hardware equip-ments, and resizing the server with no change to the code.
Horizontal Scaling: Consists in connecting innumerable hardware or software units so that they function as a single logical monad. Clustering machines is a way of scaling out the original server by adding more compute or storage resources. The most important advantage of horizontal scaling is the ability to increase the capacity of a system on the fly, which is often referred to as elastic computing in the cloud domain.
Public Cloud: Public cloud refers to cloud computing providers that make applications, storage and resources available to the public over the Internet. This type of cloud computing is often criticized in terms of data exposure and security concerns. In this work, instances from Amazon Inc. Cloud Computing infrastructure were used. In particular, we setup the second experiment on Amazon Elastic Computing (EC2) services virtual machine instances.
Private Cloud: When a cloud provider infrastructure is distinctively used by one customer or organization and it is not shared with others. Security challenges along with the data exposure might be less likely to happen in comparison with public cloud as there is a higher level of isolation and control over data. In general, this solution is suitable for protecting sensitive and valuable data. Utilizing a private cloud (locally or hosted by a third-party) enhances an organization with a dedicated pool of IT resources that can be adjusted to requirements easily and quickly in a much secure way than the public cloud.
Hybrid Cloud: The Hybrid solution is to allow the work loads to move between private and public cloud, hence providing more resiliency to the business. Hybrid approach utilizes both advantages of public and private cloud. Sensitive data can be stored in a private cloud while less-critical computations and functions could be hosted on a public cloud. Hybrid cloud is a solution for cloud applications with dynamic or highly changeable work loads.
IaaS: Infrastructure as a Service makes available to the general public (users and IT organi-zations) the functions of an entire data center, by providing grids or clusters and virtualized servers, networks, and storage to name a few. The best known example is Amazon Elastic Compute Cloud (EC2) which allows users to access a variety of instances to deploy their cloud applications.
PaaS: Platform as a Service provides virtualized servers in which users can run existing applications or develop new ones on them. The key benefit is that users do not have to maintain the operating systems or hardware along with load balancing or even computing capacity and they can focus only on the development and deployment of their applications. Moreover, PaaS also provide Application Programming Interfaces (API) that developers can use during the development of their applications. Microsoft Azure is the best known example of such service in cloud.
SaaS: Software as a Service brings about all the functions of a conventional application, but through a Web browser, not a locally-installed application. SaaS tends to eliminate tasks concerning servers, storage, application development and common concerns of IT by allowing users to run applications remotely from the cloud. GMail by Google is an example of SaaS. Elastic Computing: Elastic Computing can be defined as the ability of a cloud provider to provision flexible computing power (in terms of CPU, memory, storage, etc.) when required. Elasticity allows applications to adapt to workloads in real time. In fact, a platform main-tains elasticity by scaling up and down computing resources in accordance with the demand requested by cloud application users. Unlike scalable platforms which is designed to meet some expected demands, elasticity allows to meet both expected and unexpected demands by increasing or decreasing the capacity to adjust the workloads to application requirements.
Amazon Web Services (AWS): It is a comprehensive cloud computing platform and infrastructure provided by Amazon Inc1. Instances from Elastic Computing services (Amazon EC2) were chosen to conduct our second experiment.
NoSQL: NoSQL or non-SQL databases are open source and horizontally scalable databases which are non-relational and distributed, supporting large numbers of concurrent users. NoSQL databases set a goal of delivering highly responsive experiences to globally dis-tributed users. Types of such databases include: column, document, key-value, graph and multi-model. NoSQL databases focus on availability and eventual consistency by using Basic Availability, Soft-state Eventual consistency (BASE) transactions. BASE emphasizes the fact that it is enough for the database to eventually be in a consistent state, hence the NoSQL databases are more suitable for distributed data. In the context of cloud, NoSQL databases are widely used because of the distributed nature of cloud-based applications and the high demand for availability.
Hypervisor: A hypervisor or virtual machine monitor (VMM) is a computer software, firmware or hardware that enables creating and running virtual machines.
Virtualization: Virtualization means creating virtual devices or resources, such as computer server, network, storage device, or an operating system. Virtualization has a significant un-derlying role in cloud computing. The main benefit of Virtualization is the subdivision of commodity hardware resource into multiple execution environments. Cloud providers offer services based on virtualized resources. There exists different kind of virtualization: Full Virtualization which is the complete simulation of the hardware, Partial Virtualization in which a few but not all of the hardware is simulated, Paravirtualizaiton which provides iso-lated domains for the guest programs to be executed whereas the hardware is not simuiso-lated, and finally, Hardware-assisted virtualization which is a platform virtualization approach that enables full virtualization using help from hardware capabilities.
VMware ESXi: VMware ESXi, which is the latest hypervisor architecture from VMWare has been used in our study. We chose this architecture because it contains a new bar for secu-rity and authenticity which reduces the “attack surface" with less code to patch2. Moreover, it is used by leading server manufacturers such as Dell, IBM, HP, and Fujitsu-Siemens.
1
https://aws.amazon.com/ 2http://www.vmware.com
1.2 Research Objectives
This research aims to explore the effects of cloud patterns on the energy consumption and performance of cloud-based applications. In particular, we analyze the potential impact of cloud patterns on both energy utilization and performance, and we propose a series of archi-tectural design guidelines to cloud developers that helps optimizing energy and performance efficiency.
1.3 Thesis Plan
Chapter 2 presents a literature review of the evaluation of cloud patterns, and discusses common software-defined power meters. Chapter 3 contains information about patterns that have been used in this research along with their use cases and benefits for cloud-base appli-cations. Chapter 4 introduces the methodology of our experiments that aimed to understand the effect of cloud patterns on performance and energy consumption. It also summarizes the design of the two Software as a Service (SaaS) frameworks used to implement the applications of our experiments. In Chapter 5, we discuss our results and provide guidelines for developers of cloud-based applications, then we discuss threats to the validity of our experimental study. In Chapter 6, we summarize our studies, and we conclude on how this study could help the design of an architectural recommendation system for developers of cloud-based applications. This chapter also discusses some avenues for future work.
CHAPTER 2 LITERATURE REVIEW
Energy consumption is the biggest challenge that cloud computing systems face today. Pinto et al. (Pinto et al., 2014), who analyzed more than 300 questions and 550 answers on Stack-Overflow question-and-answer site for developers, reported that the number of questions on energy consumption increased by 183% from 2012 to 2013. The majority of those questions were related to software design, showing that developers need guidance for designing green software systems. Similarly, Pang et al. (Pang et al., 2016)found that developers lack knowl-edge on how to develop energy-efficient software. Nowadays, cloud applications are part of the business world as they eventually increase the benefits of high availability, scalable and managed solutions. Many efforts have been focused on modeling the energy consumption of cloud infrastructures. However, most of the foregone studies were limited to hardware opti-mization, neglecting the benefits that can be achieved through software optimization. When developing an energy efficient cloud-based application, developers must seek a compromise between the application’s Quality of Service (QoS) and energy efficiency.
Cloud patterns, which are general and reusable solutions to recurring design problems, have been proposed as best practices to guide developers during the development of cloud-based applications. Although previous works such as (Hecht et al., 2014)and (Ampatzoglou et al.,
2012)have shown that patterns can improve the QoS of cloud based applications, their impact
on energy consumption is still unknown.
A design pattern describes a common problem and provides a corresponding solution, and we use patterns to document the solution in a generic template format so that it can be repeatedly applied. Our inquiry takes into account the knowledge of design patterns, not only to purvey an understanding of the plausible problems (that such designs may be subjected to), but also to provide answers as to how these problems are best tackled.
2.1 Object-Oriented Design Patterns and Software Quality
Several works in the literature have assessed the impact of design patterns on software quality
(Khomh and Guéhéneuc, 2008), software maintenance(Vokáč et al., 2004)and code
complex-ity (Prechelt et al., 2001). Overall, these studies found that design patterns do not always
improve the quality of applications. Khomh and Guéhéneuc (Khomh and Guéhéneuc, 2008)
claim that design patterns should be used with caution during software development because they may actually impede software quality. Object Oriented design patterns are usually not
supposed to increase performance, nevertheless, Aras et. al (Aras et al., 2005) have found that design patterns can have a positive effect on the performance of scientific applications despite the overhead that they introduce (by adding additional classes). Of course the re-sults of these studies cannot be directly generalized to cloud patterns, which usually focus on scalability and availability. However, they provide hints about the possible benefit and downside of cloud patterns. Clearing up the impact of cloud patterns on energy consumption as well as QoS is important to help software development teams make good design decisions.
2.2 Evaluation of Cloud Patterns
Ardagna et al. (Ardagna et al., 2012)empirically evaluated the performance of five scalability patterns for Platform as a service (PaaS): Single, Shared, Clustered, Multiple Shared and Multiple Clustered Platform Patterns. To compare the performance of these patterns, they measured the response time and the number of transactions per second. They explored the effects of the addition and the removal of virtual resources, but did not examine the impact of the patterns on energy consumption. Tudorica et al. (Tudorica and Bucur, 2011) and Burtica et al. (Burtica et al., 2012)performed a comprehensive comparison and evaluation of NoSQL databases (which make use of multiple sharding and replication strategies to increase performance), but did not examine energy consumption aspects. Along the same line of work, Cattel (Cattell, 2011) examined NoSQL and SQL data stores designed to scale by using replication and sharding. They also did not perform energy consumption evaluations. Message oriented middlewares have been benchmarked by Sachs et al. (Sachs et al., 2009), however, the energy consumption aspect was ignored.
Regarding the relationship between cloud patterns and energy consumption, Beloglazov
(Be-loglazov, 2013) proposed novel techniques, models, algorithms, and software for dynamic
consolidation of Virtual Machines (VMs) in Cloud data centers, that support the goal of reducing the energy consumption. His design architecture is reported to improve the uti-lization of data center resources and reduce energy consumption, while satisfying defined QoS requirements. Ultimately, his work led to the design and implementation of OpenStack Neat1, which is “an extension to OpenStack implementing dynamic consolidation of Virtual Machines (VMs) using live migration”.
2.3 Green Software Engineering
Software has an indirect effect on the environment, since it intensely affects the hardware functioning. Therefore, it should be written efficiently to avoid overusing the underlying hardware. There is a lack of models/descriptions with regard to environmental sustainability in the area of computer software. In fact, we can argue that software’s building process should consider energy efficiency. New green software engineering processes must be created to fulfill the constraints of energy efficiency, and developers can produce efficient code if they can understand the effects of their code on energy consumption.
We set out to investigate how applying architectural patterns can have a compelling effect on the energy consumption of cloud-based applications. Although developers can take advantage of software tools that monitor resources in order to observe energy consumption, there is still lack of programming guidelines (i.e., implementation of patterns) that they can follow during the design of their application. Although there have been efforts to improve the energy efficiency of hardware components, very few approaches examined the role that architecture plays on the energy efficiency of an application. There is a lack of software process that developers can follow to minimize the energy consumed by their application, while preserving the QoS. Mahmoud et al.(Mahmoud and Ahmad, 2013)have introduced a two level software development process, based on agile principles, and which is claimed to be environmentally sustainable. Each software stage has been marked with specific metric, representing its level of sustainability. Although this process can help reduce the energy footprint of an application’s development cycle, it does not necessarily improve the energy efficiency of the application. A comprehensive overview of sustainability perspectives in software engineering is presented in
(Calero and Piattini, 2015). This book discusses the impact of software on environment and
provides important guidelines for making software engineering “green”, i.e., reducing their environmental and energy footprints.
2.4 Software-defined Power Meters
Software-defined power meters are configurable software libraries that can estimate the power consumption of a software in real-time. Power estimation of software processes can provide critical indicators to optimize the overall energy consumed by an application. Software libraries that enable measuring the energy of cloud-based applications can help monitor and improve the design of applications, making them more energy efficient. In this section, we briefly describe some common tools used in both academia and industry, to estimate the power consumption of applications.
2.4.1 Power-API
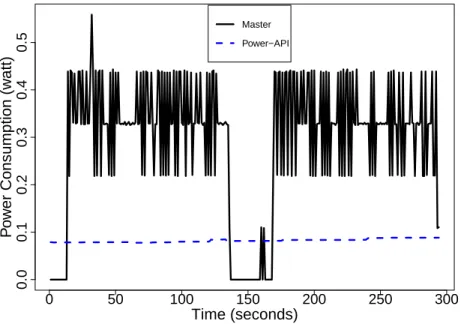
Power-API is a system-level library that provides power information per Process ID for each system component (e.g., CPU, network card, etc.) (Noureddine et al., 2012). The energy estimation is performed using analytical models that characterize the consumption of the components (i.e., CPU, memory, disk). The accuracy of Power-API was evaluated using the bluetooth PowerMeter (PowerSpy) (Vereecken et al., 2010), and results revealed only minor variations between the energy estimations of Power-API, and the energy consumption mea-sured by PowerSpy (Noureddine et al., 2012).
0 50 100 150 200 250 300 0.0 0.1 0.2 0.3 0.4 0.5 Time (seconds) P o w er Consumption (w att) Master Power−API
Figure 2.1 Power-API distortion test
Power-API was selected for this work because of its reported high accuracy (Noureddine
et al., 2012), and the aggregate energy consumption data for CPU, Memory and Disk were
collected by auditing multiple corresponding virtual machines. Power-API measures power in watts, which was converted to the unit of energy (Kilojoules). However, prior to our study, we performed a pilot procedure to examine the risk of Power-API to introduce noise in its own measurements. More explicitly, we conducted a test in which 10,000 records were inserted twice with a short gap of time into our database and both the process of Power-API and the process of the database were measured. Power-API itself runs as a process in Linux operating system, therefore, we wanted to make sure that such process does not, actually, consume energy and introduce noise in our measurements.
The result illustrated in Figure 2.1 shows that Power-API does not introduce noise in its measurements; it did not alter the energy measurements of the master server during the period of insertion. In fact, the figure shows that Power-API process itself consumes not considerable amount of energy (dashed line) and it is stable during the whole experiment, revealing that the middleware never introduces noise in measurement. The whole test dura-tion was approximately 300 seconds with a short gap in the middle. If Power-API brought noise in energy consumption measurement, we would have expected to see a fluctuating line for its energy amount throughout the test process. In second experiment, we used a newer released version of Power-API which supports the power estimation of CPU and Memory for CPU-intensive applications. This version of Power-API provided a Command-Line Interface (CLI) that as embedded in a bash script file in order to measure energy consumption of the application during each execution of the application.
2.4.2 TPC-Energy
The TPC benchmarking tool (Nambiar et al., 2014) enables benchmarking databases per-formance by simulating a series of users queries against the database. TPC-Energy (newly introduced) is the specification that is used to report energy consumption in such benchmarks. It includes energy consumption of servers, disks, and other items that consume power and that are required by the benchmark specification. TPC-benchmark supports Atomicity, Con-sistency, Isolation, and Durability (ACID) in data queries and transactions. However, in the cloud context, most transactions are Basically Available, has a Soft-state and are Eventually consistent (i.e., they are BASE).
2.4.3 Joulemeter
Joulemeter(Goraczko et al., 2011)is a software tool that can estimate the power consumption of a virtual machine (VM). Joulemeter was developed by Microsoft. It can measure memory, disk and CPU energy consumption. Although this tool has been reportedly used by IT managers, the public download is now closed. Besides, the software works only on Windows operating system.
2.4.4 jRAPL
jRAPL2 is an open source application framework recently introduced by Kenan Liu (Liu
et al., 2015) to profile Java programs running on CPUs with Running Average Power Limit
(RAPL) support. It enables chip-level power management, and it is widely supported in today’s Intel architectures. RAPL allows energy/power consumption to be reported at a fine-grained level, e.g., monitoring CPU core, CPU uncore (L3 cache, on-chip GPUs, and interconnects), and DRAM separately.
2.4.5 Power Gadget
Power Gadget3 is a software-based power monitoring tool developed by Intel Inc. Power Gad-get provides libraries for the estimation and monitoring of power consumption in real-time; using the energy counters in the processor. Its latest version 3.0 enables power estimation on multi-socket systems. It also provides externally callable APIs that can be used to extract power information from source code. The limitation of this tool is that it only supports the 2nd Generation up to the 6th generation of the Intel CoreR TM processor. Moreover, it runs only on Windows and MAC OS X operating systems.
CHAPTER 3 CLOUD PATTERNS
Designing applications for the cloud has some challenges. In the cloud, there are no precise users requirements because we don’t know all the users needs, and we don’t know the de-vices from which users will access the application. Therefore, we are unable to predict the application workload. All we can do is to anticipate failures since the application will depend on third-party software on which we have no control. Also, in the cloud, there is a cost for every load that is executed, so there must be a way to handle that. Given the magnitude of these challenges, best practices have been proposed in the form of cloud patterns to assist and guide developers during the design and implementation of their application.
Cloud Patterns are abstract solutions to recurrent design problems in the cloud. Despite their wide adoption, little is known on the effectiveness of these solutions. In the following, we discuss several possible problems that could be tackled when such architectural design guidelines (i.e. patterns) are being employed.
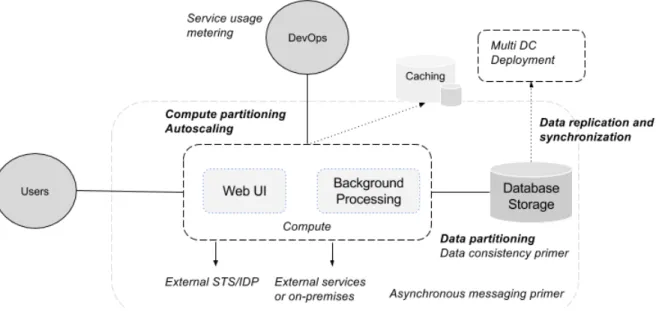
Figure 3.1 Basic orientation for developing cloud applications (Homer et al., 2014)
Figure 3.1 demonstrates exemplary contexts of cloud application development, in which dif-ferent dimensions of common problems are illustrated. As one can see on Figure 3.1, there are many problems faced by developers during the development of cloud based applications. In this thesis, we focus on four of these problems:
• Messaging: Cloud applications are usually distributed. Hence, a messaging infras-tructure is required to connect components and services to maximize scalability. Asyn-chronous messages are commonly used in cloud applications. However, they pose many issues such as messages ordering, poison message management, or idempotency. • Data Management: When deploying applications in the Cloud, developers have to
distribute databases in different locations to ensure a good performance, scalability and-or availability. This poses issues of data consistency and data synchronization across the multiple instances.
• Performance and Scalability: Performance measures the responsiveness of a sys-tem when executing a request or command in a given time. Scalability, on the other hand, enables a system to handle increased workloads without a change in performance, using available resources. Cloud applications are much likely to encounter sudden in-creases/decreases in workloads than traditional applications, hence, they require a flex-ible architecture that can scale out/in on demand to ensure good performance and high availability.
• Security: Cloud applications must defeat and prevent malicious activities and prevent disclosure and–or loss of information. These applications are exposed on the Internet. Therefore, the design and deployment of such applications should restrict access to only trusted users and protect sensitive data/information.
Table 3.1 summarizes some common problems that developers face when developing cloud-based applications, along with the corresponding pattern that can be implemented to tackle the problem. For example, the Gatekeeper pattern can be used whenever security is critical, and Sharding can be used to solve data management issues when the data is partitionable, etc.
Table 3.1 Common Problems in Cloud Area and Suggested Patterns
PROBLEM IN CLOUD AREA SUGGESTED PATTERN
Messaging Competing Consumers, Pipes & Filters, Priority Queue
Performance & Scalability Competing Consumers, Priority Queue, Proxy, Sharding
Security Gatekeeper
3.1 Cloud Patterns
We now discuss the six patterns studied in this thesis.
3.1.1 Local Database Proxy
This pattern uses data replication between master/slave databases and a proxy to route requests (Strauch et al., 2012). Write requests are handled by the master and replicated on its slaves, while Read requests are processed by slaves. When applying this pattern, components must use a local proxy whenever they need to retrieve or write data. The proxy distributes requests between master and slaves depending on their type and workload. Slaves may be added or removed during the execution to obtain elasticity. There could be a risk of bottleneck on the master database when there is a need to scale with write requests. This issue together with the lack of strategy for write requests are the main limitations of this pattern. The impact of this pattern on the QoS of applications has been examined by Hecht et al. (Hecht et al., 2014); however, to the best of our knowledge, no work has empirically investigated the impact of the Local Database Proxy pattern on the energy consumption of applications.
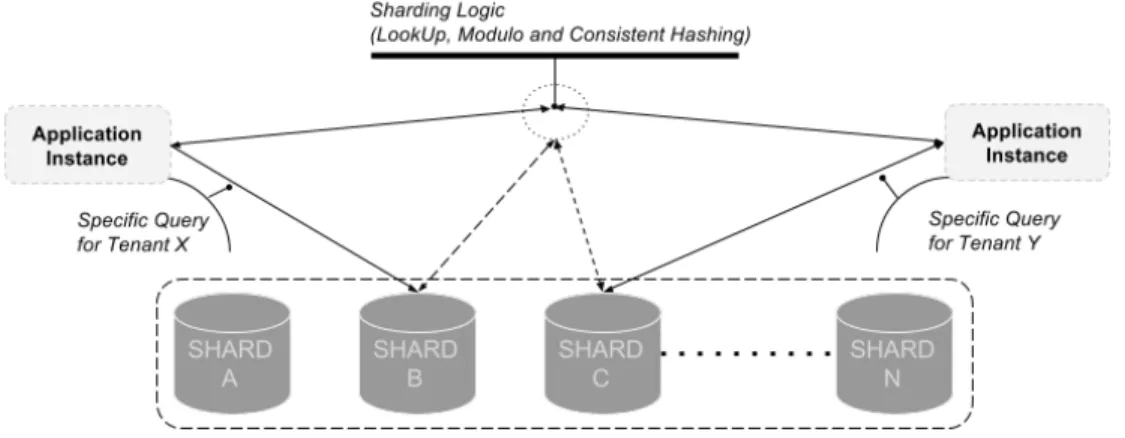
3.1.2 Local Sharding-Based Router
This pattern is useful when an application needs scalability both for read and write opera-tions (Strauch et al., 2012). Sharding is a technique that consists in splitting data between multiple databases into functional groups called shards. Requests are processes by a local router to determine the suitable databases. Data are split horizontally i.e. , on rows, and each split must be independent as much as possible to avoid joins and to benefit from the sharding. The sharding logic is applicable through multiple strategies; a range of value, a specific shard key or hashing can be used to distribute data among the databases. It is possible to scale the system out by adding further shards running on redundant storage nodes.
Sharding reduces contentions and improves the performance of applications by balancing the workload across shards. Shards can be located close to specified clients to improve data accessibility. When combined with other patterns, Sharding can have a positive impact on the QoS of applications (specifically when experiencing heavy loads) (Hecht et al., 2014). However, the impact of Sharding on energy consumption is still unclear.
Figure 3.2 Local Sharding-Based Router Pattern (Homer et al., 2014)
Figure 3.2 illustrates the implementation of the Sharding pattern. Whenever the data struc-ture allows for sharding, significant performance improvements can be achieved since the processing of requests is distributed across multiple shards and servers in the network. The main disadvantage of the sharding pattern is the fact that application developers have to write extra code to handle the sharding logic, which eventually makes the overall design process more complex.
A performance degradation can be observed when the capacity of a shard is exceeded. This can happen when a customer interacts with the database more, hence this customer has more allocation of read/write requests than the others. Overall, sharding can help improve the number of queries that an application can handle, resulting in higher scalability and availability. Also, a good sharding logic creates a good data locality, which improve the response time of the application; local data are accessed faster.
3.1.3 Priority Message Queue
This pattern which implements a First In First Out (FIFO) queue is typically used to sur-rogate tasks to background processing or to allow asynchronous communications between components. Priority Message Queue is recommended when there are different types of mes-sages. Basically, messages with high priority values are received and processed more quickly than those with lower priority values. Message Queues enable designing loosely coupled com-ponents and improve the scalability of applications (Hecht et al., 2014). Figure 3.3 depicts the overall architecture of this pattern.
Figure 3.3 Priority Message Queue Pattern (Homer et al., 2014)
3.1.4 Competing Consumers
A cloud-based application is likely to face a large number of requests sent by the users. A common technique to provide responses is to pass them through a messaging system to an-other service that processes them asynchronously rather than synchronously ensuring that the business logic of the application is not blocked. In addition, requests in a cloud domain may increase significantly over time and unpredictable workloads might be exposed to the application. The Competing Consumers pattern allows applications to handle fluctuating workloads (from idle times to peak times), by deploying multiple instances of the consumer service coordinated to ensure that a message is only delivered to a single consumer. The architecture recommends to use a message queue as the communication channel (and as a buffer) between the application and the instances of the consumer service. Figure 3.4 illus-trates the architecture of this pattern.
Figure 3.4 Competing Consumer Pattern (Homer et al., 2014)
When using this pattern, multiple concurrent consumers can process messages received on the same messaging channel, which can result in a system that processes multiple messages concurrently with an optimized throughput. In other words, this pattern would potentially improve scalability and availability, and can help balance the workload. The Competing Consumers pattern enables handling wide variations in the volume of requests sent by ap-plication instances, and improves reliability. It guarantees that a failed service instance will not result in blocking a producer, and messages can be processed by other working services.
This pattern eliminates complex coordination between the consumers, or between the pro-ducer and the consumer instances, therefore increasing maintainability. Instances of a con-sumer service can be dynamically added or removed as the volume of messages change. This pattern will be implemented and investigate in terms of performance and energy optimization.
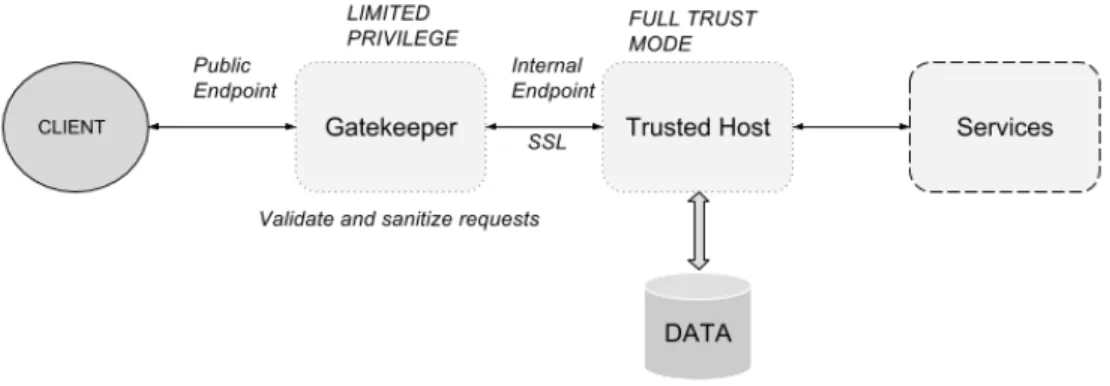
3.1.5 The Gatekeeper
This pattern describes a way of brokering access to data and storage. In cloud applications, usually, instances directly connect to the storage, maximizing the risk of exposing sensitive data. If a hacker gains access to the host environment, the security mechanisms and keys will be compromised, therefore, the data itself can be divulged.
The gatekeeper is a web service designed to handle requests from clients. It is the key entry point of the system. It processes and directs requests to trusted messages on another instance(s) called Trusted Host. The Trusted Host holds the necessary code and security measures required to retrieve data from the storage.
In fact, we tend to decouple application instances from the storage retrieving instances. The goal of this pattern is to bring about control validation, limited risk and exposure, and appro-priate security to cloud applications. The architecture of this pattern is presented in Figure 3.5. The main issue is to ensure that trusted host only connects to the gatekeeper, therefore, a secure communication channel (HTTPS, SSL, or TLS) must be employed. Moreover, as the gatekeeper could be the single point of failure in such design, we must consider deploying additional instances along with auto-scaling mechanisms. This pattern is suitable for appli-cations that handle sensitive/protected information or data, and whenever the validation of requests must be performed separately from the tasks inside a system.
3.1.6 Pipes and Filters
Cloud-based applications often perform a variety of tasks of varying complexity. The Pipes and filters pattern recommends to decompose processing into a set of discrete components i.e., filters. A communication channel i.e., pipes is required to convey the transformed data (from each step) between the filters. This pattern is used to ensure performance and scalability. It also improves resiliency because if a task is failed, it can be rescheduled on another instance. Failure of an instance (filter) does not necessarily result in the failure of the entire pipeline. Figure 3.6 presents an illustration of the pipes and filters pattern.
Figure 3.6 Pipes and Filters Pattern (Homer et al., 2014)
The main disadvantage of this pattern is the fact that the time required to process a single request depends on the speed of the slowest filter in the pipeline. There is also a risk that one or more filters form a bottleneck. The deployment automation and testing of pipe and filters architectures can be complex because developers and testers might have to deal with a variety of technologies, and isolated data sources. In this thesis, we examine the impact of this pattern on the energy efficiency of applications.
CHAPTER 4 METHODOLOGY AND DESIGN
4.1 Context and Problem
Previous work has shown that cloud patterns can improve the Quality of Service (QoS) of cloud applications (Hecht et al., 2014), but their impact on energy consumption is still unknown. This study sets out to empirically investigate the impact of six patterns on the per-formance (response time) and energy consumption of cloud-based applications. The goal of this study is to provide architectural design guidelines to developers and raise their awareness about the trade-offs between performance and energy optimization, during the development of cloud-based applications.
4.2 Study Definition and Design
We set out to empirically evaluate the impact of Local Database Proxy, Local Sharding-Based Router, Priority Message Queue, Competing Consumers, Gatekeeper and Pipes and Filters on the energy consumption of cloud-based applications. We select these cloud patterns because they are used in previous studies (Hecht et al., 2014; Tudorica and Bucur, 2011) (allowing us to compare our results with these previous works), and because they are described as good design practices by both academic and practitioners. This section presents our research questions, and describes the two experimental setups of our study, as well as our design and procedure.
4.2.1 Research Questions
Our study aims to answer the following research questions:
(RQ1) Does the implementation of Cloud patterns affect the energy consumption of cloud-based applications?
(RQ2) Do interactions among patterns affect the energy consumption of cloud-based appli-cations?
4.2.2 Experimental Setup
To answer these research questions, we conducted the following two experiments.
Experiment 1
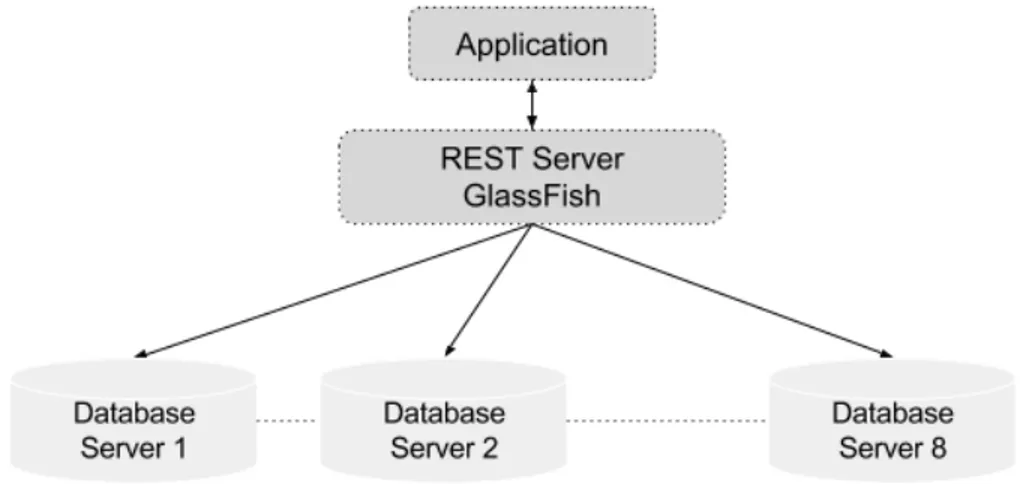
A multi-threaded distributed application, which communicates through REST calls was im-plemented and deployed on a GlassFish 4 application server. We chose MySQL as the database management system because it is one of the most popular databases for Cloud applications. Sakila database 1 provided by MySQL is used as it is initially developed to provide a standard schema, containing a large number of records, making it interesting for experimentations. Sakila also serves to highlight the latest features of MySQL such as Views, Stored Procedures, and Triggers, and it is consistent with existing databases. The test appli-cation was fully developed with the Java Development Kit 1.7 and it is composed of about 3,800 lines of code and its size is 6 MB. The master node has the following characteristics: 2 virtual processors (CPU: Intel Xeon X5650) with 8GB RAM and 40GB disk space. This node is a virtual machine of a server located on a separate network. We have 8 slave database nodes: 4 on one server, each one has a virtual processor (CPU: Intel QuadCore i5) with 1 GB RAM and 24 GB disk space. The other four database nodes are on a second server with the following characteristics: each Virtual Machine has one virtual processor (CPU: Intel Core 2 Duo), 1 GB RAM and 24 GB disk space. All the hardware is connected on a private network behind a switch. All the virtual machines are running on VMware ESXi and all the servers are running Ubuntu 14.04 LTS 64-bit as operating system. The architectural design of Experiment 1 is shown in Figure 4.1.
Figure 4.1 Architectural Design of the First Experiment
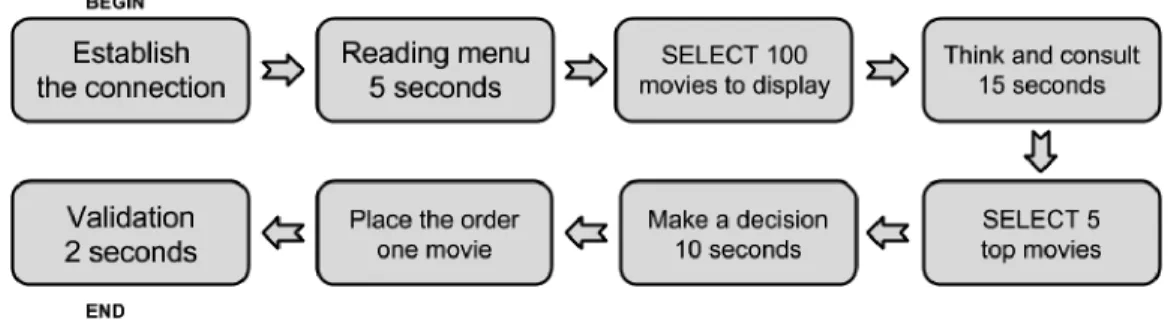
A scenario was designed in which the client is a thread generated on the client side of our cloud-based application. This client establishes a connection to the server, and then performs a series of actions in a certain amount of time (see Figure 4.2). Each client sends 100 select requests at the peak of the scenario workload, and we measure the response time of the application at this point by taking the average of the response time to all clients. This will represent the performance of the application.
Figure 4.2 First Experiment Test Scenario
We repeat this scenario using different numbers of clients. The requests performed by the clients are: select or write to display or place the order respectively. The application generates concurrent threads to simulate clients propagating these requests. The number of clients used in our experiments are: 100, 250, 500, 1000 and 1500. Power-API is located on the database node and measures the amount of energy consumed by the MySQL process. Because of the variability observed during multiple executions of an application (caused for example by optimization mechanisms like caching), we repeated each experiment five times and took the average.
Experiment 2
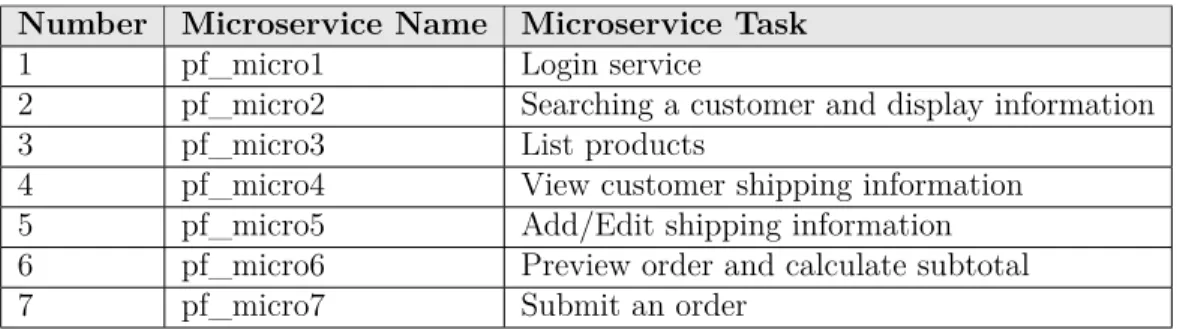
Our second application was implemented using Python Flask microframework. This micro web framework is highly scalable and extensible. Cloud computing services are commonly multi-language in the real world, however, Java and Python are two most often used pro-gramming languages in Cloud applications. Therefore, we set up our second experiment using Python in order to achieve diversity and compare results for two different program-ming languages. The application reports the average response time of clients by measuring the response time to deliver results to each client during the execution. It includes 17 modules and 7 microservices (the list of microservices is presented in Table 4.1) that are communicat-ing with each other uscommunicat-ing REST web services. 10 stored procedures were designed to make the response when querying the database machines.
The microservices architectural style enables developing a single application as a suite of small services, each running in its own process, having its own data storage. Microservices are communicating with lightweight mechanisms, often an HTTP resource API and they are built around business capabilities. Moreover, the deployment of microservices can be fully automated and the services can be deployed independently. In order to fully benefit from the microservice architectural style, each service should be elastic, resilient, composable, minimal, and complete. Monolithic applications, on the other hand, are built on a single unit, thus any changes to the system involves building and deploying a new version of the server-side application. Change cycles are tied together, meaning that a change made to a small part of the application requires the entire monolith application to be rebuilt and deployed.
Over time it can become hard to maintain a good modular structure in monolithic applica-tions, making it harder to keep changes that ought to only affect one module within that module. Scaling requires scaling of the entire application rather than parts of it, which consumes more resources. In this work, we have implemented both a monolithic and a mi-croservice version for our application.
The application was deployed on 15 virtual machines, i.e., m3.xlarge instances from Amazon EC2 which provides a balance of compute, memory, and network resources. Each instance had 4 CPU cores with 15 Gb memory available and 2 SSD 40 Gb hard disks running Ubuntu 14.04 LTS 64-bit. Requests were sent from an application machine simulating the behavior of clients to the interconnected virtual instances, through REST services. Microservices were deployed on separate instances to simulate the communication of microservices through a network. As for the monolithic version of the application, the clients requests were processed sequentially in one separate module. In a microservice architecture, there is no clear leading service that drives the rest of the services. In other words, each service module of our ap-plication controls its business function and data, and they all have an equal contribution to the application. However, the microservice 1 of the application had to be called constantly by the other services since this service was in charge of security checks and was responsible for providing authorizations to clients. The architectural design of Experiment 2 is shown in Figure 4.3.
The Northwind sample database2 was chosen for the second experiment. We choose this database because of its rich set of functionalities. The Northwind database is about a com-pany named “Northwind Traders”. The database includes all the sales transactions that
Figure 4.3 Architectural Design of the Second Experiment
occured between the company i.e., Northwind traders and its customers as well as the pur-chase transactions between Northwind and its suppliers. We installed a MySQL version3 of this database to conduct our experiment. All the information contained in this database is anonymized. All the views, triggers and stored procedures used in this experiment were written from scratch for the purpose of the experiment.
Table 4.1 List of Microservices and their Tasks
Number Microservice Name Microservice Task
1 pf_micro1 Login service
2 pf_micro2 Searching a customer and display information
3 pf_micro3 List products
4 pf_micro4 View customer shipping information
5 pf_micro5 Add/Edit shipping information
6 pf_micro6 Preview order and calculate subtotal
7 pf_micro7 Submit an order
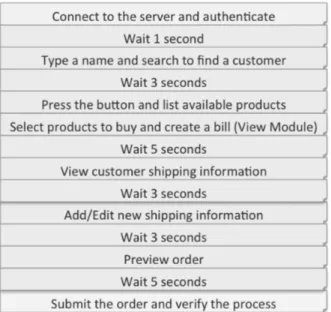
The application represents a typical SaaS application that simulates sales representatives of the Northwind Trading Company using a Pocket PC to take orders from customers and synchronizing the new orders back to the database concurrently. The scenario is depicted in Figure 4.4. Similar to Experiment 1, we repeated this scenario using different number of clients. The requests performed by the clients are: select or write to display or place the order respectively. The application generates concurrent threads on the server side, and multiprocessing in the client side to simulate clients propagating their requests.
The number of clients used in our experiments are: 100, 250, 500, 1000, 1500, 2000, 2500 and 3000. The Power-API is located on the database node and REST server nodes, and measures the amount of energy consumed by MySQL processes and the REST server accepting REST calls. Because of the variability observed during multiple executions of an application, we repeated each experiment five times and took the average.
Figure 4.4 Second Experiment Test Scenario
To better understand the impact of combinations of Cloud patterns, we designed two ap-proaches (a Lightweight and a Heavyweight approach) mimicking the behavior of ordinary customers and VIPs passing orders:
- Lightweight approach (Simple queries / small sized company customer):
• MQ + Proxy • MQ + Sharding
• Sharding + Pipes & Filters
- Heavyweight approach (Complex queries / VIP company customer): • Sharding + Competing Consumers + Pipes & Filters
4.2.3 Implementation of the Patterns
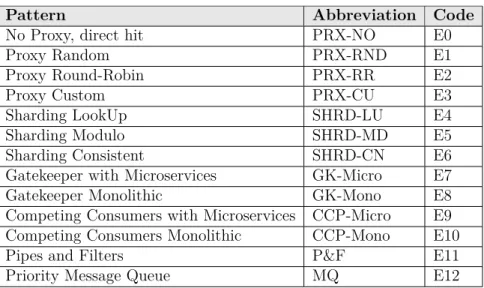
In order to evaluate the benefits and the trade-offs between the Local Database Proxy, the Lo-cal Sharding-Based Router and the Priority Message Queue design patterns, we implemented these patterns in the applications described in Section 4.2.2 and examined them through the mentioned scenarios. The NoProxy/NoSharding version E0 does not use any pattern. Ver-sions E1 to E3 implement Local Database Proxy with Random Allocation, Round-Robin and a Custom load balancing algorithm. Versions E4 to E6 correspond to Local Sharding-Based Router with three sharding algorithms: Modulo, Lookup and Consistent Hashing. Two dif-ferent implementations of the Gatekeeper pattern have two version E7 for the decomposed architecture with microservices employed to communicate and deliver messages and E8, that is the monolith and performs all the tasks in a series of orders. The Competing Consumers pattern also has the two version E9 and E10, which refer to the microservices and monolithic style of this pattern respectively. The Pipes and Filter pattern has only the microservices architecture style marked with E11 version in our experiments.
Version E12 implements the Priority Message Queue pattern. Since there is only one im-plementation of Priority Message Queue pattern in this study, we investigate its impact on energy consumption only in combination with the other patterns. Table 4.2 summarizes the different versions of the applications that were produced.
Table 4.2 Patterns chosen for the experiments
Pattern Abbreviation Code
No Proxy, direct hit PRX-NO E0
Proxy Random PRX-RND E1
Proxy Round-Robin PRX-RR E2
Proxy Custom PRX-CU E3
Sharding LookUp SHRD-LU E4
Sharding Modulo SHRD-MD E5
Sharding Consistent SHRD-CN E6
Gatekeeper with Microservices GK-Micro E7
Gatekeeper Monolithic GK-Mono E8
Competing Consumers with Microservices CCP-Micro E9
Competing Consumers Monolithic CCP-Mono E10
Pipes and Filters P&F E11
To ensure lower variance between maximum and average values and hence increase the pre-cision of our energy measurements, we eliminated the values of the first and last executions. In total, our application was able to simulate a maximum of 150,000 concurrent requests, enabling us to establish cloud-based applications for our experiment that are capable of re-sponding to thousands of coincidental requests from clients. This level of load is reflective of real-world cloud applications.
In our study, each experiment is independent with regard to others, and simulations were terminated at a fixed time. Even large requests and heavy loads never lasted more than a certain amount of time predefined as the maximum, which is 180 seconds for the first appli-cation and 75 seconds for the second one. In the following, we explain in details the specific algorithms that were implemented in each pattern.
Local Database Proxy: Three implementations of this pattern were considered in our research; Random allocation strategy, Round-Robin allocation strategy, and Custom Load balancing strategy. The proxy is placed between the server and the clients. The basic ap-proach, NoProxy REST web service, exposes a set of methods that are hitting the database directly without load balancing. This method has been implemented to test the local database proxy pattern. It is the baseline used to compare the results of our proxy implementations. The queries are built using parameters such as the ID of a select passed over the REST call from each client (thread) concurrently during each scenario.
The random approach is implemented by choosing randomly an instance from the pool. The round-robin chooses the next instance that has not yet been used in the “round", i.e. the first, then the second, then the third,. . . , finally the first and so on. The custom algorithm is more reactive, and it uses two metrics to evaluate the best slave node to pick: the ping response time between the server and slave, and the number of active connections on the slaves. A thread is started every 500 ms with the purpose of monitoring such metrics. After choosing the corresponding slave, the query is executed and the result is sent back to the function that was called. To simplify the tests, only IDs (number identifiers) were sent back, so there was no need to serialize any data. Eventually, if the result is null, the response sent to the client has the http no content status. Otherwise, the result is sent back to the client using the http ok response status.
sep-arately. Each shard had the same database schema and structure as suggested by Sharding Algorithms4. Two tables of a modified version of the Sakila database were used. All the re-lationships in both the “rental" and “film" tables were removed since the sharding is adapted only for independent data.
Three commonly known sharding algorithms were studied in our research: Modulo algorithm, Look-up algorithm and the Consistent Hashing algorithm. The modulo algorithm divides the request primary key by the number of running shards, the remainder is the number of the server which will handle the request. The second sharding algorithm used is the Look-up strategy. This algorithm implements an array with a larger amount of elements than the number of server nodes available. References to the server node are randomly placed in this array such that every node receives the same share of slots. To determine which node should be used, the key is divided by the number of slots and the remainder is used as index in the array. The third sharding algorithm used is the Consistent Hashing. For each request, a value is computed for each node. This value is composed of the hash of the key and the node. Then, the server with the longest hash value processes the request. The hash algorithms recommended for this sharding algorithm are MD5 and SHA-1.
Priority Message Queue: Requests are annotated with different priority numbers and sent in the priority message queue of our test application. All requests are ordered according to their priority and processed by the database services in this order.
Competing Consumers: This pattern puts the request of each client into a message queue, then delivers the requests to the database by a simple mechanism to preserve the load bal-ance: The requests include a hash ID of the priority, which will be converted to a bigInt number and is divided by the number of instances and the remainder is the server to hit. We have conducted a series of experiments to confirm that this approach maintains load balancing among the clients queries.
The Gatekeeper: our set up for this pattern consists of 5 gatekeepers, 5 trusted hosts and 5 databases. Each query from a client is being redirected to the trusted host if it passes the security check. The security process tries to find similarity between the query and 10 predefined SQL injection rules. If a match is found, the query will be discarded, otherwise the query will be transferred to the corresponding trusted host, by using the hash ID of the
message and turning it into a bigInt number and dividing it by 5 to obtain the remainder (i.e., the same approach as for the competing consumers pattern) to ensure load balancing. Then, the selected trusted host will query the database and re-transfer the results to the gatekeeper and, ultimately, this result will be delivered back to the client. The security mechanism will take place for every query, no matter the priority and the sender identity. However, if the query was suspicious and considered harmful, the gatekeeper would block the client, and the clients identification (including the query and IP address) will be saved in a black list. The gatekeeper will reject any further queries sent by this specific client and provide a message explaining the reason why the client cannot access the requested data. Since SQL injection rules are subject to changes, we opted in this work for simple rules, to demonstrate the be-havior of this pattern. Table 4.3 summarizes the SQL injection rules applied to this pattern in our study.
Table 4.3 SQL injection rules applied in the Gatekeeper pattern
Type Rule Manifest
type-1
SELECT col1 FROM table1 WHERE col1 > 1 OR 1=1;
The where clause has been short-circuited by the addition of a line such as ‘a’=’a’ or 1=1
type-2
SELECT col1 FROM table1 WHERE col1 > 1 AND 1=2; The where clause has been truncated with a comment
type-3
SELECT col1 FROM table1 WHERE col1 > 1;
The addition of a union has enabled the reading of a second table or view
type-4
SELECT col1 FROM table1 WHERE col1 > 1;
UPDATE table2 set col1=1; Stacking Queries, executing more than one query in one transaction
type-5
SELECT col1 FROM table1 WHERE col1 > 1 UNION SELECT col2 FROM table2; An unintentional SQL statement has been added
type-6
SELECT col1 FROM table1 WHERE col1 > 1; drop table t1; SQL where an unintentional sub-select has been added
type-7
SELECT fieldlist FROM table WHERE field = ’x’ AND email IS NULL; –’; Schema mapping
Pipes and Filters: The objective of this pattern is to decompose a task that performs complex processing into a series of discrete elements that can be reused. This pattern can improve performance, scalability, and reusability by allowing task elements that perform the processing to be deployed and scaled independently. This pattern was deployed by implementing a pipeline and using a message queue. In the monolithic version, tasks are just series of REST calls performed one by one through the execution, which is time consuming
and a single change might result in change in other services. On the other hand, in the case of microservices, the application decomposes the tasks into several interconnected microservices communicating by REST calls.
Combined Patterns: The combination of patterns was driven by the functionalities of the application. For example, when Proxy/Sharding is combined with Message Queue, this means that the application uses the message queue to prioritize queries, then hits the database using Proxy/Sharding pattern implementations. In our light-weight approach, the Pipes and Filters pattern has been applied to decompose the request into microservices, then the Sharding pattern is used to access the databases.
In total, twelve versions of the application were analyzed and summarized in Table 4.2. To collect the energy measurements required to answer our research questions, a series of scenar-ios were executed. These scenarscenar-ios were designed specifically to simulate the characteristics of a real-world cloud-based application.
4.2.4 Hypotheses
To answer our research questions, we formulate the following null hypotheses, where E0, Ex (x ∈ {1 . . . 11}), and E12 are the different versions of the applications, as described in Table 4.2:
• H1
x : There is no difference between the average amount of energy consumed by design Ex and design E0.
• H1
x12 : The average amount of energy consumed by the combination of designs Ex (x ∈ {1 . . . 6}) and E12 is not different from the average amount of energy consumed by each design taken separately.
• H1
x11 : The average amount of energy consumed by the combination of designs Ex (x ∈ {4 . . . 6}) and E11 is not different from the average amount of energy consumed by each design taken separately.
• H1
x9 : The average amount of energy consumed by the combination of designs Ex (x ∈ {4 . . . 6}) and E11 and E9 is not different from the average amount of energy consumed by each design taken separately.
• H1
x7 : The average amount of energy consumed by the combination of designs Ex (x ∈ {4 . . . 6}) and E11 and E9 and E7 is not different from the average amount of energy consumed by each design taken separately.