HAL Id: hal-00001615
https://hal.archives-ouvertes.fr/hal-00001615v2
Submitted on 23 Feb 2005
HAL is a multi-disciplinary open access
archive for the deposit and dissemination of
sci-entific research documents, whether they are
pub-lished or not. The documents may come from
teaching and research institutions in France or
abroad, or from public or private research centers.
L’archive ouverte pluridisciplinaire HAL, est
destinée au dépôt et à la diffusion de documents
scientifiques de niveau recherche, publiés ou non,
émanant des établissements d’enseignement et de
recherche français ou étrangers, des laboratoires
publics ou privés.
Evidence for new physics from clusters ?
Alain Blanchard, Marian Douspis
To cite this version:
Alain Blanchard, Marian Douspis. Evidence for new physics from clusters ?. Astronomy and
Astro-physics - A&A, EDP Sciences, 2005, 436, pp.411B. �hal-00001615v2�
ccsd-00001615, version 2 - 23 Feb 2005
(DOI: will be inserted by hand later)
Evidence for new physics from clusters ?
Alain Blanchard
1and Marian Douspis
21 LATT, 14 avenue Edouard Belin, F-31400 Toulouse, France e-mail: alain.blanchard@ast.obs-mip.fr
2 LATT, 14 avenue Edouard Belin, F-31400 Toulouse, France e-mail: douspis@ast.obs-mip.fr
Abstract.The abundance of local clusters is a traditional way to derive the amplitude of matter fluctuations, commonly
speci-fied by σ8, but which suffers from a systematic uncertainty arising from the lack of accurate knowledge of the mass temperature relation. In the present work, by assuming that the observed baryon content of clusters is representative of the universe, we show that the mass temperature relation (M − T ) can be specified for any cosmological model. WMAP constraints on the baryonic content of the Universe and the ΩM−H0 relation allows one further improvement in tightening this M − T relation. This approach allows to remove most of the above uncertainty, and to provide an estimation of σ8whose uncertainty is essentially statistical. The values we obtain are fortuitously almost independent of the matter density of the Universe (σ8∼0.6 − 0.63) with an accuracy better than 5%. Quite remarkably, the amplitude of matter fluctuations can be also tightly constrained to similar accuracy from existing CMB measurements alone, once the dark matter content is specified. However, the amplitude inferred in this way in a concordance model (Λ − CDM) is significantly larger than the value derived from the above method based on X-ray clusters. Such a discrepancy would almost disappear if the actual optical thickness of the Universe was 0 but could also be alleviated from more exotic solutions: for instance the existence of a new non-baryonic light dark component in the Universe as massive neutrinos, with Ωd∼0.01 − 0.03. However, recent other indications of σ8favor a high normalization. In this case, the assumption that the baryonic content observed in clusters actually reflects the primordial value has to be relaxed : either there exists a large baryonic dark component in the Universe with Ωd ∼ 0.01 − 0.03 ∼ 0.5Ωb or baryons in clusters
have undergone a large depletion during the formation of these structures. We concluded that the baryon fraction in clusters is not representative and therefore that an essential piece of the physics of baryons in clusters is missing in standard structure formation scenario.
Key words.Cosmology – Galaxy clusters – CMB – Cosmological parameters
1. Introduction
The amplitude of matter fluctuations in the present-day uni-verse is an important quantity of cosmological relevance. The abundance of clusters is an efficient way to evaluate this quan-tity, commonly expressed by σ8, the r.m.s. amplitude of the matter fluctuations on the 8h−1Mpc scale. A statistical preci-sion of a few % on σ8 is possible from existing samples of X-ray clusters, but in practice the relation between mass and temperature is needed for such evaluation:
T = AT MM152/3(ΩM(1 + ∆)/179)1/3h2/3(1 + z) keV (1)
(Oukbir and Blanchard, 1992), ΩMbeing the present–day
mat-ter density paramemat-ter and ∆ being the contrast density relative to the Universe at the radius at which M15 is taken. The value of AT Mhas been estimated from X-ray properties of clusters by
different methods, essentially hydrostatic equations on one side and numerical simulations on the other side, which lead to dif-ferent normalizations (from σ8∼0.6 to σ8∼1.). Mass lensing
Send offprint requests to: Alain Blanchard
measurements of clusters could in principle provide a direct measurement of this quantity but present-day results are con-tradictory. This question remained unresolved because the am-plitude of matter obtained from clusters with hydrostatic equa-tions leads to low values, σ8 ∼0.7 ± 0.06 (Markevitch 1998, Reiprich et al. 2002, Seljak 2002) while WMAP recently ob-tained σ8∼0.9 ± 0.1 (Spergel et al. 2003). However, the virial cluster masses are difficult to obtain, and values inferred with different methods spread a large range of values; for instance Roussel et al. (2000) pointed out that hydrostatic mass estima-tions were lower than values inferred from numerical simula-tions and Henry (2004) recently found that published values of
β, a quantity proportional to AT M, could differ by a factor of
nearly two. This leaves a large uncertainty on the actual ampli-tude of matter fluctuations derived from clusters. In this paper, we propose a new approach to derive the mass-temperature re-lation in a self-consistent way. This allows us to combine the baryon budget from the CMB, observed gas mass in clusters and the present day abundance of clusters to infer a tight con-straint on the amplitude of matter fluctuations obtained from
2 Alain Blanchard and Marian Douspis: Evidence for new physics from clusters ?
Fig. 1. The central area is the amplitude of matter fluctuations
expressed in term of σ8versus the normalization of the mass temperature ATM (Eq. 1) for a flat model with ΩM = 0.3.
Grey areas are our one, two and three sigma level contours. Filled squares are from Vauclair et al. (2003), open squares are Pierpaoli et al. (2001), around ATM ∼ 7 and Pierpaoli et al. (2003), × symbol is from Evrard et al. (2002), Triangle is from Seljak (2002), inverted triangles are from Viana et al. (2002) and Viana et al. (2003).
the cluster abundance and compare it to the amplitude inferred from the CMB.
2. Mass-Temperature relation 2.1. The
σ
8-A
T Mdegeneracy.The determination of σ8from the cluster abundance is a stan-dard procedure that has been used by many authors, leading to somewhat dispersed values. Here we use the Sheth and Tormen (1999) mass function and a sample of X-ray selected local clus-ters ( fx≤2.210−11erg/s/cm2and |b| ≤ 20 deg, Blanchard et al.,
2000 updated from BAX, Sadat et al. 2004). The relation be-tween σ8-AT M is presented in Figure 1 for a flat model with
ΩM = 0.3 with some other recent measurements, based on
ROSAT samples of X-ray clusters and a recent analytical mass functions (del Popolo 2004). We do not include analyses based on HEAO-1 such as Henry (2004) or using the classical Press and Schechter expression as do Ikebe et al. (2001), or other mass functions. A NFW profile (Navarro et al. 1995) with c = 5 was assumed when necessary. This shows that most of the dis-persion among different analyses (which use nearly the same clusters) is due to the different values used for the normaliza-tion constant AT M. Most of the remaining differences are due to
differences in temperatures used (with or without cooling flow correction, or temperature cuts). Notice that the point present-ing the largest deviation (Viana et al. (2002)) is based on the luminosity function. We converted their mean luminosity to a mean temperature of 2.68 keV to derive an equivalent AT M.
Fig. 2. The red line is the central value of ATMwhich is the nor-malization of the mass temperature relation Eq. 1. The WMAP relation between H0and Ω0has been used, as well as the con-straint on the baryon content of the Universe. One and two
σ uncertainties arising from uncertainty on Ωb (= 0.023 ±
0.002) are shown as blue and yellow areas. Horizontal areas correspond to estimations of ATM from hydrostatic methods (light green) obtained by Roussel et al. (2000) and Markevitch (1998) and from numerical simulations (light blue) obtained from Bryan & Norman (1998) and Evrard, Metzler & Navarro (1996).
2.2. The baryon fraction argument
Clusters are useful cosmological probes in several important ways. Their baryonic fraction fbcan be inferred from
observa-tions:
fb= Mb Mtot
; (2)
the mass in observed baryons, Mb, consists mainly of the
X-ray gas and of a small part of the stars (Roussel et al 2000), while the total mass Mtot could be estimated through one of
the above–mentioned methods. Under the assumption that the baryonic and dark matter amounts are representative of the uni-verse, the baryon fraction can be related to the cosmological parameters density Ωband Ωm:
fb= Υ
Ωb
Ωm
. (3)
Υ is a numerical factor that has to be introduced in order to
cor-rect for the depletion of gas during cluster formation and which can be determined only from numerical simulations (White et al. 1993). In practice, a good working value, at least in the outer part of clusters, is Υ = 0.925 (Frenk et al. 1999). The bary-onic content of the Universe is now known quite accurately through WMAP and other CMB measurements (ωb = Ωbh2 =
0.023 ± 0.002, Spergel et al. 2003; the statistical uncertainty being doubled in order to account for differences in various priors), essentially consistent with the abundance of Deuterium (Kirkman et al. 2003) and with the baryonic content of the IGM (Tytler et al 2004).
2.3. Self-consistent mass-temperature relation
While the above relations have been widely used to obtain con-straints on Ωmassuming that the M − T relation is known, here
we follow a different approach. Given the uncertainty in the actual value of AT M, we can use the knowledge of gas (and
stars) masses in clusters and of Ωbto constrain the total mass
in clusters, at least as a function of Ωmand h, and thereby infer
the mass-temperature relation. A slight source of complexity in gas mass measurements comes from the fact that the gas in clusters may be clumpy. If so, the gas mass estimation from average radial profile of the emissivity overestimates the actual gas mass by a factor C1/2, where C is a measurement of the clumping of the gas. Sadat and Blanchard (2001) have stud-ied in detail the change in shape of the gas fraction with radius in clusters: they found that the gas fraction follows rather well a scaling law, i.e. it is roughly identical among different clus-ters when expressed in term of the radius normalized to the virial radius. Furthermore they found that in the outer part the shape was close to what has been found in numerical simula-tions provided the outer amplitude is corrected for clumping (the value of Υ being roughtly constant ∼ 0.925 for ∆ ≤ 1000). This implies that correction for clumping is indeed important to have an unbiased description of the internal structure of clus-ters. Mathiesen et al. (1999) found an average C1/2 of 1.16 at the radius corresponding to a contrast density ∆ of 500 (they also found that taking only clusters with no secondary peak at a level of 1% of the global maximum reduced the average C1/2to 1.093). Because the clumping factor seems to vary rapidly with radius, it is safe to work on clusters at a similar radius. We have used the gas mass determination from Vikhlinin, Forman and Jones (1999, VFJ99 hereafter), using their most external radius for mass determination, which is h−dependent, at the average temperature of 4 keV. VFJ99 provided gas mass measurements at the radius R1000 where the contrast density in the gas is 1000 times some fiducial baryon density (2.85 109M
⊙/Mpc3), which corresponds to nearly half of the best ωb derived from
WMAP. Typical density contrasts at our working radius are in the range 480–625, at which we can directly apply the above correction for clumping. VFJ99 excluded clusters with double or very irregular X-ray morphology, a criteria that seems less demanding than the criteria for regularity used by Mathiesen et al. (1999). However, in both cases roughly one third of the clusters were excluded from the analysis. We therefore used the value C1/2 = 1.093. The difference to C1/2 = 1.16 is a
source of systematic uncertainty on the final mass of 6%. We further corrected for a star contribution of 34h1.5% (Roussel et al. 2000). Knowing the baryon mass, relations 2 and 3 can be used to infer the total mass (depending on Ωm) at the radius
R1000. Finally, in order to use the above mass estimation in the mass function we need to estimate the mass at the virial radius (unfortunately measurements of both apparent gas mass and clumping are not available at the virial radius). This virial mass can be estimated assuming a NFW profile with a fixed con-centration parameter c. Hereafter we used c = 5. WMAP has provided high precision data in a field where order of magni-tude estimations were the only possibility a few years ago. This allows us to constrain very tightly some quantities which are
often combinations of a few cosmological parameters. For the present analysis, we use the location of the so–called Doppler peak which allows us to establish a tight relation between Ωm
and h in a flat universe (Page et al. 2003). The above procedure has been applied to derive the mass temperature normalization
ATMas a function of Ωm. The result is shown in Figure 1. As
one can see the above procedure allows us to determine the value of ATMas a function of Ωmwith a small uncertainty : we
found ATM∼4.9Ω−0.75m ±10%, for 0.3 ≤ Ωm≤1.0; the values
cover the range of the various estimations based on the differ-ent approaches that we have mdiffer-entioned. From this relation we can now infer the typical temperature of clusters formed from fluctuations within R = 8h−1Mpc spheres:
T8h−1Mpc≈AT M(1.19Ωm)2/3 ≈ 3.65keVΩ−0.09m (4)
therefore, the amplitude of matter fluctuations σ8 is essen-tially controlled by the abundance of clusters with tempera-tures around 3.5 keV almost independently of the value Ωm
(this comes from the fact that AT M varies with Ωm and that
this variation accidentally compensates almost exactly the vari-ation obtained for a fixed value of AT M). Knowing the
mass-temperature relation and its uncertainty we can determine the amplitude of matter fluctuations by fitting the local tempera-ture distribution function and assuming a Γ-like spectrum with
Γ = 0.2 as explained in section 2.1.
The result is shown in Figure 2a. As one can see, at a given value of ΩM the amplitude of σ8 is well constrained. Furthermore to the first order the best σ8 is independent of ΩM(σ8 ∼ 0.63 ± 3.%(1σ) for ΩΛ = 0.7. Interestingly this is close to the value obtained by Viana et al. (2002): σ8 ∼0.61). Our conclusion appears somewhat surprising as it differs from standard analyses based on a fixed normalization AT M, which
cannot simultaneously account for the baryon fraction in a con-sistent way for arbitrary ΩM. Gas masses from the VFJ99
sam-ple present a moderate dispersion of the order of 20% (Sadat et al. 2005), implying rather small uncertainties on our gas frac-tion estimates of the order of about 4% at our working radii, which will produce an uncertainty on σ8of 2.5%. More impor-tant is the correction for clumping. For instance, Voevodkin & Vikhlinin (2004) have estimated σ8from the baryon mass func-tion in a Cold Dark Matter framework. In the case ΩM ∼ 0.3
their approach is very close to ours, but they used gas mass es-timation at the virial radius and did not correct for clumping. This leads to virial masses which are ∼ 20% lower than ours, leading to AT M ∼11 keV and therefore σ8∼0.7, in very good agreement with their estimation.
3. Need for Dark Matter
The amplitude of matter fluctuations is strongly constrained by the CMB data. In the following we use the constraint on σ8in a concordance model obtained from the CMB fluctuation anal-ysis including the temperature–polarization cross power spec-trum (TE) by the WMAP team (Kogut et al 2003).
The comparison of the value of σ8 from CMB data with the one from clusters reveales a critical discrepancy between the two measurements (Figure 2a). It is clear that within any model with ΩΛ ∼ 0.7 the amplitude of σ8 we derived from
4 Alain Blanchard and Marian Douspis: Evidence for new physics from clusters ?
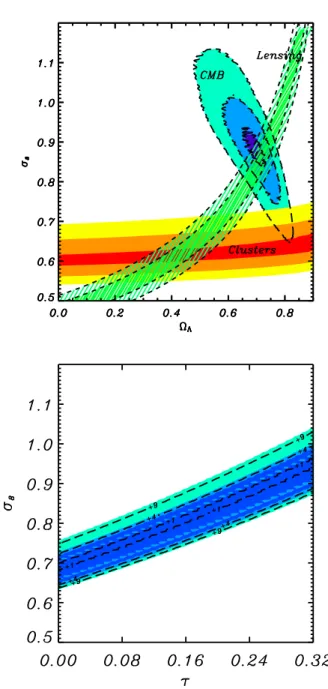
Fig. 3. a) top: The amplitude of matter fluctuations from
clus-ters abundance using the mass–temperature relation found in the present analysis compared to the amplitude of matter fluc-tuations derived from CMB data (Grainge et al 2003, Pearson et al. 2003, Ruhl et al. 2003, Kuo et al, 2004). The grey area corre-sponds to 1, 2, 3 σ contours on two parameters, dashed lines are contours on one parameter. The one and two sigma amplitudes obtained from an average of recent weak shear measurements are also shown as dashed regions (see text for references). b) bottom: amplitude of matter fluctuations from CMB data ver-sus optical thickness.
clusters, σ8 = 0.63 ± 0.02, is significantly smaller than what is expected from the CMB alone (σ8 = 0.88 ± 0.035), which is close to the recent determination from the combination of WMAP and the Lyman α forest (Seljak et al 2004).
The non-zero optical thickness τ, which is requested only from the TE spectrum, is a key factor in this discrepancy: the
high σ8obtained from CMB data depends critically on the ac-tual amplitude of the optical thickness τ (see Figure 2b), al-though forcing τ = 0 does not entirely remove the discrep-ancy. An accurate knowledge of τ is therefore critical to prop-erly evaluate the amplitude of matter fluctuations in the concor-dance model. One can see from Figure 2b how much the value of σ8 obtained from CMB data depends on the actual value of the optical thickness and remains the main source of uncer-tainty in establishing the value of σ8. We have also checked that when CMB data are restricted to the range 400 ≤ l ≤ 1200, the above discrepancy remains essentially unchanged. Allowing a non-power law initial power spectrum is therefore not expected to solve this issue.
Here above, we have considered models in which the dark matter is only made of cold dark matter, the dark energy be-ing a pure cosmological constant (in terms of the equation of state of vacuum p = wρ, this means w = −1), and that X-ray gas and known stars are the only existing baryons in clusters. A first possibility to investigate is to examine whether a different equation of state for the vacuum, so-called quintessence, might solve this discrepancy. We have therefore investigated flat mod-els with arbitrary w and quintessence content ΩQ. Indeed
com-binations of CMB and cluster data are known to provide tight constraints on such models (Douspis et al. 2003). With the ap-proach developed here, models which were found to match CMB and clusters were found to satisfy the following con-straints: 0.46 < ΩQ < 0.54 and −0.5 < w < −0.4. Such
models are currently at odds with constraints on quintessen-tial models (Douspis et al. 2003; Tegmark et al. 2003; Riess et al. 2004) resulting from the combination of various data in-cluding type Ia supernovae data. We therefore require an al-ternative approach to solve the above issue. In the following, we examine whether the introduction of an additional compo-nent of the dark matter content of the universe would remove the above discrepancy. Neutrinos are known to exist and to be massive, so perhaps the most natural massive component of the universe to be introduced is in the form of a neutrino contribu-tion. This solution has already been advocated to solve this dis-crepancy in an Einstein de Sitter Universe (Elgarøy & Lahav 2003, Blanchard et al. 2003). Indeed, the presence of a light, but non-zero, component of dark matter significantly modifies the transfer function of primordial fluctuations which results in a lower amplitude on small scales. Given existing measure-ments of mass differences we consider only the case where the masses are equal. Within a concordance model (ΩΛ = 0.7 Ωm = 0.3), by combining the constraints from CMB and
clus-ter data, and marginalizing on (ωb, H0, n, τ) we found that a contribution of Ων = 0.016 ± 0.003 is preferred with a sig-nificance level well above 3σ (see Figure 3a), improving the significance of such possible evidence compared to Allen et al. (2003). This confirms that the presence of a small contribu-tion of neutrinos, with a typical mass of .25 eV, to the density of the universe allows one to reconcile the amplitude of mat-ter fluctuations from clusmat-ters with the one inferred from CMB data. We notice that such a value is above the upper limit in-ferred by the WMAP team using a combination of several as-tronomical data (Spergel et al. 2003). Finally, weak shear esti-mations have provided measurements of the amplitude of
mat-ter fluctuations which can be compared to that obtained from clusters (Refregier 2003). There are some differences in pub-lished values which probably reflect systematic uncertainties not yet fully identified. However, taking the independent mea-surements of σ8 from weak lensing obtained from an average of recent measurements (Bacon et al. 2003, Brown et al. 2004, Chang et al. 2004, Hamana et al. 2003, Heymans et al. 2004, Hoekstra et al. 2002, Jarvis et al. 2003, Massey et al., 2004, Refregier et al. 2002, Rhodes et al. 2004, Van Waerbeke et al., 2004) which lead to an acceptable χ2, from WMAP and Lyman αforest (Seljak et al 2004), and the value of β from 2dFGRS (Hawkins et al. 2003), the low amplitude of σ8obtained above is not favored. We are therefore left with the conclusion that our initial assumption that baryons in clusters are fairly representa-tive of baryons in the universe is unlikely and therefore that the observed amount of baryons in clusters does not reflect the ac-tual primordial value (a possibility that has been advocated by Ettori 2003). Several mechanisms could lead to this situation: the most direct way could be the fact that a significant fraction of the baryons are in a dark form, either in the Universe or in clusters (for instance either in the form of Machos, or in a large gaseous unidentified component, Bonamente et al, 2003), or that a significant fraction of the baryons has been expelled from clusters during their formation process. In such cases, the ob-served Mbis biased to lower values. The actual mass of clusters
from Eq. 2 and Eq. 3 can then be obtained assuming a depletion factor 1 − f implying that f Ωbrepresents the missing baryons.
Again the combination of CMB and cluster constraints allows us to evaluate the amplitude of f Ωb. From Figure 3b, one can
see that such a component, f Ωb ∼ 0.023, should represent
nearly half (Υ ∼ 0.5) of the primordial baryons in order to solve the discrepancy. Although heating processes are required to account for the observed properties of X-ray clusters, they currently do not lead to such a high level of depletion (Bialek, Evrard & Mohr 2001).
4. Conclusions
The determination of the amplitude of matter fluctuations within pure cold dark matter model, using two methods, namely the CMB and the local cluster abundance, leads to two significantly different values. There are several ways to solve this discrepancy, although each represents a noticeable depar-ture from the standard concordance model. The existence of a non-baryonic dark component, like a neutrino contribution, would allow us to solve this discrepancy, although such a so-lution leads to a low value of σ8which is not favored by other evidence. If the actual value is larger, σ8 ∼0.8 − 0.9, the un-avoidable conclusion is that the baryonic content of clusters at
∆ ∼ 500 is not representative of the Universe. In this case, an
astrophysical solution could be that baryons in clusters could be in a dark form, or at least undetected until now. Alternatively, baryons in clusters could have been severely depleted implying that the actual value Υ is much smaller than the value we used above, the apparent baryon fraction being biased to low values compared to the actual primordial value. Finally, several obser-vations might help to clarify this issue: the above conclusion re-lies on the actual value of the optical depth τ found by WMAP.
Fig. 4. Constraints on Ωνand Ωdarkbaryonh2given by the
bined analysis of CMB and Cluster data. The dark energy com-ponent ΩΛhas been set to 0.7 in a flat cosmology.
If the actual value was consistent with zero most of the discrep-ancy would disappear. Confirmation of the actual value of τ is therefore critical and its better estimation will allow a better estimation of σ8 from the CMB. Other sources of information on σ8 will also obviously clarify this issue: weak lensing can potentially allow one to directly measure the actual amplitude of matter fluctuations with a similar precision to what has been obtained here with clusters, provided that systematic uncertain-ties are fully understood; the clusters masses could be mea-sured from their lensing signal providing a direct estimation of the normalization constant AT M, allowing one to distinguish
between low and high normalizations. Other direct measure-ments of the amplitude of matter fluctuations like those derived from the Lyman–α forest power spectrum (Croft et al. 1998)
6 Alain Blanchard and Marian Douspis: Evidence for new physics from clusters ?
could also help clarify this issue. It is remarkable that some of the observations that are expected in the near future can po-tentially bring fundamental information on clusters physics or alternatively may reveal the existence of a previously unidenti-fied type of dark matter with ΩDMas low as 0.01.
Acknowledgements. This research has made use of the X-ray cluster
database (BAX) which is operated by the Laboratoire d’Astrophysique de Toulouse-Tarbes (LATT), under contract with the Centre National d’Etudes Spatiales (CNES). We acknowledge useful comments from the referee which contributed improving the paper.
References
Allen, S. W., Schmidt, R. W. & Bridle, S. L. 2003, MNRAS 346, 593 Bacon, D., Massey, R., Refregier, A. & Ellis, R. 2003, MNRAS, 344,
673
Bialek, J. J., Evrard, A. E., & Mohr, J. J. 2001, ApJ, 555, 597 Blanchard, A., Sadat, R., Bartlett, J. G., & Le Dour, M. 2000, A&A,
362, 809
Blanchard, A., Douspis, M., Rowan-Robinson, M., & Sarkar, S. 2003, A&A 412, 35
Bonamente, M., Joy, M. K., & Lieu, R. 2003, ApJ 585, 722 Brown M., et al., 2003 MNRAS, 341, 100
Bryan, G.L. & Norman, M.L. 1998, ApJ 495, 80 Chang T.-C., et al. 2004, ApJ submitted, astroph/0408548
Croft, R.A.C. Weinberg, D.H., Katz, N., Hernquist, L. 1998, ApJ 495, 44
Del Popolo, A. 2003, ApJ, 599, 723
Douspis, M., Riazuelo, A., Zolnierowski, Y. & Blanchard, A. 2003, A&A 405, 409
Elgarøy, Ø. & Lahav, O. 2003, Journal of Cosmology and Astro-Particle Physics, 4, 4
Ettori, S. 2003, MNRAS 344, L13 Evrard, A. E., et al. 2002, ApJ 573, 7
Evrard, A.E., Metzler, C.A. & Navarro, J.F. 1996, ApJ 469, 494 Frenk, C.S, White, S.D.M et al., 1999, ApJ 525, 554
Grainge, K., et al. 2003, MNRAS 341, L23 Ikebe, Y. et al. 2002, A&A 383, 773 Hamana T., et al. 2003, ApJ, 597, 98 Hawkins, E., et al. 2003, MNRAS, 346, 78 Henry, J. P. 2004, ApJ 609, 603
Heymans C. et al., 2004, astroph/0411324
Hoekstra H., Yee H. & Gladders M. 2002, ApJ, 577, 595 Jarvis M., et al. 2003, ApJ, 125, 1014
Kirkman, D., Tytler, D., Suzuki, N., O’Meara, J. M. & Lubin, D. 2003, ApJS 149, 1
Kogut, A., et al. 2003, ApJS 148, 161 Kuo, C. L., et al. 2004, ApJ 600, 32
Massey, R., Refregier, A. Bacon, D. & Ellis, R. 2004, as-troph/0404195
Markevitch, A. 1998, ApJ 504, 27
Mathiesen, B., Evrard, A.E. & Mohr, J.J. 1999, ApJ 520, L21 Navarro, J.F., Frenk, C.S. & White, S.D.M. 1995, MNRAS 275, 720
(NFW)
Oukbir, J. & Blanchard A. 1992, A&A 262, L21 Page, L., et al. 2003, ApJS 148, 233
Pearson, T. J., et al. 2003, ApJ 591, 556
Pierpaoli, E., Borgani, S., Scott, D., & White, M. 2003, MNRAS, 342, 163
Pierpaoli, E., Scott, D., & White, M. 2001, MNRAS, 325, 77 Refregier, A. 2003, ARA&A 41, 645
Refregier A., Rhodes J., & Groth E. J., 2002, ApJL, 572, L131
Reiprich, T. H., & B¨ohringer, H. 2002, ApJ 567, 716 Riess, A.G. et al. 2004, ApJ 607, 665
Rhodes J., et al. 2004, ApJ, 605, 29
Roussel, H., Sadat, R. & Blanchard, A. 2000, A&A 361, 429 Ruhl, J. E., et al. 2003, ApJ 599, 786
Sadat, R., & Blanchard, A. 2001, A&A 371, 19 Sadat, R., et al. 2004, A&A, 424, 1097 Sadat, R. et al. 2005, A&A, submitted. Seljak, U. 2002, MNRAS 337, 769 Seljak, U. et al. 2004, astro-ph/0407372
Sheth, R. K. & Tormen, G. 1999, MNRAS 308, 119 Spergel, D. N. et al. 2003, ApJS, 148, 175
Tegmark, M. et al., 2004, astro-ph/0310723, Phys. Rev. D 69, 103501 Tytler, D. et al., 2004, astro-ph/0403688
Van Waerbeke, L., Mellier, Y., Hoekstra, H. 2004, A&A, 393, 369 Vauclair, S. C., et al. 2003, A&A, 412, L37
Viana, P. T. P., Nichol, R. C. & Liddle, A. R. 2002, ApJL 569, L75 Viana, P. T. P., Kay, S. T., Liddle, A. R., Muanwong, O., & Thomas,
P. A. 2003, MNRAS, 346, 319
Vikhlinin, A., Forman, W. & Jones, C. 1999, ApJ 525, 47 Voevodkin, A. & Vikhlinin, A. 2004, ApJ 601, 610
White, S.D.M., Navarro, J.F., Evrard, A.E. & Frenk, C. 1993, Nature 366, 429