UNIVERSITÉ DE MONTRÉAL
IMPLANTABLE ASYNCHRONOUS EPILEPTIC SEIZURE DETECTOR
MARJAN MIRZAEI
DÉPARTEMENT DE GÉNIE ÉLECTRIQUE ÉCOLE POLYTECHNIQUE DE MONTRÉAL
MÉMOIRE PRÉSENTÉ EN VUE DE L’OBTENTION DU DIPLÔME DE MAÎTRISE ÈS SCIENCES APPLIQUÉES
(GÉNIE ÉLECTRIQUE) MAI 2013
UNIVERSITÉ DE MONTRÉAL
ÉCOLE POLYTECHNIQUE DE MONTRÉAL
Ce mémoire intitulé:
IMPLANTABLE ASYNCHRONOUS EPILEPTIC SEIZURE DETECTOR
présenté par: MIRZAEI Marjan
en vue de l’obtention du diplôme de : Maîtrise ès sciences appliquées a été dûment accepté par le jury d’examen constitué de :
M. LANGLOIS Pierre, Ph.D., président
M. SAWAN Mohamad, Ph.D., membre et directeur de recherche M. YAHIA L'Hocine, Ph.D., membre
ACKNOWLEDGEMENTS
I would like to thank my advisor Professor Mohamad Sawan for his support, guidance, and encouragement during my M.A.Sc studies in Polytechnique Montréal. I would like to acknowledge the contribution of the project epileptologist Dr. Dang Khoa Nguyen in this research work. Special thanks to Mohamad Tariq Salam for his valuable discussion and advice along the way. I would like to acknowledge the support and technical advices of Mona Safi- Harb, Masood Karimian, Faycal Mounaim, and Guillaume Simard during the project research.
I would like to thank my office colleagues Nicolas, Jérôme, Bahareh, Marzieh, Ghazal, Mahya, Axelle, Geneviève, Étienne, Sébastien, and Jonathan who provided a friendly and pleasant atmosphere. I am also grateful to all faculty members and other colleagues of the group who helped me during my research.
I would like to thank the members of my committee, Drs. Pierre Langlois and L'Hocine Yahia for taking time to review my work. In addition, I am grateful the Natural Sciences and Engineering Research Council of Canada (NSERC) and Canada Research Chair in Smart Medical Devices for their support.
RÉSUMÉ
Plusieurs algorithmes de détection à faible consommation ont été proposés pour le traitement de l'épilepsie focale. La gestion de l'énergie dans ces microsystèmes est une question importante qui dépend principalement de la charge et de la décharge des capacités parasites des transistors et des courants de court-circuit pendant les commutations. Dans ce mémoire, un détecteur asynchrone de crise pour le traitement de l'épilepsie focale est présenté. Ce système fait partie d'un dispositif implantable intégré pour stopper la propagation de la crise. L'objectif de ce travail est de réduire la dissipation de puissance en évitant les transitions inutiles de signaux grâce à la technique du « clock tree » ; en conséquence, les transistors ne change nt pas d'état transitoire dans ce mode d'économie d'énergie (période de surveillance des EEG intracrâniens), sauf si un événement anormal est détecté.
Le dispositif intégré proposé comporte un bio-amplificateur en amont (front-end) à faible bruit, un processeur de signal numérique et un détecteur. Un délai variable et quatre détecteurs de fenêtres de tensions variables en parallèles sont utilisés pour extraire de l’information sur le déclenchement des crises. La sensibilité du détecteur est améliorée en optimisant les paramètres variables en fonction des activités de foyers épileptiques de chaque patient lors du début des crises.
Le détecteur de crises asynchrone proposé a été implémenté premièrement en tant que prototype sur un circuit imprimé circulaire, ensuite nous l’avons intégré sur une seule puce dans la technologie standard CMOS 0.13μ m. La puce fabriquée a été validée in vitro en utilisant un total de 34 enregistrements EEG intracrâniens avec la durée moyenne de chaque enregistrement de 1 min. Parmi ces jeux de données, 15 d’entre eux correspondaient à des enregistrements de crises, tandis que les 19 autres provenaient d’enregistrements variables de patients tels que de brèves crises électriques, des mouvements du corps et des variations durant le sommeil. Le système proposé a réalisé une performance de détection précise avec une sensibilité de 100% et 100% de spécificité pour ces 34 signaux icEEG enregistrés. Le délai de détection moyen était de 13,7 s après le début de la crise, bien avant l'apparition des manifestations cliniques, et une consommation d'énergie de 9 µW a été obtenue à partir d'essais expérimentaux.
ABSTRACT
Several power efficient detection algorithms have been proposed for treatment of focal epilepsy. Power management in these microsystems is an important issue which is mainly dependent on charging and discharging of the parasitic capacitances in transistors and short-circuit currents during switching. In this thesis, an asynchronous seizure detector for treatment of the focal epilepsy is presented. This system is part of an implantable integrated device to block the seizure progression. The objective of this work is reducing the power dissipation by avoiding the unnecessary signal transition and clock tree; as a result, transistors do not change their transient state in power saving mode (icEEG monitoring period) unless an abnormal event detected.
The proposed integrated device contains a low noise front-end bioamplifier, a digital signal processor and a detector. A variable time frame and four concurrent variable voltage window detectors are used to extract seizure onset information. The sensitivity of the detector is enhanced by optimizing the variable parameters based on specific electrographic seizure onset activities of each patient.
The proposed asynchronous seizure detector was first implemented as a prototype on a PCB and then integrated in standard 0.13 μm CMOS process. The fabricated chip was validated offline using a total of 34 intracranial EEG recordings with the average time duration of 1 min. 15 of these datasets corresponded to seizure activities while the remaining 19 signals were related to variable patient activities such as brief electrical seizures, body movement, and sleep patterns. The proposed system achieved an accurate detection performance with 100% sensitivity and 100 % specificity for these 34 recorded icEEG signals. The average detection delay was 13.7 s after seizure onset, well before the onset of the clinical manifestations. Finally, power consumption of the chip is 9 µW obtained from experimental tests.
TABLE OF CONTENTS
ACKNOWLEDGEMENTS ... III RÉSUMÉ... IV ABSTRACT ... V TABLE OF CONTENTS ... VI LIST OF TABLES ... IX LIST OF FIGURES... X INTRODUCTION... 1 Research objectives ... 1 Contributions ... 2 Thesis organization ... 2CHAPTER 1 AN INTRODUCTION TO EPILEPSY ... 4
1.1 Treatments of the epilepsy ... 4
1.2 Epilepsy and EEG recordings ... 5
1.3 Classification of the epileptic seizures ... 6
1.4 Brain waves ... 6
1.5 Epileptic states... 7
1.6 Evaluation of the seizure detector ... 9
CHAPTER 2 LITERATURE REVIEW... 10
2.1 Automated seizure detection methods... 10
2.1.1 Analysis of the ictal spikes ... 10
2.1.2 Analysis of the epileptic seizures ... 13
CHAPTER 3 A NOVEL ASYNCHRONOUS EPILEPTIC SEIZURE-ONSET DETECTOR
...23
3.1 Synchronous versus asynchronous epileptic seizure detector ... 23
3.2 Asynchronous epileptic seizure detection algorithm ... 23
3.3 Circuit implementation... 25
3.3.1 Prototype-based asynchronous seizure detector... 25
3.3.2 Micro-chip asynchronous seizure detector... 30
CHAPTER 4 CMOS-BASED ASYNCHRONOUS SEIZURE DETECTOR ... 37
4.1 ARTICLE 1 – A Fully- Asynchronous Low-Power Implantable Seizure Detector for Self- Triggering Treatment... 37
4.2 Introduction ... 38
4.3 Proposed system ... 41
4.3.1 Background works... 41
4.3.2 Detection algorithm ... 42
4.4 Implementation of the proposed algorithm ... 44
4.4.1 Bioamplifier stage ... 44
4.4.2 Filtering and gain stage ... 44
4.4.3 Differential difference amplifier ... 45
4.4.4 Seizure detector ... 46
4.5 Experimental and validation results ... 47
4.5.1 Circuit validation results ... 47
4.5.2 Patients description ... 49
4.5.3 Case study results ... 52
4.6 Conclusion... 58
CHAPTER 5 EXPERIMENTAL TESTS AND VALIDATION RESULTS ... 59
5.1 Experimental results of the PCB-based seizure detector ... 59
5.2 Post-layout simulation and experimental results of the chip ... 64
5.2.1 Post-layout simulation results ... 65
5.2.2 Experimental results ... 77
GENERAL DISCUSSION... 80
CONCLUSION AND FUTURE WORKS ... 82
LIST OF TABLES
Table 3.1: Comparison of the synchronous and asynchronous seizure detector ... 25
Table 3.2: The adjustable resistor determines the gain of A1 [92] ... 28
Table 3.3: Value of the parameters used in the design of the Sallen-Key filtering stage ... 29
Table 4.1: Measured features of fabricated asynchronous seizure detector ... 49
Table 4.2: Case study results of two patients... 54
Table 4.3: Comparison of synchronous and asynchronous seizure detectors ... 54
Table 4.4: Comparison of the latest low-power seizure detectors ... 57
Table 5.1: Measured features of the PCB-based seizure detector ... 59
Table 5.2: Different settings of the voltage window detector for Case 1 ... 60
Table 5.3: Detection performance of the PCB-based seizure detector for Case 1 ... 60
Table 5.4: Different settings of the voltage window detector for Case 2 ... 61
Table 5.5: Detection performance of the PCB-based seizure detector for Case 2 ... 61
Table 5.6: Different settings of the voltage window detector for Case 3 ... 62
Table 5.7: Detection performance of the PCB-based seizure detector for Case 3 ... 63
Table 5.8: Comparison of the average detection delay from PCB-based seizure detector and Matlab simulations [1] ... 64
Table 5.9: Power consumption of the ASD obtained from post- layout simulations ... 65
Table 5.10: Measured features of the ASD obtained from post-layout simulations ... 65
LIST OF FIGURES
Figure 1.1: Different placement of electrodes for recording EEG signals. Image obtained from
[4]. ... 5
Figure 2.1: Analysis and classification of the EEG recordings, adapted from [9]. ... 10
Figure 2.2: The feature extraction and classification are used in some of spike detection methods to improve the sensitivity. Feature extraction obtained from a moving-window observation then the classification stage is used to decide whether the extracted data is seizure or non-seizure activity. Figure is adapted from [12]. ... 12
Figure 2.3: The feature description of RNS and VNS devices available for seizure therapy, adapted from [75]. ... 20
Figure 3.1: Block diagram of the seizure detector, (a) The ge neral structures of the synchronous method in [84], and (b) The general structure of the proposed asynchronous method. ... 24
Figure 3.2: High- level diagram of the asynchronous seizure detector. ... 26
Figure 3.3: The top and bottom views of the discrete components based prototype including the internal and external coils for transferring time frame (Tf)... 26
Figure 3.4: The structure of the bioamplifier. ... 27
Figure 3.5: Magnitude plot of the Miller integrator, adapted from [93]. ... 29
Figure 3.6: The band-pass filter using Sallen-Key topology. ... 29
Figure 3.7: The analog and digital building blocks of the ASD. ... 30
Figure 3.8: The integrated design of the starter and bias circuit [94]. ... 31
Figure 3.9: (a) Block diagram of the bioamplifier, (b) Operational transconductance amplifier, and (c) Common mode feedback circuit. Adapted from [95]. ... 32
Figure 3.10: (a) Block diagram of the Gm-C low pass filter and (b) Schematic design of the common mode feedback circuit [96]. ... 33
Figure 3.11: Schematic of the switch used to provide test point between analog and digital stages of the ASD. ... 34
Figure 3.12: Schematic design of the XOR gate [97]. ... 35 Figure 3.13: Schematic diagram of the counter [98]. ... 35 Figure 3.14: Schematic diagram of the D flip- flop using NAND gates [99]. ... 36 Figure 4.1: A diagram showing the application of proposed ASD in a closed-loop seizure
detection and therapy. Seizure detector identifies the progress increase of low-voltage fast-activity at seizure onset and then triggers local therapy in order to abort seizure prior to clinical manifestations. ... 40 Figure 4.2: Background works on seizure detection and stimulation/inhibition: (a) Synchronous
seizure detection prototype made up of discrete components [103], (b) Asynchronous seizure detection prototype made up of discrete components [1], (c) Synchronous seizure detection microchip [99], (d) Two channels current stimulator [106], (e) Hybrid surface electrodes compatible for stimulation and drug delivery [1], and (f) Drug delivery system [1]. ... 42 Figure 4.3: Proposed integrated seizure detector: (a) Block diagram of the asynchronous system,
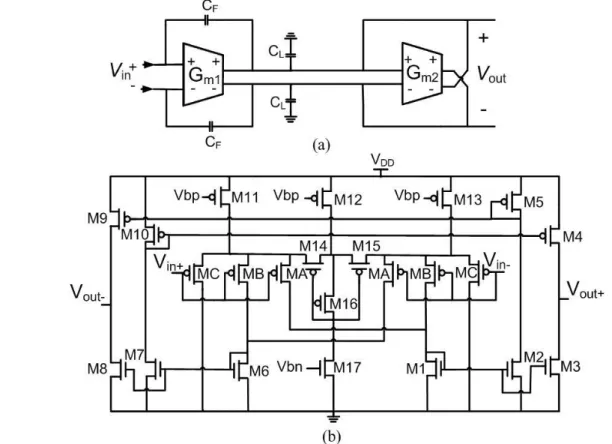
where Vin is the recorded icEEG signal in the input of the system, Va is the amplified signal in the output of the analog stage, VW,1-4 are the outputs of the voltage window detectors (VWDs), VD,1-4 are the outputs of the high- frequency detectors, and VD is the final output of the integrated ASD, (b) General structure of the bioamplifier stage [110]. ... 43 Figure 4.4: Schematic diagram of low-pass filter: (a) Gm-C low-pass filter, (b) Operational
transconductance amplifier (Gm1, Gm2) used to implement the filter. ... 45 Figure 4.5: Schematic diagram of differential difference amplifier: (a) Symbol of DDA where the
first port is used as an front-end op-amp and the second port consists of a voltage adder, (b) The circuit design of DDA. ... 46 Figure 4.6: Schematic diagram of voltage window detector, (b) Circuit design of comparator. ... 47 Figure 4.7: The proposed asynchronous seizure detector: (a) Layout of integra ted chip, and (b)
Photograph of the fabricated chip. ... 48 Figure 4.8: Measured results: (a) Gain and frequency response of analog building block, and
output of analog stage, VW1 is the output of first voltage window detector, Tf is the time frame, and VD is the output of first channel changing the state after counting 12 pulses. ... 48 Figure 4.9: The electrode implementation: (a)-(b) MRI and 3D reconstruction of the first patient,
and (c)-(d) MRI and 3D reconstruction of the second patient. ... 50 Figure 4.10: Device validation method: icEEG recorded from patients with medically refractory
epilepsy were used to test the proposed asynchronous seizure detector. ... 50 Figure 4.11: Seizure detection performance: (a) Analysis on training data Vin and determine
detection parameters (VT H/TL,1-4 and FSZ) setting from patients’ specific seizure patterns from the time-frequency and time-amplitude analysis, and (b) Decision boundaries formation using VT H/TL,1-4 and fSZ and test detection performance using other 5 seizures, 3 brief electrical seizures and 5 normal activities. ... 51 Figure 4.12: Validation of proposed ASD using a recorded seizure of case 1: Va is the amplified
signal at the output of analog stage, and VD is the seizure detection. The ASD detects seizure with almost 10 s delay that is 19.4 s before patient’s clinical manifestation. ... 53 Figure 4.13: Measured seizure onset detection of case2, where Va is the amplified icEEG signals
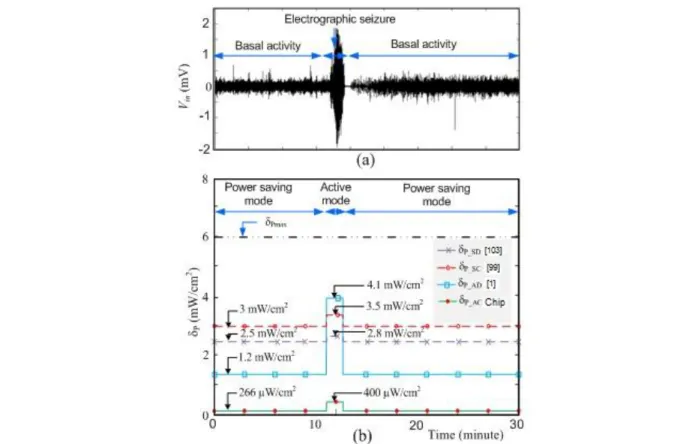
at output of analog stage and VD is the seizure detection output showing the non-related seizure activities are ignored and the epileptic seizures are detected by the proposed ASD. 53 Figure 4.14: Illustration of device operating modes based on the icEEG recording: (a) IcEEG
recording of an electrographic seizure and (b) average power consumption densities during power saving and active modes in synchronous devices [103], [99] and asynchronous devices [1] and chip... 55 Figure 4.15: Delay plot for Case 1 and Case 2 showing the measured detection delays from
seizure onset to the first detection alarm. ... 56 Figure 5.1: Total input referred noise of the ASD from Post- layout simulations. ... 66 Figure 5.2: Frequency and transient analysis of the first amplification stage obtained from
schematic and post-layout simulations. ... 66 Figure 5.3: Frequency and transient analysis of the Gm-C low-pass filter obtained from schematic
Figure 5.4: Frequency response showing the effect of the Vdd variation on DDA. ... 68
Figure 5.5: Transient analysis of the DDA from post- layout simulations. ... 68
Figure 5.6: Frequency and gain response of the analog building block. ... 69
Figure 5.7: Monte carlo simulation results of the analog building block for 100 runs. ... 69
Figure 5.8: (a) A recorded icEEG signal in the input of the ASD and (b) The amplified signal in the output of the analog building block. ... 70
Figure 5.9: Monte carlo simulation results (100 runs) of the stabilized analog stage using an icEEG signal of the epileptic patient ... 71
Figure 5.10: Monte carlo simulation results (100 runs) of the unstable analog stage using an icEEG signal of the epileptic patient ... 71
Figure 5.11: Output of the voltage window detector for threshold levels of 670 mV and 700 mV 72 Figure 5.12: Delay of the comparator to switch its output... 72
Figure 5.13: Output of the counter and logic gates which counts 12 pulses ... 73
Figure 5.14: Output of four channels of the asynchronous seizure detector using icEEG recording of an epileptic patient and variable threshold levels to extract seizure activities. ... 74
Figure 5.15: Validation of the proposed ASD by post- layout simulation of Case 1: Vin is the recorded icEEG signal, Va is the amplified signal in the output of the analog stage, VD is the final output of the ASD. ... 75
Figure 5.16: Validation of the proposed ASD by post- layout simulation of Case 2: Vin is the icEEG signal of the partial seizure, VW1 is the output of the first voltage window detector, and VD is the final output of the ASD. ... 76
Figure 5.17: Test-bench setup to test fabricated ASD ... 78
Figure 5.18: Vin is a sine wave (F=30 Hz) used as the input of the ASD and Va is the output of the analog stage ... 78
Figure 5.19: 3-dB low-pass cut off frequency of the filter ... 79
LIST OF ABBREVIATIONS
ANNs ASD CMFB CHUM DBS DFF DDA DAC EEG ECOG EMU EEC EEG-FMRI FN FP FDA HFD ICA IEI IcEEG SPECT MEG MRIArtificial Neural Networks Asynchronous Seizure Detector Common-Mode Feedback
Centre Hospitalier De l’Université De Montréal Deep Brain Stimulation
D Flip Flop
Differential Difference Amplifier Digital to Analog Converter Electroencephalogram Electrocorticogram
Epilepsy Monitoring Unit Earliest Electrographic Change EEG-Functional MRI
False Negative False Positive
Food and Drug Administration High Frequency Detector
Independent Component Analysis Inter Event Intervals
Intracerebral EEG
Single Photon Emission Computed Tomography Magnetoencephalographic
NSERC OTA PCB PET RNS FSZ TN TP Tf UCO UEO VNS VWD
Natural Sciences and Engineering Research Council of Canada Operational Transconductance Amplifier
Printed Circuit Board
Positron Emission Tomography Responsive Neurostimulator Seizure Onset Frequency True Negative
True Positive Time Frame
Unequivocal Clinical Onset Unequivocal Electrographic Onset Vagus Nerve Stimulator
INTRODUCTION
Many methods are investigated for treatment of the refractory patients who suffer from focal epilepsy. Deep brain stimulation (DBS) for Parkinson and vagus nerve stimulation (VNS) for epilepsy disease are the examples of the open loop seizure therapies. In these techniques, the electrical stimulation is applied to deep brain (DBS therapy) or to extracranial vagus nerve (VNS therapy). Commercially available VNS are implantable devices that provide scheduled stimulation at predetermined time intervals to reduce seizure frequency. However, only 30 to 40% of the patients have attenuation in seizure frequency and usually seizure freedom is rare. In contrast to these open-loop systems, the closed- loop devices (detection and treatment) provide seizure alarms prior to clinical manifestations and further triggers focal treatment in order to abort seizures at their onset. Local therapy, such as automa tically cooling, injecting fast-acting drug, or using electrical stimulation can be used by closed- loop systems at certain necessary times. This may increase the efficiency and safety of these systems compared to open- loop devices due to effectively use of therapy and reduce the amount of the medications. To do so, it is necessary to have a reliable seizure detection algorithm that can be implemented in an integrated circuit and perform effectively.
Research objectives
Recently, several methods for detecting seizures have been published. These works usually suffer from some limitations addressed below.
The algorithms suffer from high complexity or power consumption that makes it harder to implement them in an integrated circuit.
Seizure detection is not accurate or it is required to tune a large number of variable parameters to detect seizure precisely.
Seizure detection is not early enough before clinical manifestation.
The great progress of technologies let us overcome these limitations and propose new applicable methods for better detection of the epilepsy. The objectives of this thesis are addressed below.
Propose a new asynchronous seizure detector that is part of an implantable integrated device intended to identify onset seizure and trigger focal treatment to block seizure progression.
Provide a count-based detection algorithm to minimize the false recognition of the unrelated seizure activities.
Obtain a reliable detection delay prior to seizure emergence, which provides sufficient time for preparing proper medications.
Consider the system's complexity as well as power consumption, and sensitivity.
Contributions
The algorithm of the asynchronous seizure detector is verified by using discrete components on a printed circuit board (PCB). The performa nce of the device was tested using EEG signals recorded from 7 patients with different electrical seizures [1].
To improve the power consumption, noise, and performance of the system, the seizure detector is implemented in an integrated CMOS chip. Post-layout simulation and validation results had promise of the proper detection [2]. The experimental tests on two samples of the microchip are done by using various signals recorded from two epileptic patients that also corresponded to post-layout simulations and approved the performance of the microchip [3].
Thesis organization
This thesis is organized as follows. In chapter 1, brief description of the epileptic seizures and some background information on electroencephalogram (EEG) signals are provided. An introduction of the basic theories, problems, and criteria of the epilepsy therapy are discussed. Chapter 2 provides literature review of the related seizure detection systems. The design issues and criteria of the implantable devices such as power consumption, complexity, and reliability are discussed. The factors limiting and improving the performance of the epileptic seizure detectors are highlighted.
In chapter 3, we present an asynchronous algorithm to reduce the total power consumption o f the system. Also presented here are the design and implementation of the asynchronous seizure detector on discrete component circuit board and the integrated microchip in 0.13 µm CMOS process.
Chapter 4 outlines experimental tests and case study results of the microchip. Results are discussed and compared to other methods of the seizure detections. Also, the optimized features,
patient-specific detection criteria, and power consumption are highlighted in the design of the microchip. These results demonstrate the efficiency of the proposed system using the EEG signals of 2 epileptic patients including the normal neural signals and epileptic seizure activities. Chapter 5 provides the results of the asynchronous seizure detector that was implemented on PCB as well as post-layout simulation and validation results of the asynchronous seizure detector integrated in 0.13 µm CMOS process.
CHAPTER 1
AN INTRODUCTION TO EPILEPSY
About 50 million people suffer from epilepsy which is approximately 0.75% of the world population. Epilepsy is a neurological disorder characterized by a tendency to unprovoked recurrent seizure. A seizure is the violent disturbance of the cerebral electrical activity due to abnormal discharge of the cortical neurons in the brain. Epileptic seizure can occur equally in both males and females but usually very young and elderly people experience it more than other population. Several causes may provoke epilepsy, such as genetic abnormalities, tumors, head injury, central brain infection, and ischemia. Epileptic seizures may be recognized by clinical symptoms like shaking of the body, disability of the motor functions, loss of the consciousness, teeth clenching and other behavio ural changes followed by excessive fatigue. Based on these clinical manifestations and the EEG recordings of the patients, physicians are able to evaluate and analyze the epileptic seizures.
1.1
Treatments of the epilepsy
The most common treatment of the epilepsy is antiepileptic drug but this therapy is not useful for one-third (30%) of the epileptic patients who are drug resistant. Furthermore, some patients whose epilepsy is treated by these anticonvulsant medications are suffering from system side effects such as depression and behavioral changes [4].
Epilepsy surgery is another common treatment for the drug resistant (refractory) patients to remove the epileptogenic area. An accurate localization and identification of the epileptogenic zone increases the success of the surgery. However, the patients who have multifocal epilepsy or have the risk of the surgery with permanent sequelae or loss of the functionalities cannot benefit from this therapy.
In spite of all these available therapies, there are some pat ients with focal epilepsy who suffer from untreatable seizures. Since the electrical seizures are unpredictable, they may damage the patient's lives and put them in dangerous situations (e.g. when driving a car). Therefore providing a reliable method to diagnose and detect seizures prior to clinical manifestation could significantly improve the quality of these epileptic patient lives. Such a predictive device can provide some time to release fast acting medications in order to suppress the seizure before a ny clinical symptoms.
1.2 Epilepsy and EEG recordings
The electroencephalogram (EEG) signals are the electrical activities recorded from brain. Either the scalp EEG (signals from surface of the head) and invasive EEG (signals from brain) are used to diagnose epilepsy. Scalp EEG signals contain physiological artifacts which may combine with environmental interfaces. The physiological artifacts originated from body activities such as tongue movement, arms movement, or eye blinking while the environmental artifact comes from electrode movements, power line interfaces, etc. Whereas scalp EEG is used to diagnose the region of the seizure activities from surface of the head, the invasive techniques are required to record potential changes occurred inside the brain. Hence, the invasive approaches have the advantage of placing subdural or depth electrodes directly on the brain to overcome the noise that could be recorded by scalp electrodes.
EEG signals are used to localize seizures before epilepsy surgery or analyze brain activities to indicate seizure emergence. Depending on the electrode location (Fig. 1.1), different types of the EEG signals are introduced such as electrocorticogram (ECoG), depth EEG, and scalp EEG. These methods are described below [4].
Scalp EEG is the recorded signals from the surface of the head.
ECoG signals are the recorded activities from cortex using subdural grid or strip electrodes.
Figure 1.1: Different placement of electrodes for recording EEG signals. Image obtained from [4].
Depth EEG is the recorded signals of the brain using penetrating electrodes.
Since a seizure is unpredictable and may occur from seconds to minutes, patients must be under long-term EEG monitoring to collect various data of the brain including normal neural activities and multiple seizures. The normal brain signals are recognized by rhythmic activities in specific frequency ranges while seizures are described in terms of variable frequency, phase and amplitude activities. Recording these signals helps neurologists to analyze different patterns of the EEG signals and improve the diagnoses and treatment of the epilepsy. Video monitoring is used in addition to EEG recordings to provide the behavioural reaction of the patient in order to have a better evaluation of the seizure activities.
This work focuses on the design of an effective seizure detector to assist physician in such a challenging task.
1.3 Classification of the epileptic seizures
An epileptic seizure is recognized by abnormal discharge of cortical neurons in brain that may lead to signs or symptoms. The epileptic seizures are identified by brain EEG recordings and can be categorized into two main groups, focal (partial) and generalized seizures.
Focal seizure
Focal seizures occur in the brain locally and are diagnosed by a few channels of the EEG recording. The focal seizure is simple partial if it affects a small area of the brain without loss of consciousness. Otherwise, it is known as complex partial seizure that causes loss of consciousness in patients.
Generalized seizure
The generalized seizures affect both hemispheres of the brain and are diagnosed by many channels of the EEG recording. This type of the seizure often causes loss of consciousness.
1.4 Brain waves
EEG signals are classified in four main categories in terms of the most frequency bands of the brain activities that are described below [5].
The lowest frequencies in the brain are categorized as delta wave (0 - 4 Hz). These signals usually have highest amplitude and occur when high focus and attention is required. Delta rhythm is also the dominant wave during deep sleep states.
Theta rhythm
The slow rhythm of the brain in frequency range of 4 - 8 Hz is categorized as theta wave. These signals are the dominant waves during the sleep of children up to 13 years. Theta waves are usually found during behavioural activations, pain, emotions, and creative states.
Alpha rhythm
The brain signals in the frequency range of 8 - 13 Hz are categorized as alpha wave. These signals are found in normal adults and usually are associated with states reflecting mental resourcefulness, sense of relaxation, a nd conscious mind. The alpha waves are usually found in the posterior region of the head during resting or eyes closed while excitement or eyes opened will stop these signals.
Beta rhythm
The fast brain activities in the frequency ranges above 13 Hz are recognized as beta wave. These signals are recorded from frontal region of the brain. The people who are alert, apprehensive, and busy usually have the symmetrical distribution of the beta waves on both sides of their brain.
1.5 Epileptic states
A continuous interval of the EEG recording is called a segment or epoch. In a broad classification, ictal EEG refers to the segments of the EEG with seizure activity while the rest of the EEG is named interictal EEG. The different states of the EEG signals are described below.
Interictal state
Interictal state indicates normal resting cond ition with no seizure activity. Some EEG recordings may contain irregular neural activities which are not seizures. But these abnormalities are known as subclinical seizures and can be useful to diagnose epileptic condition.
Preictal state
Preictal state refers to the time prior to a seizure that doesn't show the normal state of the brain. Researchers discuss the presence of this state that helps seizure prediction [6]. The preictal state
indicates an upcoming seizure in a certain period of time that can occur from few minutes to hours before seizure onset [7]. Onset of the clinical seizure is characterized by sudden change in amplitude or frequency of the neural signals at the transient time between interictal and preictal states [8].
Ictal state
Ictal state refers to the time that EEG recordings show abnormal activity of the brain such as significant change in frequency and amplitude. The transition period from preictal to ictal state may be different depending on patient and type of the epilepsy. During the ictal state, EEG patterns become unpredictable and some symptoms such as teeth clenching, loss of consciousness, shaking of the body, eye rolling towards back of the head, and facia l twitches are very common during this period.
Postictal state
Postictal state refers to the time following a seizure which represents the recovery period of the patient. The required time for transition from ictal to postictal state depends on the severity of the seizure and may last few seconds or hours. The postictal dysfunctions are prevalent during this state and disturbances are a consequence of the focal or generalized neurological shortage. Behavioural reactions including poor memory, low attentio n, and concentration, postictal migraine headaches, and decreased verbal skills are very common. Patients are usually unaware of their seizure but an epileptic patient, who had this situation several times, is able to realize these symptoms.
The additional terms described by epileptologists are unequivocal clinical onset (UCO), unequivocal electrographic onset (UEO), and earliest electrographic change (EEC) [8].
Unequivocal clinical onset
The earliest time that seizure is recognized clearly by visual or clinical observing a patient is called UCO.
Unequivocal electrographic onset
Proving the EEG signals, the earliest time that it is evident a seizure occurs without prior knowledge if seizure follows is known as UEO.
The earliest time that it is evident a seizure occurs with prior knowledge that a seizure follows, is known as EEC.
1.6 Evaluation of the seizure detector
To characterize and evaluate the performance of the seizure detector, the following parameters must be declared.
True Negative (TN)
True negative shows that the output of the seizure detector declares the normal activity of the brain in a time interval and that interval demonstrates no seizure activity.
False Negative (FN)
False negative shows that the output of the seizure detector declares normal activity of the brain in a time interval while that interval includes seizure activity.
True Positive (TP)
True positive shows that the output of the seizure detector declares seizure activity in a time interval and that interval demonstrates a seizure activity.
False Positive (FP)
False positive shows that the output of the seizure detector declares seizure activity of the brain in a time interval but that interval demonstrates no ictal activity.
Sensitivity
This parameter is calculated by Eq. (1.1). It demonstrates the ability of the seizure detector to detect true positive ratio as the diagnosis of the expert neurologists.
% 100 FN TP TP y Sensitivit (1.1) Specificity
This parameter is calculated by Eq. (1.2). It demonstrates the ability of the seizure detector to detect true negative ratio as the diagnosis of the expert neurologists. The goal of the researchers is designing a seizure detector that exhibits maximum sensitivity and specificity.
% 100 FP TN TN y Specificit (1.2)
CHAPTER 2
LITERATURE REVIEW
2.1 Automated seizure detection methods
In the early 1970s, the analysis of the EEG recordings began to assist the diagnosis and treatment of the epilepsy. As it is shown in Fig. 2.1, these methods can be classified in two main directions; (a) analysis of the ictal spikes and (b) analysis of the epileptic seizures which are described below.
Figure 2.1: Analysis and classification of the EEG recordings, adapted from [9].
2.1.1 Analysis of the ictal spikes
Since epileptic spikes happen more frequently than seizures, several researchers have proposed methods to detect and classify spike activities. Moreover, a better diagnosis of the epileptic spike zones helps surgeons to remove the source of the frequent interictal spikes that are linked to the epileptic seizures [10, 11].
The most common methods for spike detection are [12]:
Mimetic techniques
In this traditional technique, the slope, duration, and amplitude attributes of the spikes are analyzed and compared with provided values of the neurophysiologists [13, 14]. In 1985
Faure [15] proposed a new method where the EEG waveforms were decomposed into two half waves and classified based on distinctive attributes of the half signals.
Morphological analyses methods
These methods used the structural features of spike to characterize the raw EEG waveforms into several physical parts. Pon et al. introduced mathematical morphology to detect spikes [16]. In [17], Xu et al. proposed a morphological filter to separate the background activity from spikes components.
Independent component analysis (ICA) methods
This approach is used to isolate spikes from EEG data [18, 19]. In this method, the abnormal spike activities are selected visually and analyzed by neurologists. A multidimensional ICA analysis to define a mixing matrix, which corresponds to epileptic components, was proposed in [20].
Artificial neural networks
In the artificial neural networks (ANNs) either raw data or select features are used to simulate the behaviour of the neurons and detect spikes [21, 22]. Selecting features are based on two approaches, (a) waveform features and (b) context features. The characteristics obtained from duration, sharpness, and amplitude of the spike are known as waveform features while the characteristics obtained from EEG activity surrounding the spikes (EEG variance and baseline crossings) are known as context features.
In the spike detection methods, there is a trade-off between sensitivity and selectivity. This means providing a suitable approach to obtain all spikes usually comes with a large number of the false detections [23, 24]. O n the other hand, proposing systems with low false detection rate are usually accompanied by low sensitivity and loss of the seizures. Since the false detections can be checked and analyzed by neurophysiologists, it is preferable for researchers to increase the sensitivity of the system.
Despite the proposed techniques that use features extraction and classification stages to detect inter- ictal spikes (Fig. 2.2), few methods proposed that a spike enhancement stage can be used prior to the spike detection stage [25, 26, 27]. These methods have the same point of view of (a) using spike enhancement stage to attenuate the background events and leave the EEG waveforms from the rest of the data and (b) providing spike detection stage to analyze the waveforms and
classified them as spikes or non-spikes events. In these methods the spikes, artifacts, and background events are enhanced to increase sensitivity and minimize the missed data. Based on the enhancement strategy, the spike detector can be classified in three categories [12]:
Time domain approaches [28, 29]
Transform domain techniques [30]
Signal modeling methods [31, 32]
In the following, some of the recent and remarkable methods for spike detection are explained with more details [33].
In [34], an algorithm is introduced based on detecting the amplitude of the spikes data. This method consists of four channels spike sorting classifier. In this method, the spikes are categorized in the same class if their peak amplitude was in a specific predefined interval. Due to the signal to noise ratio and variation of the spike waveforms, the windowing-based methods exhibit a better performance compared to template matching classifiers [33].
In [35], Chandra et al. introduced a clustering based algorithm to detect spike activities. This
Figure 2.2: The feature extraction and classification are used in some of spike detection methods to improve the sensitivity. Feature extraction obtained from a moving-window observation then the classification stage is used to decide whether the extracted data is seizure or non-seizure activity. Figure is adapted from [12].
method is based on comparing the amplitude of the spikes with a predefined threshold level. When spikes pass this positive or negative threshold, the system detects abnormal spike activities. The detected spikes are clustered together and sorted as initial clusters, and then the best clusters are chosen to provide noise-free templates. In this algorithm, the selection of the clusters depends on some parameters such as inter-distance and sensitivity of the clusters. This method is performed on simulated data.
In [36], a seizure detector is introduced using manual sort of the data. This study exhibited some difficulties for manual spike sorting specially on multi-channel data and illustrated the importance of a robust spike sorting detector.
Kaneko et al. proposed a spike detector based on template matching classifier [37]. This method provided a better sorting result due to tracking the amplitude-change of the spikes. The amplitude variation of the waveforms provides spike-amplitude vectors and every vector allocated to a cluster. The clusters are combined and tracked which resulted in better analysis of the multi-channel data.
Wolf et al. introduced a method for spike detection assuming neuron activities provide spike waveforms [38]. It is supposed that some neurons generate a mixture model but generally, the feature of the waveforms is changed based on a probability distribution. In this approach, the action potential of the neurons are tracked and arranged from multi-channel recordings. The long recordings are divided to short intervals and the detected spikes are clustered using the Gaussian mixture model. The study reports a better clustering and tracking performance compared to other traditional approaches [33].
In[39], Chan et al. introduced a template-matching based spike detector. In this method, it is not required to have a complete prior knowledge of the recording to extract the template. Data sorting depends on wavelet coefficient and spike alignment. Wavelet coefficients are used as vector and by using significant vectors near alignment points, the spike sorting is enhanced.
2.1.2 Analysis of the epileptic seizures
The seizure onset detectors use the feature of the onset in order to detect epileptic seizure. Since this method may cause false detection, some researchers introduced the algorithms for seizure pattern detection, which may reduce the false alarms but increases the detection delay. Recently,
the epileptic seizure prediction methods are interested for researchers since detecting seizure activities prior to clinical manifestation could warn patients and moreover provide the release of the medication in order to suppress seizure activities. Therefore, the automatic pre-seizure detector must exhibit high sensitivity and low false alarms.
So far, many algorithms for epileptic seizure detection are introduced. These algorithms usually are based on classical signal processing methods, which detect different patterns of the seizure activities [40]. The selection of the features could be based on waveform or morphological parameters such as amplitude, frequency, and shape of the waveforms or time domain features like nonlinear characteristics, statistical features, and correlation dimension [12].
Fast Fourier transform based [41], wavelet based [42, 43, 44], frequency based [45, 46, 47] and time- frequency based features [48] also were used for rhythmic discharges. Genetic programming is another method to detect epileptic seizure, which is not based on physiological features [49]. Once the feature of the EEG signal was extracted, it is required to analyze whether the EEG signal is related to a seizure or non-seizure activity. In literature, different methods have been proposed such as logistic regression [50], linear classifiers [51, 52], Gaussian mixture model [53], etc.
A general classifying of the automated seizure detector is based on the age group of the patients, which is categorized to adult seizure detection and newborn (neonate) seizure detection. The detection for neonate is different from adults due to slower discharge of the cortical neurons (down to 0.5 Hz) and gradual seizure onset, which can last couple of minutes [12]. In another classification, the automated seizure detectors may be used for each patient (patient-specific system) or be optimized as generic (non-patient-specific system) which are described below [4].
2.1.2.1 Generic seizure detection
Pauri et al. introduced a seizure detection system and evaluated it by using the EEG signals of twelve patients that were under video monitoring [54]. The system was adjusted with severa l settings and showed the best sensitivity of 81.4 %. Results demonstrated that tunable detection thresholds are required to improve the performance of their system.
In [55], a system that detects seizures based on half wave amplitude features is proposed. In this method, seizures were detected when the defined features passed the detection thresholds. The
improved method [56] provided better detection of the low amplitude seizures and exhibited lower false detections due to increasing the distance between the background and seizure activities. The system performed sensitivity in the range of 70 - 80%.
Harding introduced a seizure detector using the magnitude difference of the samples and time difference of the large spikes. The number of the high amplitude events was counted in 5 s time periods and if the counter passed a defined level, seizure was detected. This method was tested on 40 patients and exhibited a sensitivity of 92.6 % [57].
In [58], Osorio et al. introduced a seizure detector where the EEG signals in the frequency range between 5 and 50 Hz were filtered. The system was based on a real-time detection method and exhibits short detection delay with 100 % sensitivity and no false positive alarms. Although the authors mentioned that, the seizure detector is not for a patient-specific application but it seems the patients with mesial temporal seizure could have benefit of this method [33].
Khan et al. introduced a multichannel seizure detector that divided the EEG signals in frequency bands. For each band, the features of the signal are obtained and applied to decision stage. This method used for 11 patients and exhibited a sensitivity of 85.6 % [59]. In [60] an improved method is presented which used a tunable threshold and provided a trade-off between false alarm detection and sensitivity of the detector. In the improved system, the feature vector is composed of five features obtained from each frequency band and then applied to decision stage. Results showed sensitivity of 86.4 %.
Iasemidis introduced a seizure detector based on neural network [61]. Futures in addition to a set of spatial information provide the neural network rules. In this method, The EEG signals are decomposed and analyzed in time and frequency domains. The system is tested on EEG signals for 1046 hours and showed a sensitivity of 76%. This method is accepted to be used in the epilepsy monitoring unit (EMU) [33].
Navakatikyan et al. introduced a neonate seizure detector [62]. The algorithm is based on waveform morphology where the amplitude and shape of the EEG signals are used for feature extraction. EEG waveforms decomposed in two half waves, the negative and positive half waves which defined as trough-wave and peak-wave, respectively. The average of two sequent half waves is compared with a threshold level in order to define the increase of the EEG waveforms and detect seizure. The validation results on 55 neonate signals showed sensitivity between 83
and 95 % and suggested a better performance for morphological-based methods compared to other popular features for classification.
Arabi et al. introduced an algorithm to analyze data from depth EEG recordings. This seizure detector composed of the individual channels and seizure was detected in each channel using rule-based classifier. The detection of the individual channels was combined to provide the final detection. Validation results on 21 patients exhibited a sensitivity of 98.7 % [63]. To be noted is that detecting clinical seizures was the target of this work while all short seizures and other abnormal activities, which don’t lead to clinical manifestation, are not excluded in this method [33].
Duun-Henriksen et al. introduced a method to detect seizure based on wavelet feature of the signals. This method used few recording cha nnels for detection. The first step is selecting the channels, which provide analyses of the features. The next step is using support vector classifier in order to detect seizure [64]. The EEG signals of 10 patients are used to evaluate the performance of the seizure detector, which demonstrated minimum improvement in sensitivity. Moreover, the focal and subclinical seizures are not used to determine the performance of this study, which cannot claim its generic application for all types of the seizures [4].
Majumdar and Vardhan introduced a seizure detector using waveform features [65]. This method is based on window variation detector, which diagnoses the abnormal activities of depth EEG recording. Validation results on 15 patients exhibited a sensitivity of 91.5 % but subclinical seizures are not included in this study.
2.1.2.2 Patient-specific seizure detection
Que and Gotman proposed a method based on template matching approach to provide patient-specific seizure detection. In this approach, the onset and a large background data prior to the seizure signals are selected and used to train a modified nearest-neighbor classifier. The template seizure patterns and background EEG data are selected manually and a complex classifier is used for seizure detection [66]. Note that this study introduced the new concept of the patient-specific seizure detection.
Wendling et al. introduced a method for detecting seizures. This system provided segments of the EEG signals and then characterized these segments in order to extract the similar data between
observations [67]. The seizure detector is evaluated on depth EEG signals of the medically refractory patients who have partial seizures. The authors claimed that this study is useful to have a better understanding of the epileptogenic networks [68], [69].
Shoeb et al. presented a method based on morphological information of the EEG signals. The multichannel seizure detector comprised of the feature vector and support vector machine classifier. The classifier is trained based on prior knowledge of 2 - 4 seizures and non-seizure EEG signals in order to diagnose epileptic seizures during recording. A remote computer is used for classification to reduce the power consumption of the device and improve the battery life [70]. The authors claimed that the computational cost is reduced due to the remote classifier. However, designing such a seizure detector with an external remote system as a classifier could not be a practical method [4]. In comparison with other patient-specific seizure detectors that required a single template seizure pattern, this study used more seizure patterns to train the remote classifier. The validation results of this method on scalp EEG signals of 36 patients exhibited a sensitivity of 94 %.
Wilson introduced a patient-specific seizure detector. This system used a classifier that required a single seizure pattern for training. A learning algorithm proposed for improving the errors of the classifier [71], [72]. Although training the classifier is based on minimum sample data, but it required long background data that is extracted from the end of the preceding seizure to the start of the next seizure and this limited the application of this method.
Shi et al. introduced a patient-specific seizure detector based on prior knowledge of a single seizure data. This method used sinusoidal wavelet function to provide the template seizure. Validation results on two patients resulted in a sensitivity of 100 % and no false alarm was detected in this study [73]. However, the seizure detector is not an automated system. Moreover, a few data is used to evaluate this method while the practical systems provide an automated detection on large dataset of the EEG recording.
Zandi et al. introduced a seizure detector using the scalp EEG recording of 14 patients [74]. This method is using a large background and providing a moving window with 2 s time frame to analyze the EEG signals. The seizure and non-seizure patterns are recognized based on the energy density function. The energy of the individual channels in addition to multichannel information is used to diagnose the epileptic seizures. This study exhibited 90.5 % sensitivity,
however this method suffers from the non-automated seizure detection, and it is not a practical seizure detector due to selecting specific type of the seizure that is limited to temporal lobe epilepsy [33].
2.2 Implantable devices for seizure therapy
Epileptic patients with refractory to antiepileptic drugs are good candidates for surgical operation. Since this therapy is not useful for multifocal epileptic patients and can cause some permanent sequelae near eloquent areas, other supplemental treatments are required. In recent years, there was a growing interest to introduce algorithms for treatment of the epilepsy. Some of these algorithms aimed to be implantable on microelectronic devices.
Vagus nerve stimulator (VNS) is the only implantable device accepted for FDA (Food and Drug Administration) for treatment of the epileptic seizures [75]. This device is composed of an implantable stimulator, an external pulse programmer, and two bipolar electrodes, which provide a non-responsive (open loop) therapy. The stimulator is implantable under the skin of the left chest and the lead is delivered to neck. The bipolar electrodes are used near the vagus nerve. Once the stimulator is implemented in the body of the patient, the programmer can turn on the device, which stimulates the vagus nerve directly to attenuate the duration and severity of the seizure. This open loop therap y provides the electrical stimulation at a predetermined time intervals [76]. The stimulator is usually set for frequency range of 20 - 30 Hz, time on and time off around 250 - 500 µs [75]. This method doesn't need the exact definition of the epileptogenic area of brain. However, it reduces the seizure frequency only in 30 - 40 % of the epileptic patients [77].
Recently, the closed loop therapies (detect and treatment) are in the interest of researchers, these devices detect epileptic seizure before evalua ting into clinical manifestations and then trigger therapy to stop seizure activities. As a result, less medication is required, which reduces the side effects on the patients. In general, a responsive (closed- loop) device is composed of two main parts; the seizure detector and seizure controller. The methods that could be used to control and suppress the seizure are:
Electrical stimulation
Drug release
High- frequency electrical stimulation can be used in a responsive device to stop seizure activit ies. It is important to provide a limited charge density in order to prevent human tissue damages. Focal drug delivery is another approach to block seizure activities in a responsive device. This therapy may improve the effects of the drugs and reduce the system side effects due to limiting the drug releases only onto epileptogenic areas. However, the delivery system and refilling procedure is another concern in this method [75]. The other method used in a closed- loop device to stop seizure is focal cooling. After detecting seizure onset, the area of the brain that shows a rise in temperature is recognised by sensors. Then subdural grid electrodes that co ntain integrated micro-tubes are used in order to provide water circulation. The cooling therapy affects the magnitude of the neuronal action and as a result, reduces the potential of the upcoming abnormal electrical activities [75]. This method has the advantage of reducing the brain damages and prevents the disturbance of the normal brain activities. However, the cooling system and the efficiency to release seizure are the concerns of these seizure therapy methods.
Responsive Neurostimulator (RNS) is a n implantable device for treatment of the epilepsy. This device is useful on patients with both simple and complex focal seizure. The device is composed of the internal and external parts. The internal part contains the implantable neurostimulator and intracranial electrodes while the external part is composed of the telemetry interface, programmer, and laptop computer [75]. Physicians use the external device to provide the tuneability of the detection and use wireless communication to send data to neurostimulator. The neurostimulator is implanted in the cranium and after detecting seizure activities, it releases electrical pulses to the epileptogenic area. The RNS is designed to recognize high frequency and amplitude variation of the EEG signals and provide seizure detection based on feature extraction and data reduction approaches. However, this device is under clinical trial and its power consumption and detection performance aren't published yet [75]. Fig. 2.3 shows the RNS and VNS devices including their feature description.
The closed- loop systems require an efficient and reliable seizure detector to provide an accurate detection with minimum false alarms. Moreover, the device should be implantable in an integrated circuit to reduce the power consumption, which helps reducing the thermal tissue Figure 2.3: The feature description of RNS and VNS devices available for seizure therapy, adapted from [75].
damage on epileptic patients. Several models are proposed for seizure detection using desktop computers to process data off- time [78, 79, 80, 81, 82]. These methods can't be implemented on a low power microchip because of the long-term data processing and heavy computations. Recently, a few implantable seizure detectors are proposed for clinical applications such as [83, 84, 85, 86, 87].
In the following, the implantable low power CMOS-based methods are introduced and compared to this work.
The low-power method in [83] proposed a mixed-signal seizure onset detector which could be implemented in a microchip. This count-based algorithm provides patient-specific seizure detection using one variable parameter. This seizure detector is designed using 0.18 µm CMOS process including end amplifier, comparators, and digital signal processor sta ges. The front-end amplifier is used to amplify low amplitude icEEG signals. It is composed of two amplifier blocks and provides a total gain of 62 dB and 3 dB bandwidth of 0.5 to 215 Hz. A voltage window is used with two threshold levels. One of the threshold levels is set to the mean of the icEEG signals while the second one is tunable for specific patient application. The digital signal processor contains counter and 10 bit digital comparators. A total of 13 epileptic seizures from two patients with focal epilepsy are used to validate the performance of this method. The post-layout simulation results exhibited 100 % sensitivity and an average detection delay of 9.7 s was obtained after seizure onset. In this method, the signal is counted in a time window length. Choosing a longer window provides a higher sensitivity but increases the detection delay. The author proposed a two-path system in order to minimize the detection delay. However, selecting a fixed window length (5 s) could affect the tuneability of the device specified for each patient. Moreover, the 60 Hz power line interference is not filtered and all the results are based on simulations.
Salam et al. [84] introduced a low power device for seizure detection using a set of the voltage level and high frequency detectors. The system is customized for patient-specific EEG signals to increase the specificity of the detection and reduce the unwanted false alarms. The seizure detector is composed of a chopper stabilized preamplifier, filtering stage, voltage comparators, demodulators, and high frequency detectors. The proposed system modulates and amplifies icEEG signals and extracts the progressive increase in amplitude by using voltage level detectors,
and then the signals are demodulated and passed through high frequency de tectors to extract the original frequency and detect epileptic seizures. Tuneable detection thresholds are used to identify the voltage variation of the EEG signals for each patient. The circuit is implemented using 0.18 µm technology and power consumption of 6.7 µw is obtained from simulation results. The experimental tests showed that the power consumption of the device is about 50 µw. This system provided accurate patient-specific seizure detection due to increasing the number of the variable parameters. The validation results on seven patients provided 100 % specificity and an average detection delay of 13.5 s is obtained after seizure onset [84]. However, this method is using a synchronous algorithm where the building blocks are sharing a common clock. Switching in transistors causes additional power consumption a nd transistors that are switching more rapidly will consume more power. As a result, power consumption of the synchronous seizure detectors are increased because of these unwanted clock transitions.
In [85], an implantable method is proposed to detect epileptic seizures and a multiple stage algorithm is used to reduce the false alarms. The detection method is based on marking out the icEEG data into events and measuring the inter-event- intervals (IEI). Threshold levels are used to identify events and the events are related to high- frequency discharges. DC offset and artifacts are removed by capacitive blocking and low-pass filtering stages. Then the amplified and filtered data is compared to amplitude thresholds and IEI extraction blocks. The level of these thresholds is adjustable to adjust the false positive rate less than 5 % and provide patient-specific detection. The detector circuit is designed in 180 nm SOI technology and the data acquisition system is interfaced to desktop computer. The previously recorded data of 6 animals are used to evaluate the performance of the circuit design which resulted in 95 % sensitivity. However, the sensitivity is based on simulation results and furthermore, such event detection methods exhibit more false negative and false positive detection rates due to the increase of the non-seizure detections compared to the count-based algorithms [83].
Power management, safety, tuneability, and performance of the seizure detector are the issues in the design of these systems. Unlike the synchronous methods [84, 85, 86, 87] that share a common clock, the asynchronous techniques eliminate clock trees to reducing power consumption in long-term applications.
CHAPTER 3
A NOVEL ASYNCHRONOUS EPILEPTIC
SEIZURE-ONSET DETECTOR
In previous chapters, a review of the seizure detection algorithm including performance, drawback, and limitation were explained. Some of these methods are designed for special purposes such as patient age groups (neonatal and adult) or clinical use (prediction or detection). The other methods are classified based on type of the EEG recordings (scalp, depth, etc) and detection application (patient-specific or non-patient-specific).
This work proposes a new asynchronous seizure detector that is part of an implantable integrated device intended to identify seizure onset and trigger focal treatment to block seizure progression. In the design of the asynchronous seizure detector, the system's complexity is considered as well as power consumption, and sensitivity. Moreover, a reliable detection delay prior to the seizure attack is verified.
3.1 Synchronous versus asynchronous epileptic seizure detector
Power management of the automatic seizure detectors is one of the major issues of the implantable devices. Since power consumption could be managed by two main parameters, short circuit currents due to transistor switching and signal transitions in parasitic capacitances [91], this work proposes an asynchronous system to reduce power consumption of the seizure detector by eliminating unnecessary clock tree. The general structure of the synchronous method [84] is shown in Fig. 3.1(a). In this structure, the input signals are modulated and then amplified and analyzed in high frequency bands (100–6500 Hz). The time frame is generated by an interna l frequency divider and the detection stage is applied after demodulating the input signals to original frequency bands. Fig. 3.1(b) illustrates the block diagram of the asynchronous method (this work) where an external device on the top of the skin generates the time frame and the input signals are analyzed directly without using modulation or demodulation stages. Table 3.1 explains the differences and similarities of these two methods.
3.2 Asynchronous epileptic seizure detection algorithm
In the algorithm of the integrated seizure detector (Fig. 3.2), an analog stage is used in order to amplify and filter the input signal. The output of the analog part passes through four voltage
window detectors (VWDs). VT L-TH,i is the threshold voltage of the VWDs to determine the strength of the neural signal activities. Due to unpredictable behaviour of the epileptic seizures, a large number of the voltage window detectors (threshold levels) are required. Increasing the number of the VWDs results in higher sensitivity and specificity but at the cost of increasing the detection complexity and power consumption. Using four VWDs provides maximum detection performance; two of these VWDs are used to detect epileptic activities while two others monitor basal activities [1]. The high frequency detectors measure the signal frequency and extract fast activities. The variable parameters (VTL-TH, Tf) and I are tuned based on specific patient seizures to minimize false alarms and enhance sensitivity and specificity of the system.
(a)
(b)
Figure 3.1: Block diagram of the seizure detector, (a) The general structures of the synchronous method in [84], and (b) The general structure of the proposed asynchronous method.
![Figure 1.1: Different placement of electrodes for recording EEG signals. Image obtained from [4]](https://thumb-eu.123doks.com/thumbv2/123doknet/2339820.33647/20.918.138.796.126.385/figure-different-placement-electrodes-recording-signals-image-obtained.webp)
![Figure 2.1: Analysis and classification of the EEG recordings, adapted from [9].](https://thumb-eu.123doks.com/thumbv2/123doknet/2339820.33647/25.918.120.815.352.591/figure-analysis-classification-eeg-recordings-adapted.webp)
![Figure 3.1: Block diagram of the seizure detector, (a) The general structures of the synchronous method in [84], and (b) The general structure of the proposed asynchronous method](https://thumb-eu.123doks.com/thumbv2/123doknet/2339820.33647/39.918.211.707.427.988/figure-diagram-detector-structures-synchronous-structure-proposed-asynchronous.webp)


![Figure 3.14: Schematic diagram of the D flip- flop using NAND gates [99].](https://thumb-eu.123doks.com/thumbv2/123doknet/2339820.33647/51.918.273.652.100.364/figure-schematic-diagram-flip-flop-using-nand-gates.webp)