HAL Id: tel-00600569
https://tel.archives-ouvertes.fr/tel-00600569
Submitted on 15 Jun 2011HAL is a multi-disciplinary open access archive for the deposit and dissemination of sci-entific research documents, whether they are pub-lished or not. The documents may come from teaching and research institutions in France or abroad, or from public or private research centers.
L’archive ouverte pluridisciplinaire HAL, est destinée au dépôt et à la diffusion de documents scientifiques de niveau recherche, publiés ou non, émanant des établissements d’enseignement et de recherche français ou étrangers, des laboratoires publics ou privés.
populations
Thomas Julou
To cite this version:
Thomas Julou. Evolution, competition and cooperation in bacterial populations. Biological Physics [physics.bio-ph]. Ecole Normale Supérieure, 2011. English. �tel-00600569�
E V O L U T I O N , C O M P E T I T I O N A N D C O O P E R A T I O N I N B A C T E R I A L P O P U L A T I O N S
École Doctorale Interdisciplinaire Européenne Frontières du Vivant
Présentée par T H O M A S J U L O U
pour l’obtention du grade de Docteur de l’École Normale Supérieure
E V O L U T I O N , C O M P E T I T I O N A N D C O O P E R A T I O N I N B A C T E R I A L P O P U L A T I O N S
Soutenue le 9 juin 2011 devant le jury composé de :
Rapporteur didier chatenay,Université Pierre & Marie Curie
Rapporteur ivan matic,Université Paris Descartes
Examinateur sam brown,Edinburgh University
Examinateur pierre cornelis,Vrije Universiteit Brussel
Invité nicol as desprat,École Normale Supérieure
Thomas Julou: Evolution, competition and cooperation in bacterial populations, Thèse de doctorat, © 2011
The interplay of environment, heritability, and stochasticity results in the development of different individuals starting from a given genotype. This phenotypic variability affects how natural selection acts on genetic variability. From a general perspective, I aim at studying the impact of phenotypic variability on adaptive dynamics.
In the first chapter, I report on the design of an evolutionary experi-ment in a structured environexperi-ment using Escherichia coli. The trait under selection is resistance to high temperature. In particular, we study the effects of high temperature on chemotaxis, as well as the impact of accli-mation on growth and survival at high temperature.
The second chapter is about the development of a microbial popula-tion measurement device dedicated to diluted populapopula-tions. This contin-uous, non-invasive measurement has a low detection limit that depends on the species. For the model species E. coli, the limit is ca. 5 ⋅ 103mL−1 which represents a 100-fold improvement compared to classical photo-metric methods.
In the third chapter, we study the distribution of pyoverdine between individuals of a clonal population of Pseudomonas aeruginosa. The vari-ability of the concentration of this siderophore is much greater than ex-pected. Although pyoverdine is considered to be a public good, neither spatial heterogeneity nor heritability provide a meaningful description of the variability. Instead we characterize rapid fluctuations in pyoverdine concentration, and propose a model based on a phenotypic switch in py-overdine metabolism that is in good agreement with the experimental data.
Keywords: adaptation, phenotypic variability, bacteria, high tempera-ture, spatial structempera-ture, cell counting, pyoverdine
A F F I L I A T I O N
Laboratoire de Physique Statistique École Normale Supérieure
Les différents facteurs que sont l’environnement, l’héritabilité et la sto-chasticité contribuent au développement d’individus différents à partir d’une information génétique donnée. Cette variabilité phénotypique mo-difie l’action de la sélection naturelle sur la variabilité génétique. Un fil conducteur de ce travail est l’étude de l’impact de la variabilité phénoty-pique sur les dynamiques d’adaptation.
Le premier chapitre expose la conception d’une expérience d’évolution de Escherichia coli dans un environnement structuré. Le trait sélectionné est la resistance aux hautes températures. En particulier, nous étudions les effets de la température sur le chimiotactisme ainsi que l’impact de l’acclimatation sur la croissance et la survie à haute température.
Le deuxième chapitre porte sur la réalisation d’un dispositif de mesure de population microbienne à basse concentration. Cette mesure est conti-nue et non invasive et sa limite de détection varie selon l’espèce. Pour l’espèce modèle E. coli, la limite est environ 5 ⋅ 103mL−1soit une amélio-ration d’un facteur 100 par rapport à la photométrie classique.
Dans le troisième chapitre, nous étudions la distribution de la pyo-verdine entre les individus d’une population clonale de Pseudomonas aeruginosa. La variabilité de la concentration de ce sidérophore considéré comme un “bien commun” est beaucoup plus grande que celle attendue et ne peut être expliquée en terme de répartition spatiale ou d’héritabi-lité. Après avoir caractérisé des fluctuations rapides de la concentration en pyoverdine, nous proposons un modèle de switch phénotypique dans le métabolisme de la pyoverdine qui est en très bonne adéquation avec les observations.
Mots clés : adaptation, variabilité phénotypique, bactérie, haute tempé-rature, structure spatiale, comptage cellulaire, pyoverdine
Je suis reconnaissant à Didier Chatenay, Ivan Matic, Sam Brown et Pierre Cornélis d’avoir accepté d’évaluer ce travail, et les remercie pour la pertinence de leurs suggestions et commentaires.
Ces années de thèse constituent une aventure scientifique et humaine très formatrice. A ce titre, je tiens à remercier David Bensimon pour son encadrement empreint de confiance et d’optimisme et Nicolas Desprat, exemple d’enthousiasme et de persévérance. J’ai aussi eu la chance de tra-vailler avec Vincent Croquette qui a eu assez de pédagogie et de patience pour enrichir les horizons du biologiste que je suis d’un peu d’électro-nique, de conception mécad’électro-nique, de traitement du signal. . . et j’en oublie ! Et je remercie tous les membres de l’équipe pour avoir contribué à cette ambiance de travail détendue et chaleureuse si appréciable ; avec une pen-sée gourmande pour les repas de Noël orchestrés de main de maître par notre chef attitré, Jean-François Allemand.
Plusieurs collaborateurs ont notablement enrichi mon travail de thèse et je les en remercie : Jonathan Saragosti pour les expériences en micro-fluidique sur le chimiotactisme, Isabelle Schalk et Laurent Guillon pour m’avoir initié aux subtilités du métabolisme de la pyoverdine, et Thierry Mora pour sa contribution à l’interprétation de nos résultats expérimen-taux sur la variabilité de la pyoverdine. D’autres personnes m’ont beau-coup aidé en partageant leurs compétences, leurs connaissances et leurs résultats : David Bikard, Nabil Garroum, Stéphane Guyot, José Quintas, Lydia Robert, François Taddéi pour ne citer qu’eux. Ma curiosité et ma culture scientifiques ont aussi été nourries par les échanges avec de nom-breux collègues, professeurs et amis ; parmi eux Timothée Flutre, Karim Barkati, Jean-Yves Bansard, Konrad Hinsen et Michel Morange.
Le Centre de Recherches Interdisciplinaires et l’école doctorale qu’il héberge ont été tout au long de ma thèse des lieux privilégiés d’échanges et de rencontres. Que tous ceux qui contribuent à leur donner vie soient ici remerciés !
Je porte une reconnaissance toute particulière à ceux qui m’ont aidé à persévérer en m’offrant une oreille attentive et des conseils enthousiastes dans les moments difficiles, en particulier Grégory Paul, Pascal Hersen et Andrew Murray. Je remercie aussi Boris Shraiman pour m’avoir offert la possibilité de rédiger la première partie de ce manuscrit dans le cadre extrêmement propice de la conférence “Microbial and Viral Evolution” au KITP de Santa Barbara.
de l’esprit. Un grand merci à mes parents et à mes amis pour les éclats de rire, les bouteilles partagées, et quelques virées inoubliables !
Enfin, je remercie Claire qui enrichit chaque jour et chaque idée de leurs indispensables nuances.
O N T H I S T H E S I S L AY O U T
This thesis was typeset with LATEX 2ε using theclassicthesisstyle by Andre Miede. This typographic style was inspired by Bringhurst’s rec-ommendation as presented in The Elements of Typographic Style. Most plots have been produced with R using theggplot2package by Hadley Wickham. This is an implementation of The Grammar of Graphics from Leland Wilkinson.
I am warmly grateful to the developers of these packages for providing such powerful, elegant, open-source tools.
Foreword . . . 1
1 on the interpl ay bet ween acclimation and adaptation: evolu tion in a temperature gradi-ent 3 1 . 1 Introduction . . . 5
1 . 1 . 1 Spatial structure in ecology and evolution . . . . 8
1 . 1 . 2 Impact of high temperature on bacteria physiology 11 1 . 1 . 3 Adaptation to high temperature in evolutionary experiments . . . 18
1 . 1 . 4 Acclimation to temperature variations: effects of temperature history . . . 24
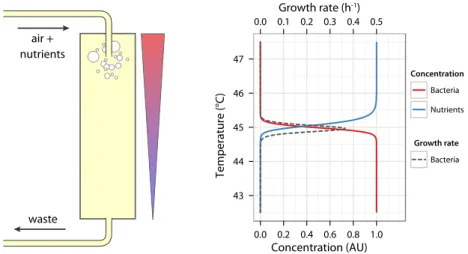
1 . 2 Adaptation and acclimation to a temperature gradient in a chemostat . . . 28
1 . 2 . 1 Experimental design . . . 28
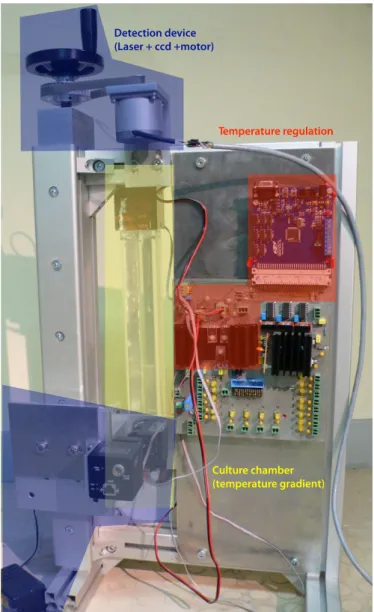
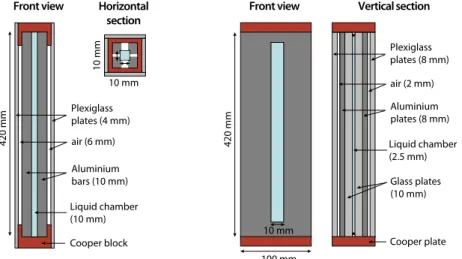
1 . 2 . 2 Building the setup . . . 30
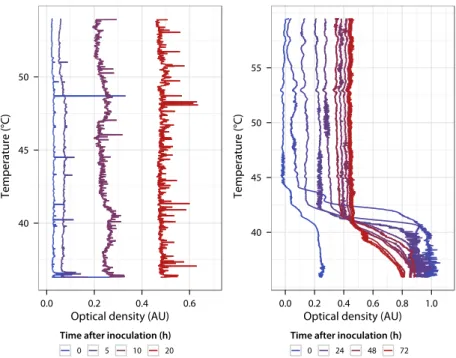
1 . 2 . 3 Short-term ecological dynamics . . . 33
1 . 2 . 4 Reducing convection . . . 35
1 . 3 Interplay of chemotaxis and temperature . . . 38
1 . 3 . 1 Microchannels setup principle . . . 38
1 . 3 . 2 Collective motion of bacteria in a temperature gradient . . . 39
1 . 3 . 3 Characterization of thermotaxis . . . 42
1 . 4 Effect of temperature history on growth and survival . . . 44
1 . 4 . 1 Survival to heat shock . . . 44
1 . 4 . 2 Acclimation and growth at high temperature . . . 45
1 . 5 Discussion . . . 49
1 . 5 . 1 Challenges of evolutionary experiments in a spatial temperature gradient . . . 49
1 . 5 . 2 On the nature of acclimation . . . 51
1 . 5 . 3 Costs and benefits of acclimation in bacteria . . . 51
1 . 5 . 4 Interplay between acclimation and adaptation in evolution experiments . . . 53
Bibliography . . . 57
2 microbial p opul ation dynamics at low densities 65 2 . 1 Introduction . . . 67
2 . 1 . 1 Context and aims . . . 67
2 . 2 Device monitoring microbial growth at low density . . . 73
2 . 2 . 1 Principle and setup . . . 73
2 . 2 . 2 Validating the approach . . . 77
2 . 3 Biological applications . . . 81
2 . 3 . 1 Methods . . . 81
2 . 3 . 2 Calibrations with microbes . . . 82
2 . 3 . 3 Population dynamics . . . 83
2 . 3 . 4 Discussion and perspectives . . . 84
Bibliography . . . 88
3 distribu tion of siderophores in clonal p opul a-tions 91 3 . 1 Introduction . . . 93
3 . 1 . 1 Bacterial siderophores: a model system to study public goods games . . . 95
3 . 1 . 2 Pyoverdine metabolism in Pseudomonas aerug-inosa . . . 101
3 . 2 Methods and results . . . 108
3 . 2 . 1 Protocols . . . 108
3 . 2 . 2 Dynamic variability of pyoverdine concentra-tion within a clonal microcolony . . . 111
3 . 2 . 3 Molecular mechanisms underlying pyoverdine variability . . . 123
3 . 3 Discussion . . . 127
3 . 3 . 1 Implications of a phenotypic switch in pyover-dine metabolism . . . 127
3 . 3 . 2 On the evolution of pyoverdine . . . 132
Bibliography . . . 136
appendices 143 a . 1 Technical notice on the evolutionary chemostat . . . 145
a . 1 . 1 Hardware . . . 145
a . 1 . 2 Microcontroller program . . . 149
a . 1 . 3 Experimenter manual . . . 154
a . 2 Review on nonlinearities in biology . . . 165
a . 3 Article draft on pyoverdine . . . 185
Figure 1.1 Maximum growth rate as a function of
tempera-ture in E. coli . . . 7
Figure 1.2 Survival of E. coli at high temperature . . . 7
Figure 1.3 Thermostability of E. coli homoserine transsuc-cinylase . . . 13
Figure 1.4 Regulatory circuits of the σ32regulon in E. coli . . 15
Figure 1.5 Adaptation to high temperature in green algae . . 20
Figure 1.6 Relative and absolute fitness changes in a temper-ature adaptation experiment with E. coli . . . 21
Figure 1.7 Absence of evolutionary trade-offs in E. coli adap-tation to constant temperatures . . . 22
Figure 1.8 Spatially structured chemostat setup principle . . . 29
Figure 1.9 Picture of the chemostat prototype . . . 31
Figure 1.10 Time-lapse optical density profiles after inoculation 34 Figure 1.11 Improvement of the growth chamber geometry . . 36
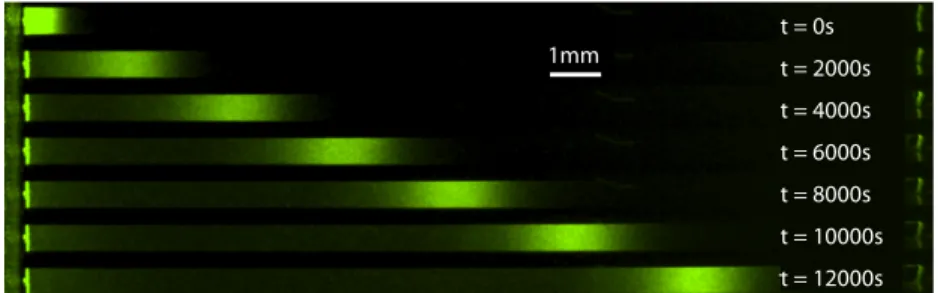
Figure 1.12 Convection intensity in a thin rectangular chamber 36 Figure 1.13 Setup principle of microchannel used for collec-tive motion experiments . . . 39
Figure 1.14 Collective chemotactic motion of E. coli in a mi-croscopic temperature gradient . . . 41
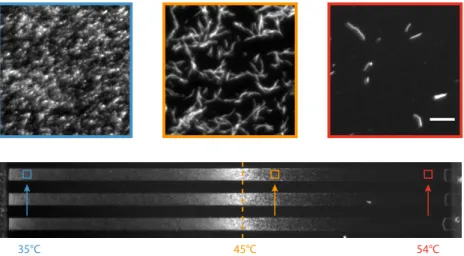
Figure 1.15 Morphological changes of E. coli after migration in a microscopic temperature gradient . . . 41
Figure 1.16 Survival of E. coli at high temperature . . . 46
Figure 1.17 Growth of E. coli in temperature ramps of de-creasing slopes . . . 48
Figure 1.18 Instantaneous growth rate of E. coli in tempera-ture ramps of decreasing slopes . . . 49
Figure 2.1 Typical diffused light pictures obtained from sim-ulation and experiments . . . 74
Figure 2.2 Relative precision of λ estimation . . . 75
Figure 2.3 Schematic of the cell counting setup . . . 76
Figure 2.4 Typical histogram of intensity . . . 77
Figure 2.5 Validation of the cell counting method using stochastic simulations . . . 78
Figure 2.6 Validation of the cell counting method using gold nanoparticles . . . 79
Figure 2.7 Calibration with bacteria and yeast . . . 82
Figure 2.9 Growth of Saccharomyces cerevisiae . . . 85 Figure 3.1 Relatedness & scale of competition . . . 99 Figure 3.2 Simplified scheme of pyoverdine metabolism . . . 102 Figure 3.3 Divergent signalling pathways activated by
py-overdine receptor . . . 105 Figure 3.4 Pyoverdin-related genes in Pseudomonas
aerugi-nosa PAO1 . . . 106 Figure 3.5 Analysis scheme used in Schnitzcell software . . . 110 Figure 3.6 Overall pyoverdine fluorescence during
micro-colony growth . . . 112 Figure 3.7 Pyoverdine distribution within a clonal microcolony 113 Figure 3.8 Pyoverdine distribution as a function of mean
concentration . . . 114 Figure 3.9 Variations in space of pyoverdine concentration . . 114 Figure 3.10 Genealogical tree of normalized pyoverdine
con-centration in a microcolony . . . 116 Figure 3.11 Temporal fluctuations of pyoverdine concentration 117 Figure 3.12 Notion of old pole age in symmetrically dividing
bacteria . . . 119 Figure 3.13 Asymmetry of pyoverdine concentration
be-tween sister cells . . . 119 Figure 3.14 Rapid fluctuations of pyoverdine concentration . . 120 Figure 3.15 Characterization of the phenotypic switch in
py-overdine metabolism . . . 121 Figure 3.16 Simulations of the phenotypic switch model . . . . 122 Figure 3.17 Power spectrum of experimental and simulated
pyoverdine fluctuations . . . 123 Figure 3.18 Distribution of pyoverdine concentration in
var-ious mutants of pyoverdine metabolism . . . 125 Figure 3.19 Pyoverdine secretion in various mutants of
py-overdine metabolism . . . 125 Figure 3.20 Pyoverdine distribution and iron availability . . . . 127
L I S T O F T A B L E S
Table 1.1 Sites of damage in non-sporulating Gram-negative bacteria exposed to high temperature . . 11 Table 1.2 Major heat shock proteins of the σ32regulon . . . 14 Table 2.1 Comparison of bacteria concentration
technics and models
CLT central limit theorem
CTMI cardinal temperature model with inflexion
GSL GNU scientific library
OD optical density
PIV particle image velocimetry
SEM standard error of the mean
biolo gical comp ounds
ECF-σ extracytoplasmic function sigma factor
GFP green fluorescent protein
MCP methyl-accepting chemotaxis protein
NRP non-ribosomal peptide
NRPS non-ribosomal peptide synthetase
HSP heat shock protein
growth media
CAA Casamino acids medium
DM Davis minimal medium
LB Luria Bertani rich medium
SMM succinate minimal medium
YNB yeast nitrogen base
YPD yeast peptone dextrose
chemicals
GNP gold nanoparticle
PDMS polydimethylsiloxane
electronics
ADC analog-to-digital converter
LED light emitting diode
PID proportional-integral-derivative
PWM pulse-width modulation
In general, the characteristics observed in individuals (phenotype) re-sult from the expression of their genes (genotype) conditioned by envi-ronmental conditions (environment) and random effects (stochasticity). Importantly, environmental and stochastic effects interact in producing phenotypes out of a given genotype.
The environmental conditions can change in time and/or along space. In fluctuating environments, the phenotype of an individual with a given genotype may vary with time through a process called acclimation. In spatially heterogeneous environments, clonal individuals at different places can potentially express different phenotypes. In addition, in all conditions, the stochasticity of biochemical reactions (e.g. gene expres-sion) is another source of variability between clonal individuals.
The variations in phenotypes, be they stochastic or due to the environ-ment, can be inherited from one generation to the next. Although this is not a long lasting effect, it makes the distribution of phenotypes even more complex since parameters are history-dependent. More generally, the history of individuals, including for instance their interactions with others, can affect their phenotypes. Overall, since natural selection acts on phenotypes, studying these sources of phenotypic variations is central in order to understand better the mechanisms of adaptation.
This thesis is written as three independent chapters. In the first chap-ter, I report on the design of an evolutionary experiment in a spatially structured environment. A strong emphasis is given to the identification of the different biological issues adressed in the experiment (in particu-lar in terms of acclimation) and to how they can be disentangled. In the second chapter, I describe a new microbial population density measure-ment device dedicated to diluted populations. This is an extension of the project presented in the first chapter. Finally, in the third chapter, I focus on interactions in microbial populations and study the variability in the access to public goods between individuals.
O N T H E I N T E R P L AY B E T W E E N A C C L I M A T I O N A N D A D A P T A T I O N : E V O L U T I O N I N A T E M P E R A T U R E G R A D I E N T
In evolutionary biology, adaptation refers to the process occurring as a result of natural selection. Due to random mutations, individuals in a population exhibit slightly different phenotypes and corresponding abilities to reproduce. Given a set of environmental constraints, those with higher reproductive rates will be advantaged and their relative abun-dance will increase in proportion. Consequently, adaptation occurs over several generations and gives rise to heritable genetic changes that will in turn produce modified phenotypes (Smith, 1998).
In contrast, acclimation (sometimes spelled acclimatization) refers to reversible, nongenetic changes in phenotype that are induced by specific environmental conditions; it is a particular case of phenotypic plastic-ity observed in response to environmental changes (Bennett and Lenski, 1997). The phenotypic changes are understood as the result of rapid mod-ifications of metabolic regulations, thanks to modified gene expression or enzymatic activity for instance. It can occur within the individuals lifetime or can last for a few generations when changes are heritable.
A well-known example in humans illustrates these two responses: dur-ing short or intermittent exposure to high altitude, variations in blood volume and erythropoietic activity allow to face reduced oxygen avail-ability due to lower atmospheric pressure (Schmidt, 2002). While this sponse is observed in all populations, similar traits are observed as the re-sult of heritable genetic changes in those who have settled at high altitude (over 4000 m) for long times (Bigham et al., 2010; Yi et al., 2010). Similar adaptation has been analyzed in details in other mammals: in deer mice, balanced polymorphism is reported at duplicated globin genes loci and hemoglobin of deer mice living at higher altitude has higher affinity for oxygen (Storz et al., 2009).
Similarly, when bacteria are exposed to antibiotics, resistance arises both from acclimation and adaptation mechanisms. Pseudomonas aerug-inosa is naturally resistant to a broad range of antibiotics thanks to very efficient efflux pumps that drive chemicals out of the cell. The expres-sion of certain efflux pumps is inducible and increases in presence of an-tibiotics (Jeannot et al., 2005). However, heritable resistance can also be acquired by mutation or horizontal gene transfer. These adaptive modifi-cations take place over generations and confer most of the time either a higher constitutive expression of efflux pumps or a new enzymatic func-tion allowing to degrade chemicals (Andersson and Hughes, 2010).
In this study, we focus on microbes and in particular on the most stud-ied bacteria, Escherichia coli, as it provides a very powerful model or-ganism for ecological, evolutionary and functional approaches: its rapid growth and small size allow to study large populations over a large num-ber of generations while at the cellular level molecular tools are well
de-veloped. In addition, we choose high temperature as an experimental se-lective pressure since it has a marked effect on several phenotypic traits in bacteria. As stated by Hickey and Singer (2004),
“while variations in environmental temperature share many of the characteristics of other environmental variables, tem-perature is special because of its pervasiveness: it can pene-trate physical barriers and can have dramatic effects on the structure of virtually all macromolecules.”
From a practical point of view, temperature is easily regulated in culture devices, and linear gradients establish spontaneously by heat diffusion between two sources.
In order to be able to describe accurately adaptation to different tem-perature regimes, let me introduce the notion of thermal niche in the next paragraphs. Following the concept of ecological niche, a thermal niche is defined as the range of temperatures where a species can main-tain itself and reproduce. In microbes, we follow the definition that re-stricts this notion to the range of temperatures where the species can maintain itself (Bennett and Lenski, 1993). In this case, the thermal niche is summed up by the quantitative dependance of growth rate on temper-ature. This relationship can be satisfactorily approximated in most cases using three parameters referred to as cardinal temperatures: minimal, maximal and optimal growth temperatures.
Temperature affects bacteria phenotypes in two main ways:
– Within the thermal niche, the dominant effect is the dependance of growth rate on temperature. Several models have been proposed to describe this relationship. The cardinal temperature model with inflexion (CTMI) is a popular one that only takes the cardinal tem-peratures (Tmin, Tmax, Topt) and maximal growth rate at optimal temperature (γopt) as parameters (Fig. 1.1; Rosso et al., 1993). The maximal growth rate γ at a given temperature T writes
γ = max(0, γopt(T−Tmax)(T−Tmin)
2
(Topt−Tmin)((Topt−Tmin)(T−Tmin)−(Topt−Tmax)(Topt+Tmin−2T))
).
Interestingly, the optimal growth temperature of E. coli isolated from human is higher than 37○C, its host’s temperature.
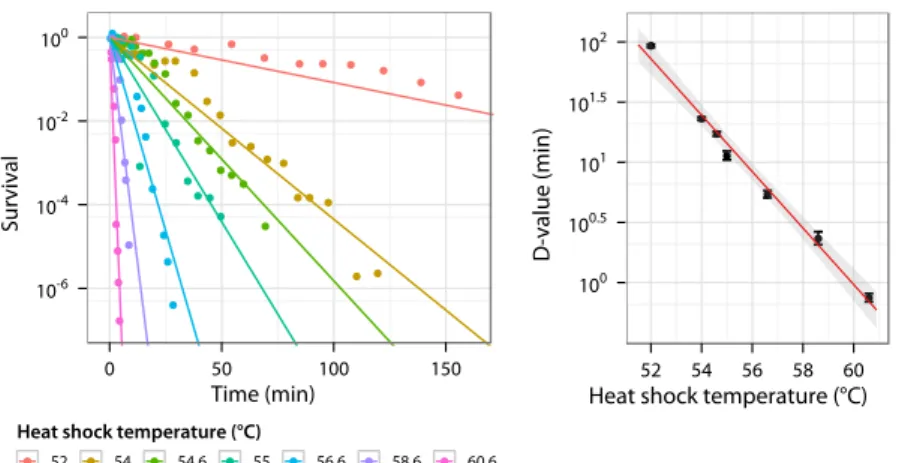
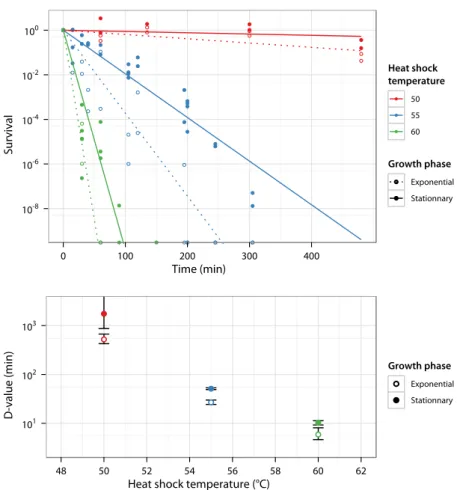
– Above the thermal niche upper limit (that is the maximal growth temperature), temperature challenges survival. Due to high tem-perature damage, the bacterial population size decreases with time (Fig. 1.2 left); whether the decrease is exponential or not is still de-bated (Russell, 2003). However, this death rate increases rapidly with temperature (Fig. 1.2 right). In this field, the survival is usu-ally described by two parameters. The decimal reduction time (D-value) is the time required at a given temperature to decrease 10
Temperature (°C)
Maximum growth rate (h
− 1) 0.0 0.5 1.0 1.5 2.0 2.5 0 10 20 30 40 50 Source Barber, 1908 Bronikowski, 2001
Figure 1.1: Maximum growth rate as a function of temperature in E. coli. Bacteria maximum growth rates are reported for a laboratory strain in beef peptone broth (Barber, 1908) and for natural isolates sam-pled at different seasons in ectothermic turtles and grown in LB (Bronikowski et al., 2001). For both datasets, the relationship is fitted to theCTMImodel (Rosso et al., 1993) using the least square method implemented with Rgenoud (Mebane and Sekhon). Such model is very useful to describe adaptation to temperature as it allows to ap-proximate the thermal niche using only four parameters.
Time (min) Survival 10-6 10-4 10-2 100 0 50 100 150
Heat shock temperature (°C)
52 54 54.6 55 56.6 58.6 60.6
Heat shock temperature (°C)
D-value (min) 100 100.5 101 101.5 102 52 54 56 58 60
Figure 1.2: Survival of E. coli MG1655 at high temperature (using data from Val-dramidis et al., 2006). Early stationary phase culture grown inLB is transfered to higher temperature and survival is measured as a function of time. Left: Proportion of surviving cells after transfer to high temperature, fitted exponentially and setting initial survival to 1. Right: Decimal reduction time (D-value) computed from the survival curves and plotted against temperature with an exponential fit.
times the population size. The z-value is the increase of the heat-shock temperature required to decrease 10 times the D-value. The relevance of the z-value is based on the hypothesis that the D-value decreases exponentially with temperature.
With both applied motivations (infection control, food safety, . . . ) and basic incentives (heat shock as a model of gene regulation), the interest for bacteria resistance to high temperature started as early as the begin-ning of the twentieth century. The impact of temperature on growth was examined both in mesophiles (Barber, 1908) and thermophiles (Casman and Rettger, 1933), while survival at relatively high temperature was de-scribed in Bacillus spp. (Elliker and Frazier, 1938). Although more and more descriptions are available and mechanisms are elucidated one af-ter the other, a global understanding of the effects of high temperature on life history is still lacking. Noteworthily, a promising thermodynam-ics global approach has recently been proposed (Chen and Shakhnovich, 2010).
In broad outline, our project consists in evolving bacteria over a long time in a temperature gradient. Nutrients are delivered at the hottest point of the setup where growth is originally not possible so as to cre-ate an adverse nutrient gradient. This results in selection for growth and survival at higher temperature. In order to explicit the relevance of this experimental design, I review in the next sections (i) the importance of spatial structure in ecology and evolution, (ii) the impact of high temper-ature on bacteria physiology, and results from (iii) adaptation and (iv) acclimation experiments from the literature.
1 . 1 . 1 spatial structure in ecolo gy and evolu tion
1 . 1 . 1 . 1 Taking spatial structure into account in ecological and evolution-ary descriptions
Although all living systems are scattered over their environment, clas-sic theoretical and modeling approaches do not take it into account when describing population dynamics and interactions. As pointed out by Dieckmann et al. (2000), this corresponds to a mean-field assumption that is most likely to hold as a good approximation when the physico-chemical environment of organisms is homogeneous and
– physical forces exist that cause strong mixing of organisms, or – organisms themselves are highly mobile, or
– organisms interact with others over long distances.
These three interaction conditions are violated in several natural sys-tems, and the physical environment is often structured by patchiness or gradients. Let’s review a few examples:
– One of the yeast natural habitats is fruits as they represent a large source of nutrients. While mean-field assumption may be reason-able within an overripe juicy fruit, overall population dynamics at the level of a tree cannot rely on it. Patchy environmental resources are also very common in pathogens and parasites since hosts are generally separated from each other.
– Environmental gradients are common in nature as they appear ev-ery time a diffusible resource (nutrient, light, heat, . . . ) is locally more concentrated. For instance, hot springs are punctual heat sources (Miller et al., 2009) while hydrothermal vents also bring hydrogen sulfide in the environment. Sometimes, the gradient can be produced by living organisms themselves as for light gradient ob-served in forests where the canopy layer intercepts most light and reduces light available for photosynthesis at the understory layer. Gradients can also occur when stress varies over space (heat, radia-tions, . . . ) as observed in desertification gradients.
– Several types of ecosystems do not fulfill the interaction conditions formulated above. In plant communities, individuals can only dis-perse from one generation to the next which results in a long lasting spatial organization. In microbial biofilms, individuals are part of large colonies developing on surfaces thanks to extracellular poly-meric substance secretion. Consequently cells are no longer motile nor affected by medium flows.
As illustrated above, the spatial structure of the environment and that of communities are shaping each other. In general, at the level of indi-viduals this results in increased local competition for resources and in re-peated interactions between neighbours that must be taken into account to give an accurate ecological description. This can qualitatively change the nature of interactions over long times and thus affect evolutionary dy-namics: while local competition between relatives can be detrimental to cooperation (Buckling et al., 2007), repeated interactions can contrarily favor it (Doebeli and Hauert, 2005).
It is noteworthy that taking spatial structure into account is even more important when considering long term dynamics, since rare events (long range dispersal, mutations in the interaction system, . . . ) may hap-pen that can result in qualitatively different outcomes. This may be a caveat for theoretical approaches where evolutionary dynamics are de-rived from ecological dynamics: the ecological description may be rele-vant over short periods but misses some important features that are shap-ing the adaptive sequence in nature.
1 . 1 . 1 . 2 Spatial structure in evolutionary experiments
As far as experimental evolution is concerned, spatial structure is rarely taken into account as most experiments are run in well-mixed environments. It is probably considered to be an additional source of variability that is better kept as small as possible. Adaptation to min-imal medium over 1000 generations has been compared between liq-uid medium and plates in Comamonas sp., revealing more diversity and higher divergence between replicates in structured environment (Ko-rona et al., 1994). These differences are significant although of limited magnitude.
In addition, recent advances in microfluidics have allowed to manip-ulate the spatial availability of nutrients and have brought unexpected results on the ecological dynamics of E. coli stationary phase cultures (Lambert et al., 2011). This emphasizes the need to study evolutionary dynamics in spatially complex environments.
The most notable study of evolution in structured environments fo-cuses on diversification in Pseudomonas fluorescens. When grown in static medium, P. fluorescens rapidly diversifies into three morphs spe-cialized in different ecological niches (Rainey and Travisano, 1998). This has become a model system for the study of adaptive radiation (Jessup et al., 2004).
1 . 1 . 1 . 3 Environmental gradients as a special case of spatial structure Among the various types of spatial structure, gradients are a special case that received particular attention (Ackermann and Doebeli, 2004; Doebeli and Dieckmann, 2003; Mizera and Meszena, 2003). In the study
Allopatric speciation refers to individuals becoming two distinct species due to geographical isolation. By contrast, sympatric speciation occurs in the same habitat. It is common in bacteria due to horizontal gene transfers.
of geographical aspects of speciation, gradients are not a case of allopatric speciation but rather facilitate sympatric speciation. Models predict that this allows diversification when it would not occur in non-spatial mod-els (Doebeli and Dieckmann, 2003). In this study, the slope of the gradi-ent, i.e. the rate of temperature variation along space, appears as a crit-ical parameter for facilitation, with intermediate slope being the most favorable for speciation. Moreover, natural populations of the cyanobac-terium Mastigocladus laminosus sampled at different points of a tempera-ture gradient around a geyser show clear signs of lineages differentiation indicating that sympatric diversification does occur along ecological se-lection gradients in nature (Miller et al., 2009).
site damage
Outer membrane Affected to some extent by high temperature Cytoplasmic
(in-ner) membrane
Severe damage (heat stability varies with melt-ing point of cell lipids); cells become leaky; leak-age precedes death
Ribosomes and ri-bosomal RNA
Degradation; precedes loss of viability
DNA Single strand breaks, partly a consequence of nuclease activity; repaired in radiation-resistant but not -sensitive bacteria
Proteins Denaturation, especially at high temperatures (possible aggregation)
Enzymes Inactivation, especially at high temperatures Table 1.1: Sites of damage in non-sporulating Gram-negative bacteria exposed
to high temperature (after Russell, 2003).
1 . 1 . 2 impact of high temperature on bacteria physiol-o gy
In order to study the interplay between acclimation and adaptation to high temperature, it is important to know about the molecular mech-anisms that are affected by temperature. Good starting points are the physiological differences observed when bacteria are grown at various temperatures or upon heat shock. In this section, I focus on E. coli to examine how bacterial components and metabolism are affected during acclimation and/or adaptation to high temperature.
1 . 1 . 2 . 1 Effects of high temperature on cellular components
When temperature is higher than the optimal growth temperature, both the cell envelope ensuring cell integrity and cytoplasmic molecules
are affected. The main alterations are listed in Table 1.1 and reviewed in As we are interested in
populations able to grow, we only consider the case of moist heat while the effects of dry heat may be notably different (Russell, 2003).
a clear and concise manner in Russell (2003). So far, there is no clear evidence for which damage is primarily responsible for cell death, if any. This may vary depending on temperature and other environmental con-ditions.
In bacteria, the cell envelope consists in one or two lipid membranes strengthened by a peptidoglycan cell wall and has a tightly regulated per-meability. Temperature may affect various physical properties of this en-veloppe such as its fluidity, its permeability and the bilayers
conforma-tional states (bilayer, inverted micelle, . . . ) as well as its chemical compo-sition.
In heat shock experiments, the membrane fluidity increases with tem-perature as shown by measuring the lateral diffusion coefficients of lipids (Lindblom et al., 2002). Moreover sugars as trehalose form hydrogen bonds with lipid polar heads and stabilize the bilayer structure (Crowe et al., 1988), as do membrane proteins by increasing the rigidity of phos-pholipids alkyl chains (Denich et al., 2003). From a mechanical view-point, a temperature shift to 55○C damages the cell envelope of E. coli W3110 as surface blebs are observed, mainly at the septa of dividing cells. This results primarily in the destruction of the outer membrane perme-ability barrier and in the release of periplasmic molecules (Katsui et al., 1982; Tsuchido et al., 1985).
In E. coli grown at different temperatures, saturated phospholipids are more abundant at higher temperature (Marr and Ingraham, 1962). This results in higher packing of phospholipids and consequently balances the increase in membrane permeability expected due to higher temperature (Haest et al., 1969). In addition, as suggested by Morein et al. (1996), bac-teria adjust their membrane composition depending on the temperature in order to keep a suitable structure. In particular, the protein content of the outer membrane differs between growth at 30○C and 42○C (Lugten-berg et al., 1976).
Proteins are another type of cellular components strongly affected by temperature: the conformation of proteins changes when temperature increases as hydrogen bonds formed with surrounding water molecules weaken (Vogt et al., 1997). For most proteins, unfolding is a reversible process that occurs already at temperatures lower than optimal growth temperature. Although this process is reversible, the unfolded proteins may be irreversibly inactivated whey they are recruited within large hy-drophobic protein aggregates (Fig. 1.3).
Nucleic acids are also affected by high temperature. While ribosomal components are degraded early and probably not primarily involved in cell death, damages on DNA are abundant. Single strand breaks are pro-duced either directly or by acceleration of the action of endogenous nu-cleases; they are repaired only in radiation-resistant strains.
These modifications of cellular components result both from direct effects of temperature (e.g. protein unfolding, nucleic acids damages, . . . ) and indirect effects that also involve changes in gene expression. The latter are described in the next section.
Figure 1.3: Thermostability of E. coli homoserine transsuccinylase (after Gur et al., 2002).
Homoserine transsuccinylase folding is strongly affected by temper-ature. Unfolding starts around 20○C. Above 44○C massive aggrega-tion of this protein has been reported. Homoserine transsuccinylase (metA gene product) is the first enzyme of the methionine biosyn-thesis pathway. In absence of methionine, it is claimed to be the first enzyme limiting growth at high temperature (Gur et al., 2002) although van Derlinden et al. (2008) did not manage to reproduce this observation.
1 . 1 . 2 . 2 Effects of high temperature on cellular metabolism and gene ex-pression
From a biochemical viewpoint, temperature variations affect the ki-netics of all chemical reactions. The rate of a reaction k is related to the temperature T (expressed in kelvin) following Arrhenius law:
k = Ae−Ea/RT
where Eais the activation energy, R is the gas constant and A is a preftor. This relationship provides an accurate description of enzymatic ac-tivity below the optimal growth temperature. Interestingly, the growth rate of E. coli depending on temperature can be described using Arrhe-nius law below the optimal growth temperature and this relationship is maintained in a number of different nutrient conditions (Monod, 1942). However in this case, the relationship is purely descriptive and should not be interpreted by hypothesizing that one master reaction is limiting growth.
Above the optimal growth temperature, enzymatic activity decreases primarily because of protein denaturation described in the previous sec-tion. Putting together the Arrhenius relationship at moderate temper-ature and the denaturation occurring at high tempertemper-ature results in a
activit y proteins
Chaperone DnaK, DnaJ, HtpG, ClpB, IbpA, IbpB, GroEL, GroES Protease ClpP, ClpX, Lon, ClpY, ClpQ, FtsH (metalloprotease) Other GapA (dehydrogenase), PrpA (phosphatase), GrpE
(nucleotide exchange factor), σ70(sigma factor), HtrM (epimerase), MetA (homoserine transsuccinylase) Table 1.2: Major heat shock proteins (HSPs) of the σ32regulon (after Yura et al.,
2000). A detailed description of cellular functions is proposed in Riehle et al. (2003).
satisfying approximation of the enzymatic activity dependance to tem-perature over the thermal niche (Copeland, 2000; Guyot, 2007). The shape of this relationship is very similar to growth rate dependance to temperature (Fig. 1.1), although it can be shifted along the temperature axis depending on enzyme stability.
When exposed to high temperature (transiently or over longer pe-riods), E. coli shows a massive change of gene expression. While the detailed mechanism and effectors of this response have been character-ized early (Gross, 1996), recent transcriptome studies in different strains (MG1655 and O157:H7) show that expression of hundreds of genes is affected (Carruthers and Minion, 2009; Harcum and Haddadin, 2006). These changes are usually refered to as the “heat shock response”.
The changes in gene expression mostly result from the activation of two sigma factors, σ32and σE, encoded by rpoH and rpoE respectively. This is reviewed very clearly in Yura et al. (2000). σ32controls the tran-scription of cytoplasmic heat shock proteins (HSPs) while σEcontrols that of periplasmic ones; since it is used to signal extracytoplasmic conditions to the cytoplasm, σEis classified as an extracytoplasmic function sigma factor (ECF-σ). These two transcription factors controlling the expression of similar proteins in cytoplasm and periplasm respectively correspond to an example of overlooked compartmentation in bacteria physiology.
HSPs consist primarily in chaperones and proteases (Table 1.2) and are characterized by a consensus sequence in their promoter region. In more details, σ32activates the transcription of DnaK-DnaJ and GroEL-GroES chaperones that help protein folding and are essential for growth above 20○C. σEactivates the transcription of rpoH and its own gene rpoE as well as the transcription of periplasmic proteases and isomerases (assist-ing protein fold(assist-ing); it is essential for growth at all temperatures.
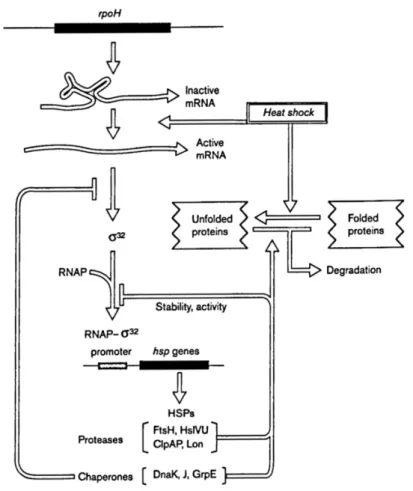
Interestingly, the heat shock response activation relies on physico-chemical alteration of cell compounds (as described in section 1.1.2.1). In particular, the mRNA of σ32exhibits an unusual secondary structure
Figure 1.4: Regulatory circuits of the σ32 regulon in E. coli (after Yura and Nakahigashi, 1999).
with loops that prevents ribosome binding and subsequent translation. At high temperature, the stability of the secondary structure is lower and translation can initiate. It is believed that rpoH mRNA alone acts as a cellular thermometer (Fig. 1.4).
In addition, the σ32regulon temperature-dependent regulation is also based on proteins sensitivity to temperature. Downregulation of the σ32 regulon involves DnaK, a chaperone binding to σ32and preventing the formation of the σ32-RNA polymerase active complex. Once bound to DnaK, σ32can be subsequently degraded by the protease FtsH. As DnaK chaperone is mostly implicated in preventing protein misfolding and is present in limited amount, even a slight increase of the pool of misfolded protein will reduce DnaK-σ32interaction and result in activating the heat shock response. This role of DnaK in σ32turnover actually offers another
induction mechanism for the heat shock response. As a consequence, the heat shock response is actually a general stress response (induced among other by ethanol, abnormal protein synthesis, antibiotics, . . . ). It appears to be widely conserved as such through evolution (Sorensen et al., 2003).
Ultimately, the activation of the heat shock response results not only in the synthesis of a certain numbers of effectors but more generally in a global reorganization of cell structures in a way that limits the damages described previously.
1 . 1 . 2 . 3 Dynamics and specificity of the heat shock response
From a dynamic viewpoint, the heat shock response consists in rapid modifications of the bacteria physiology. When E. coli is exposed to a sudden change of temperature (30○C to 42○C), the synthesis ofHSPs in-creases and very rapidly reaches the maximum induction (10 to 15 fold after only 5 min whereHSPsrepresent 20 % of total proteins). This is fol-lowed by a gradual decrease and reaches a plateau (2 to 3 fold preshift level) after 30 min. If temperature is higher, synthesis of other proteins stops and HSPs are produced as long as the cell can produce proteins (Yura et al., 2000).
This heat shock response has been characterized in the case of rapid temperature increases. Nonetheless, if the rate of temperature increase is sufficiently low, E. coli can survive and grow at unexpectedly high tem-perature, between 50 and 55○C (Guyot, 2007, reported in greater details in section 1.1.4.2). Does this occur thanks to the same mechanisms at play at lower temperature that would be challenged in this case to their upper limit? Or are there other stress resistances that take over in this case? Unexpectedly, neither the level of aggregated proteins nor the level of cytoplasmic chaperones was changed in this experiment suggesting that the heat-shock response was not dominant.
The fact that the so-called heat shock response is not always activated at high temperature is supported by other experiments. It has been pro-posed that following a heat shock, σ32 activation is important mostly in aerobic conditions while σ32-independent mechanisms would be ac-tive in anaerobic conditions and in stationary phase (Díaz-Acosta et al., 2006). In line with these observations, E. coli transcriptional response has been shown to be different in transient vs. long term responses to elevated temperature (Gunasekera et al., 2008). Together, these results suggest thatHSPsmay rather act as healing compounds after a heat shock rather than conferring a stress resistance in itself.
Finally, whatever the mechanism, it is likely that growth above the up-per thermal limit through acclimation has not be selected for in recent E. coli history and that it rather challenges the flexibility of general stress response mechanisms.
1 . 1 . 2 . 4 Adaptations to high temperature in thermophilic bacteria As far as adaptation is concerned, the actual targets of selection will very likely depend on the precise selective pressures (constant or sea-sonal environment, nutrients availability, uniform or structured environ-ment, . . . ) and any sequence of adaptive events is difficult to predict since the relative effect of the different damages is not elucidated (Hickey and Singer, 2004). In these conditions, it can be instructive to look at how thermophiles and hyperthermophiles survive at high temperature. As exposed by Russell (2003),
“enzymes and proteins are much more heat-stable and ap-pear to function optimally at high temperatures as a result of critical amino acid substitution in one of a few locations. They thus appear to fold in a different way and can better cope with the denaturing effects of heat. The heat stability of proteins from thermophiles is increased by the presence of a number of salt bridges, of disulfide bonds (Beeby et al., 2005) [an], and by the densely packed hydrophobic interior nature of the proteins. It must also be pointed out that the ribo-somes tend to be thermostable and that thermophilic organ-isms have membranes that are rich in saturated fatty acids, which form much stronger hydrophobic bonds, thereby con-ferring stability and functionality at high temperatures.”
Importantly, thermophiles’ DNA is also protected by high levels of in-tracellular potassium and polyamines (protecting against bonds degra-dation), by high reverse gyrase activity generating positive supercoil-ing (that stabilizes DNA), and by histone-like proteins that increase the degradation temperature (Grosjean and Oshima, 2007). Although the CG content is expected to stabilize DNA, it does not clearly increase with optimal growth temperature and may rather depend on other selective pressures like high recombination rates. Overall, regarding changes ob-served in thermophiles DNA sequences, it is difficult to disentangle the effects of selection on DNA stability and on RNA and protein stability (Hickey and Singer, 2004).
Finally, from an evolutionary perspective, it is noteworthy that the heat shock response is a general stress response than can in particular be triggered by increased level of abnormal proteins following mutations (Sorensen et al., 2003). Consequently individuals acclimated to high temperature may be more prone to express and fold mutated proteins (thereby limiting the cost of an harmful mutation or taking advantage of a beneficial mutation), extending the range of possible phenotypes of-fered to selection. This can be interpreted as an increase in robustness or in evolvability: one may consider the ability to express a given pheno-type even with a genopheno-type altered by mutations (increased robustness) or
the increased tolerance to unstable proteins caused by mutations possi-bly conferring a selective advantage despite of lower stability (increased evolvability).
1 . 1 . 3 adaptation to high temperature in evolu tionary experiments
Although Darwin originally stated that evolution by means of natu-ral selection proceeds in small steps and is a very slow process, he al-ready suggested that the relevant timescale for adaptation is the number of generations (Darwin, 1859). Following this idea, it is possible to study adaptation in controlled laboratory experiments provided the organisms reproduce fast enough. Doing so, one can follow Gould’s idea of
“replaying life’s tape. You press the rewind button and, mak-ing sure you thoroughly erase everythmak-ing that actually hap-pened, go back to any time and place in the past. Then let the tape run again and see if the repetition looks at all like the original” (Gould, 1989).
Since unicellular organisms can be kept frozen, the experimental evolu-tion approach has become more and more popular since the 1980’s as it allows to store “fossil records” of ancestral states and to revive them in order to compare them with evolved states.
In more details, experimental studies of evolution are conducted in two steps (Elena and Lenski, 2003). In a first time, several populations of interest are grown during a large number of generations (typically ca. 10 per day over a few months) in a controlled environment starting from the same ancestral clone. Selective pressures can be introduced by modi-fying the environmental conditions relative to the ancestor environment. From time to time, samples are frozen and kept as “fossil records”. In a second time, phenotypic modifications due to evolution are assessed by comparing the evolved lines with ancestors or earlier states of evolution revived from frozen samples. As a typical example, the relative fitness of the evolved line relative to the ancestor is assessed by measuring the growth rate ratio of the two lines in a mixed culture; the use of neutral genetic markers allows to distinguish between them.
The most famous study in this field is the “Long Term Evolutionary Experiment” conducted by Lenski’s laboratory over more than twenty years (more than 50 000 generations) on the adaptation of E. coli to a low-nutrient environment (Lenski, 2004, and http://myxo.css.msu.edu/ for an exhaustive list of more than 50 articles published on this exper-iment). This experiment has shed a new light on the evolutionary dy-namics of adaptation, showing that relative fitness first increases rapidly and then at a much slower pace (Cooper and Lenski, 2000) while the
number of mutations increases linearly with time (Barrick et al., 2009). Surprisingly, among the twelve replicate lineages, five of them acquired a mutator phenotype within the first 30 000 generations (Sniegowski et al., 1997). For a larger overview including metazoan as well, Garland and Rose (2009) expose methods, concepts and advances of experimental evolution.
It is noteworthy that evolutionary experiments with controlled selec-tive pressure were already designed shortly after the publication of the Origins of species (Darwin, 1859). Indeed, communities of unicellular algae with a very short life cycle were evolved during seven years by gradually increasing the temperature. Starting from their usual temper-atures of growth (15○C to 18○C), 23○C was reached rapidly while con-secutive temperature increases (up to 70○C!) required longer time steps (Dallinger, 1887). These long steps could be interpreted nowadays as the time required to fix mutations allowing to increase thermotolerance. In addition, strong trade-offs were reported with strains growing above 60○C being unable to grow at the initial temperature (15○C). Surprisingly, no overall decrease in the tolerable rate of temperature increase was ob-served (Fig. 1.5). Eventually the setup and evolving lines were destroyed in an accident and although Dallinger claimed he restarted his experi-ment, no further publication mentions any subsequent observation. At that time, the main interest was to show adaptive evolution in action as a support to Darwin’s theory; the description of evolution in this context was then not conceptually different from the one in natural populations. In particular, several species were mixed in the same culture that was not kept sterile and no indication regarding medium renewal or population size are provided.
1 . 1 . 3 . 1 Adaptation of survival and growth to high temperature
In addition to Dallinger’s early attempt to select for individuals grow-ing at higher temperature than their ancestral niche, more recent ex-periments have been run in Bennett’s laboratory using conditions and strains similar to Lenski’s experiment. Adaptation of E. coli to a change in temperature was studied both after a temperature shift or in alternated regime: after 2000 generations of adaptation to a low nutrient medium at constant temperature of 37○C, bacteria were propagated by daily se-rial dilutions in the same medium at 32, 37 or 42○C, or alternating daily between 32 and 42○C (Bennett et al., 1992).
The relative fitness to the ancestor (assessed at the adaptation tempera-ture) increased in all conditions and did so more rapidly at 42○C (Fig. 1.6 left). However the absolute fitness (as estimated by the growth rate) did not significantly change in all conditions and over the whole range of temperature of growth between 12 and 44○C (Fig. 1.6 right; Bennett and
Time (years) Temperature (°C) 20 30 40 50 60 70 0 1 2 3 4 5 6 7
Figure 1.5: Adaptation to high temperature in green algae (after Dallinger, 1887). A mixed community of green algae was propagated during nearly 7 years at its maximum growth temperature. Based on the growth per-formance of three given species (estimated by microscopical obser-vations), temperature was increased in small steps from 15 to 70○C. Left: Thermostatic water bath devised for this experiment in which the amount of gas provided to the burner is controlled by a mercury column. Temperature accuracy and stability are better than 1○C. Right: Maximal growth temperature dynamics over time. Using Dallinger’s description, it is possible to plot the temperature of growth against time during the experiment. When the detailed steps are not mentioned in the text, a dotted line is drawn instead. At the end, the text does not allow to plot the real temporal dynamics as indicated by a grey line. Arrows highlight two events where tem-perature was modulated by 1○C over several weeks before normal growth could be recovered.
Lenski, 1993). This difference between relative and absolute fitness evolu-tion can be interpreted as an improvement of resource usage with growth rate being unchanged due to physiological constraints.
Not much emphasis was put on survival at higher temperature in this study and no increase of the thermal niche upper limit was observed. However mutants with heritable thermotolerance at 44○C appear more frequently in the lines evolved at 42○C than in other conditions (Mon-gold et al., 1999). Since survival is estimated over days (as the popula-tions ability to maintain), growth and survival cannot be disentangled as causes of this increased evolvability at the niche limit.
More in line with early Dallinger’s experiment, Pseudomonas pseudoal-caligenes has been cultivated during 10 months at increasing temperature: starting from 41○C, temperature was raised by 1○C per month up to 44○C and by 1○C every two months up to 47○C. The ancestral strain grows very slowly at 45○C and not at 46○C. After adaptation, evolved bacteria grow
Figure 1.6: Relative and absolute fitness changes in a temperature adaptation experiment with E. coli over 2000 generations.
Left (after Bennett et al., 1992): Direct fitness response of each group over 2000 generations of experimental evolution at constant 32, 37, or 42○C or alternating 32/42○C. Fitness is expressed relative to the common ancestor, and was assayed for each group under its own experimental temperature regime. Each point is the mean fitness of six replicate lines; the error bars show the 95 % confidence interval. Dotted lines show the ancestral fitness, dashed lines give the average of the linear regressions for the six replicate lines and solid curves represent a fit of the mean fitness trajectory to a sigmoidal model. Right (after Bennett and Lenski, 1993): Mean absolute fitnesses of the common ancestor (asterisks), 32○C group (downward triangles), 37○C group (circles), 42○C group (upward triangles), and 32/42○C group (diamonds) between 12 and 44○C. Malthusian parameter equals 0 day−1indicates persistence in daily serial dilution culture; −4.6 day−1 corresponds to dilution without any growth or death. Means are calculated from six replicate lines for each condition (ex-cept the common ancestor, for which the mean is based on the two marker variants). Absolute fitness did not differ significantly be-tween conditions at any assay temperature.
Figure 1.7: Absence of evolutionary trade-offs in E. coli adaptation to con-stant temperatures over 2000 generations (after Bennett and Lenski, 1993).
Mean fitnesses of the evolved groups relative to the common an-cestor are assayed by competition experiments at different temper-atures. Means are calculated from six replicate lines for each condi-tion and the color indicates whether the mean relative fitness is sig-nificantly different from 1 (red for p < 0.001, light red for 0.001 < p < 0.01, pink for 0.01 < p < 0.05 and black for p > 0.05). In con-stant temperature regimes, no difference appears to be significant at non-adaptive temperature while there is significant adaptation in all conditions, indicating the absence of trade-off.
at 45○C with shorter lag and higher growth rate and yield than the ances-tor (Shi and Xia, 2003). Unfortunately, as bacteria have been propagated in solid medium and are of different species and as there is no measure of relative fitness, this study is difficult to relate to results on E. coli men-tioned earlier in this section.
1 . 1 . 3 . 2 Trade-offs in adaptation to high temperature
Bennett and Lenski (1993) reports no significant trade-off in temper-ature of adaptation after 2000 generations (Fig. 1.7): increase in relative fitness is significant at adaptation temperature but variations (and poten-tial decrease) at other temperatures are not, meaning that the improve-ment selected at a given temperature does not come at a cost at other temperatures. Similarly, in P. pseudoalcaligenes, increase in growth rate at 45○C does not impair growth at 35○C (Shi and Xia, 2003).
However, after 2000 generations of adaptation at 20○C, E. coli shows significant trade-off between relative fitness at 20○C (ca. 1.1) and at 40○C (ca. 0.8) (Mongold et al., 1996). This trade-off was confirmed later on al-though no quantitative association was shown between fitness increase at low temperature and decrease at high temperature (Bennett and Lenski,
2007). Moreover massive trade-offs are reported in a qualitative manner by Dallinger (1887): algae evolved at 70○C are no longer able to grow at 15.5○C while the ancestral line dies if taken from 15.5○C to 65.5○C. Consequently trade-offs may depend on the selective pressure and on the species of interest and are probably more likely to appear along with more substantial changes acquired over long times.
Another kind of trade-off has been considered in these experiments: does adaptation to a given constant temperature affect the ability to adapt to another temperature? It is mentioned above that in Bennett’s experi-ment, thermotolerant mutants are more likely to arise at 44○C than in the 42○C condition. In addition, they investigated why these mutants were not selected at 42○C and showed that they have a lower relative fitness at maximal growth temperature (around 41 − 42○C) than the evolved strain they are derived from (Mongold et al., 1999).
Subsequent experiments showed no growth predisposition or disad-vantage of the past temperature selection regime when adapting E. coli at 20○C during 2000 generations (Mongold et al., 1996).
In natural thermophile populations, in the water surrounding geysers, trade-offs between growth rate at high and low temperature have been re-ported. Related lineages of one given cyanobacteria population sampled along a thermal gradient show significant variations in growth rate, with higher values in their thermal niches and lower values elsewhere (Miller et al., 2009).
1 . 1 . 3 . 3 Genetic modifications following adaptation to high temperature While full-genome sequencing analysis of strains adapted to high tem-perature are still under work, two different genomic approaches give some insight on the genetic basis of adaptation:
– DNA arrays allow to study genome rearrangement. Several duplica-tions were observed repeatedly and interpreted as a way to increase the level of gene expression (Riehle et al., 2001) although this was not confirmed in further studies (Riehle et al., 2003).
– DNA microarrays reveal that 12 % of whole genome expression is modified with 39 genes being modified repeatedly in different repli-cates. Among those are found stress response and heat-inducible genes (Riehle et al., 2005).
Unfortunately, no dynamics of these changes over time is available. It would be very interesting to see if gradual steps of evolution as reported by Lenski and Travisano (1994) and Elena et al. (1996) for adaptation to low nutrient environment and by Dallinger (1887) for adaptation to high temperature coincide with fixation of new mutations.
A recent molecular evolution study focuses on substitutions during E. coli adaptation to increasing temperature from 37○C to 45○C by 2○C steps (Kishimoto et al., 2010). Interestingly, there is a transition from positive to neutral selection of substitutions during the experiment. In addition, even in the positive selection phase, there is no clear correlation between the rate of fitness increase and the rate of substitution fixation.
1 . 1 . 3 . 4 Alterned selection at different temperatures
Alternated temperature regimes allow to address two related issues: what drives adaptation toward specialist vs. generalist types? Is it pos-sible to select for more efficient acclimation as one pospos-sible generalist strategy?
In the alternated regime of Bennett’s experiment, bacteria were switched daily from 32 to 42○C over 2000 generations. Compared with constant temperature regimes, these evolved lines show significant rela-tive fitness increase along all the range of temperatures of growth (no-tably at 27 and 37○C) while the lines evolved at a constant temperature only show an increase in relative fitness in their own niches (Bennett and Lenski, 1993) ( Fig. 1.7). These data suggest that alternated regime selects for generalists while constant selection favors specialists. Interestingly, adaptation was not slowed down by this alternance of selective pressure; although slower adaptation may be expected with goals in opposite direc-tions, alternating selective pressures have rather been proposed to fasten adaptation by reducing the probability to be trapped in a local adaptation optima (Kashtan et al., 2007).
Subsequent analysis of the lines evolved in this alternated regime iden-tified that adaptation occurs mostly at constant temperature and that no or very limited improvement in the ability to face temperature change oc-curred (Leroi et al., 1994a). It is worth asking how these results would be affected by different alternance frequencies. More frequent transitions could favor selection of improved response to environmental switches themselves.
1 . 1 . 4 acclimation to temperature variations: effects of temperature history
Although it has been overlooked for long times, bacteria growth and survival at high temperature depend on the previous temperatures expe-rienced by the cells. This additional parameter, referred to as tempera-ture history, is critical as it shapes how much acclimation occurs. In this section, I review experiments addressing the impact of acclimation on survival and growth at high temperature, which special attention to
tem-perature history. Emphasis is given to strains and growth conditions as they may partly explain the contrasted results reported here.
1 . 1 . 4 . 1 Acclimation & survival at high temperature
Survival to high temperature depends on the physiological state of bac-teria, in particular it is lower in exponential phase than in stationary phase. In E. coli H-52 grown in milk, this difference in survival between exponential and stationary phases is stronger when bacteria are grown below the optimal growth temperature at 28○C than above it at 38.5○C (Elliker and Frazier, 1938). In another experiment, exponentially grow-ing E. coli MC4100 cells treated at 43○C during 20 min survive a 30 min heat shock at 50○C while cells in exponential phase growing at 37○C die (Shigapova et al., 2005). In stationary phase, more detailed descriptions are available:
– Survival to heat shock at 57.5○C increases with temperature of growth (6-fold increase between 10 and 42○C) in E. coli W3110 grown in tryptone soya broth supplemented with yeast extract (Ce-brián et al., 2008). No acclimation is observed below 30○C.
– E. coli H-52 grown in milk survive better to a 30 min heat shock at 53○C when preliminarily incubated above the optimal growth tem-perature than below: survival reaches almost 70 % at 38.5○C while it is as low as 15 % at 28○C (Elliker and Frazier, 1938).
– Survival to heat shock at 50○C is almost twice higher for bacte-ria grown at 41.5○C than at 32○C with E. coli B in Davis minimal medium (DM) (Leroi et al., 1994b).
– Survival to heat ramp from 30 to 55○C for E. coli MG1655 grown in Brain Heart Infusion broth is claimed to be accurately described from heat shock survival data assuming (i) no growth occurs, (ii) inactivation by temperature starts from 49.5○C and (iii) heat resis-tance does not increase due to gradual temperature change (from 0.15 to 1.64○C/min) (Valdramidis et al., 2006). This is interpreted as a demonstration of limited acclimation to heat stress in station-ary phase. However, direct survival rate estimation using their data suggests that death rate increases with slope and almost doubles be-tween 0.15 to 1.64○C/min.
– E. coli MM28 grown in Luria Bertani rich medium (LB) at 30○C survive better a one hour heat shock at 50○C when temperature increases slowly (0.5○C/min) than after instantaneous heat shock (Guyot et al., 2010). This is a marked effect as survival rate is 90 × higher. Interestingly the primary cause of mortality is the loss of envelope integrity as shown by permeability and membrane fluid-ity measurements. Moreover this increase relies on protein synthe-sis during the heat treatment resulting in higher membrane
stabil-ity rather than in expression of heat-inducible chaperones and pro-teases.
Beyond the strain and media differences, the contrasted results re-ported by the latter studies are worth commenting: differences are likely due to the different target temperatures and also to the different temper-ature variation rates considered. This suggests that above a certain tem-perature, acclimation is of limited help for the cell and that it is a very rapid response, occurring in less than 15 min (as shown by 1.64○C/min increase from 30 to 55○C).
Interestingly, the acquisition of thermotolerance can be induced by other stresses. For instance, Salmonela typhimurium survival after heat shock at 50○C is markedly increased when grown at high osmolarity with 0.3 M NaCl (Fletcher and Csonka, 1998). Similarly, in exponentially growing E. coli, acclimation to high temperature can be obtained with benzyl alcohol, an amphiphilic molecule that fluidize the membrane. This occurs quicker than required for benzyl alcohol to activate σ32and the heat shock response (Shigapova et al., 2005). It is interpreted as a non-transcriptional regulation mechanism in which membrane fluidiza-tion (by chemical or heat) may be sufficient to induce a rapid remodeling of membrane composition conferring short-term bacterial thermotoler-ance.
1 . 1 . 4 . 2 Acclimation & growth at high temperature
In a non-lethal temperature range, during competition at 32○C, mation to this temperature confers a competitive advantage over accli-mation to 41.5○C. However, the contrary is not true: bacteria acclimated at 41.5○C are outcompeted at this temperature by bacteria acclimated at 32○C (Leroi et al., 1994b). This results obtained with E. coli B grown in
DMare interpreted in terms of cost of heat-inducible proteins synthesis that would be disadvantageous at low temperature.
Probably due to the complex interplay of death and growth at high temperature, very little is known about growth of mesophile bacteria at high temperature. When pre-heated during 24 hours at 45○C, E. coli MG1655 achieves exponential growth up to 46○C while it grows expo-nentially only up to 44○C when precultured at 37○C (van Derlinden et al., 2008).
More striking acclimation has been reported when using very slow temperature ramps. When grown inLB with daily 10 × serial dilution and temperature increasing from 37○C at 2○C/day, E. coli MM28 grows repeatedly up to 50○C and occasionally up to 54○C; above this tempera-ture, growth is too slow to compensate dilution (Guyot, 2007). In con-trast, in absence of acclimation, growth is not possible above 42○C. This growth at high temperature is likely to be due to acclimation rather than