HAL Id: hal-00330788
https://hal.archives-ouvertes.fr/hal-00330788
Submitted on 26 Sep 2005HAL is a multi-disciplinary open access
archive for the deposit and dissemination of sci-entific research documents, whether they are pub-lished or not. The documents may come from teaching and research institutions in France or abroad, or from public or private research centers.
L’archive ouverte pluridisciplinaire HAL, est destinée au dépôt et à la diffusion de documents scientifiques de niveau recherche, publiés ou non, émanant des établissements d’enseignement et de recherche français ou étrangers, des laboratoires publics ou privés.
Stratified analysis of satellite imagery of SW Europe
during summer 2003: the differential response of
vegetation classes to increased water deficit
A. Lobo, P. Maisongrande
To cite this version:
A. Lobo, P. Maisongrande. Stratified analysis of satellite imagery of SW Europe during summer 2003: the differential response of vegetation classes to increased water deficit. Hydrology and Earth System Sciences Discussions, European Geosciences Union, 2005, 2 (5), pp.2025-2060. �hal-00330788�
HESSD
2, 2025–2060, 2005 NDVI of vegetation classes during increased water deficit A. Lobo and P. Maisongrande Title Page Abstract Introduction Conclusions References Tables Figures J I J I Back CloseFull Screen / Esc
Print Version Interactive Discussion
Hydrol. Earth Sys. Sci. Discuss., 2, 2025–2060, 2005 www.copernicus.org/EGU/hess/hessd/2/2025/
SRef-ID: 1812-2116/hessd/2005-2-2025 European Geosciences Union
Hydrology and Earth System Sciences Discussions
Papers published in Hydrology and Earth System Sciences Discussions are under open-access review for the journal Hydrology and Earth System Sciences
Stratified analysis of satellite imagery of
SW Europe during summer 2003: the
di
fferential response of vegetation
classes to increased water deficit
A. Lobo1and P. Maisongrande21
Institut de Ci `encies de la Terra “Jaume Almera” (CSIC), Barcelona, Spain 2
Centre d’Etudes Spatiales de la BIOsph `ere (CESBIO), Toulouse, France
Received: 18 July 2005 – Accepted: 12 September 2005 – Published: 26 September 2005 Correspondence to: A. Lobo ([email protected])
HESSD
2, 2025–2060, 2005 NDVI of vegetation classes during increased water deficit A. Lobo and P. Maisongrande Title Page Abstract Introduction Conclusions References Tables Figures J I J I Back CloseFull Screen / Esc
Print Version Interactive Discussion Abstract
The extraordinarily warm and dry summer experienced in SW Europe in 2003 provides an interesting case study for the analysis of the response of regional-scale vegetation variables to drier and hotter conditions. SW Europe includes a boundary between phy-togeographic and climatic regions (Oceanic and Mediterranean) that differ in terms of
5
summer precipitation, which let us compare the response of different vegetation types. In addition, some scenarios predict summer conditions such as those of 2003 to be common by the latter decades of the 21st century in this region. We have analyzed a monthly series of regional fields of normalized difference vegetation index from the VEGETATION-SPOT5 instrument, from 1999 to 2003. We show that negative
anoma-10
lies of vegetation index in summer 2003 were larger for herbaceous vegetation of the Oceanic climate region and for deciduous forests. The vegetation index of August 2003 in the Mediterranean climate region was also significantly lower than normal values in August 1999–2002, albeit the anomalies were small in absolute value. We compared August NDVI, as a measure of the vegetation response, to the difference between
to-15
tal summer precipitation and total summer potential evapotranspiration, as a measure of atmospheric water stress. Our results indicate that water stress is a major factor structuring the geographic variability of NDVI in this region. In accordance with these results, the analysis of the data of 2003 indicate that the increased water stress was a key factor of the observed anomalies of vegetation index.
20
1. Introduction
The productivity of a significant 40% of the continental Biosphere is limited by water availability, while a 30% is limited by temperature (Nemani et al., 2003). The impor-tance of the relationships between water availability and vegetation has been tradition-ally recognised in Mediterranean and other arid regions and has become a subject of
25
HESSD
2, 2025–2060, 2005 NDVI of vegetation classes during increased water deficit A. Lobo and P. Maisongrande Title Page Abstract Introduction Conclusions References Tables Figures J I J I Back CloseFull Screen / Esc
Print Version Interactive Discussion
Rodr´ıguez-Iturbe and Porporato, 2004).
At a regional level, events such as the warm and dry summer 2003 in SW Europe of-fer an interesting opportunity for the analysis of the response of vegetation to increased water stress from satellite imagery. Most studies dealing with summer 2003 have fo-cused on the exceptionality of the high temperatures (i.e., Black et al., 2004; Chuine et
5
al., 2004), on the possible relationships to global change (Beniston, 2003), and on hu-man influences on increasing the probability of these events (Stott et al., 2004). In this article we focus on the differential responses of vegetation classes to increased water stress in an area that is climatically characterised by a strong gradient in moisture and with a prominent boundary between phyto-geographic regions.
10
2. Methods
We compiled a climate and meteorological data set from different sources. For Spain, the Instituto Nacional de Meteorolog´ıa (INM) provided a climate data set (1961–2000) of monthly mean temperature and total precipitation as grids of 5 km×5 km resolution in UTM projection. INM also provided a grid of 25 km×25 km of daily values of
max-15
imum temperature, minimum temperature and precipitation for June, July and August 2003, from which we calculated monthly mean temperature and monthly precipitation fields for the three months. We sub-sampled the climate data set to a 25 km×25 km grid and re-projected both data sets to a grid of 100 in geographic coordinates using a GIS (TNTmips). For France we obtained a climate data set of monthly mean
tem-20
perature and total precipitation for 142 stations (period 1961–1990) from the Universit ´e de Lyon (Gagnard, 1996), and monthly data for June, July and August 2003 from 110 stations. We selected the 85 common stations in both data sets and calculated, for each month, a grid of 100 of resolution using the algorithm of bicubic spline interpola-tion (Akima, 1996) from package “akima” in the statistical software R (R Development
25
Core Team, 2004). Finally, we used the GIS to make a mosaic of the data of France and Spain. This way, we produced common climate fields of mean temperature and
HESSD
2, 2025–2060, 2005 NDVI of vegetation classes during increased water deficit A. Lobo and P. Maisongrande Title Page Abstract Introduction Conclusions References Tables Figures J I J I Back CloseFull Screen / Esc
Print Version Interactive Discussion
total precipitation for June, July and August and for the same months and variables for 2003. We presume the difference in the periods used to calculate the climatology to be a minor problem compared to the exceptionality of summer 2003. The difference in interpolation methods and the fact that we used an “all statistical” algorithm for the interpolation probably had more impact in the quality of the product. Nevertheless, we
5
use our geographic fields as an aid to interpret the surface dynamics observed in the satellite imagery, and we consider them satisfactory for this purpose.
We calculated geographic fields of potential evapotranspiration (PET) according to Thornwaite (Thornwaite and Mather, 1957; Custodio and Llamas, 1983) and of the difference between monthly precipitation and evapotranspiration (P-PET). We used
10
P-PET as an estimate of the atmospheric balance between water supply and water demand. We selected the field of total summer P-PET (and its anomaly) as the most meaningful description of the limits set by the atmosphere to vegetation growth during summer in the region.
Under average conditions, P-PET is negative in most of the region of study, with a
15
prominent NS gradient that is interrupted by the transversal mountain ranges (Fig. 1). The contour line of −200 mm summer P-PET is close to a major phyto-geographic boundary in the region, with Mediterranean vegetation to the South and Euro-Siberian vegetation (in the terminology of Iberian phytogeographers, Rivas-Mart´ınez et al., 2004) to the North. The Euro-Siberian region approximately includes the Temperate
20
and Boreal vegetation regions in the terminology of Bohn et al. (2003). In any case, this vegetation boundary essentially corresponds to the boundary between climatic classes Cs (Mediterranean, temperate with dry summer) and Cf (Oceanic, temperate humid with minimum of precipitation in summer) in the K ¨oppen system.
To assess the response of the vegetation, we used fields of the Normalized Di
ffer-25
ence Vegetation Index (NDVI, Tarpley et al., 1984) included in the S10 products that are derived from images acquired by the VEGETATION instrument onboard satellite SPOT. VEGETATION is an optical multi-spectral instrument that acquires a daily and almost complete cover of the Earth surface at 1 km2 resolution in four spectral bands
HESSD
2, 2025–2060, 2005 NDVI of vegetation classes during increased water deficit A. Lobo and P. Maisongrande Title Page Abstract Introduction Conclusions References Tables Figures J I J I Back CloseFull Screen / Esc
Print Version Interactive Discussion
(Hagolle et al., 2003). S10 products are calibrated, atmospherically and geometrically corrected images. NDVI is a common index that makes a normalized contrast between near infrared and red reflectance and, thus, emphasizes the presence of green veg-etation in the pixel. NDVI integrates both the abundance of green vegveg-etation and its greenness, which creates certain ambiguity. Notwithstanding, and in particular if time
5
series are available, NDVI is a linear estimate of the fraction of photosynthetically ac-tive radiation (PAR) that is intercepted by the photosynthesizing tissue of vegetation present in the pixel, provided that certain constraints on background, solar and view angles, and atmospheric transparency are fulfilled (Myneni and Williams, 1994).
An important feature of the VEGETATION S10 collection is that it does not include
10
daily images but temporal composites. The term composite refers to the fact that daily images for a short period of time are combined to create a synthetic reconstruction that is assumed to be representative of the period, which in this case is of 10 days. The goal of the compositing is to produce a data set of cloud-free images, at the expense of losing temporal resolution. The method that is used to produce each composite in the
15
S10 data set is the Maximum Value Composite (MVC, Holben, 1986), which consists on selecting, for each pixel, the date of the maximum NDVI value among the 10 daily images. Each composite image is, thus, a synthesis in which pixels have values drawn from images of different days within the given period. While the MVC is effective, simple and fast, it has a number of problems and alternative compositing methods have been
20
implemented (see Hagolle et al., 2005, for a review of the problems and a modern alternative method). Nevertheless, MVC is the only method currently implemented in the processing chain of the S10 collection and, despite some problems, time series of NDVI composites produced by the MVC method have proven to be a source of valuable information for monitoring surface dynamics at global and regional scales (i.e., Zhou et
25
al., 2001; Lucht et al., 2002; Nemani et al., 2003).
We used a dataset of S10 products from 1999 to 2003 of the region from 52◦400N, 11◦00W to 30◦210N, 6◦510E, with a resolution of 3200. We computed an average annual series of monthly mean NDVI images for the period 1999 to 2002, which we use as
HESSD
2, 2025–2060, 2005 NDVI of vegetation classes during increased water deficit A. Lobo and P. Maisongrande Title Page Abstract Introduction Conclusions References Tables Figures J I J I Back CloseFull Screen / Esc
Print Version Interactive Discussion
the “normal” reference, and an annual series of monthly mean NDVI images for 2003. Also, we calculated the images of NDVI anomaly of June, July and August 2003.
In order to analyze the response to water stress of different vegetation types, we dis-criminated among herbaceous vegetation, broadleaf deciduous forest and broadleaf evergreen forest. For this we used the Corine Land Cover 2000 (CLC2000; http:
5
//terrestrial.eionet.eu.int/CLC2000; B ¨uttner et al., 2004) vectorial map of France, Spain and Portugal. According to the legend definitions, we selected land cover classes “Non-irrigated arable land” and “Pastures”, as herbaceous vegetation, on one hand, and “Broadleaf forests” on the other. CLC2000 classes “Annual crops associated with permanent crops” and “Complex cultivation patterns” include herbaceous vegetation
10
to some extent, but they are too heterogeneous and were not considered. We further subdivided the “Broadleaf class” into evergreen and deciduous. For Spain, the Instituto Geogr ´afico Nacional provides a CLC2000 version with a higher level legend in which both types of broadleaf forest are discriminated. For France and Portugal we used a digital version of the map of Natural Vegetation and selected as deciduous those
poly-15
gons included in the Euro-Siberian region and as evergreen those polygons included in the Mediterranean region. Although not initially planned, we found, as we proceeded in our analysis, the presence of two classes of herbaceous vegetation that were very dis-tinct in terms of their NDVI vs. P-PET relationships and were geographically clumped. Thus, we decided to further split the herbaceous class into “Summer Herbaceous
Veg-20
etation” and “Spring Herbaceous Vegetation”, in reference to the timing of the annual NDVI maxima (see Results, Sect. 3).
Considering the fact that vegetation responds to cumulated values of atmospheric variables, we devoted particular attention to the total summer P-PET on one hand and to the NDVI of August on the other. We take summer P-PET as a summary of the water
25
stress exerted by the atmosphere on vegetation and the NDVI of August as a descrip-tion of the resulting state of vegetadescrip-tion. We analyzed the reladescrip-tionships between NDVI and P-PET by selecting the values of both variables for all pixels within each vegetation class. By using the geographic variability we were able the full range of the variables in
HESSD
2, 2025–2060, 2005 NDVI of vegetation classes during increased water deficit A. Lobo and P. Maisongrande Title Page Abstract Introduction Conclusions References Tables Figures J I J I Back CloseFull Screen / Esc
Print Version Interactive Discussion
each vagetation class, but at the expense of introducing more variance. Two given pix-els under the same P-PET conditions can have different NDVI values because factors other than P-PET are playing a role in determining the NDVI. Therefore, our task was to search for a trend, in the hope that the influence of summer P-PET in August NDVI is sufficiently relevant as to be identified. We display the NDVI vs. P-PET relationships
5
by grouping P-PET by intervals in boxplots.
3. Results
3.1. Geographic Description
The normal range of summer P-PET in the region shifted from −466.9 mm to 61.4 mm, to −567.5 mm to −13.3 mm (Fig. 1). More than 90% of the region had a negative
10
anomaly of summer P-PET and for 50% of the region the anomaly was more negative than −100 mm. Geographically, the most intense anomaly was found to the E of a virtual line ranging from SW to NE France, while the most extreme absolute values occurred in S Spain, the Ebro valley and the French Mediterranean coast (Fig. 2).
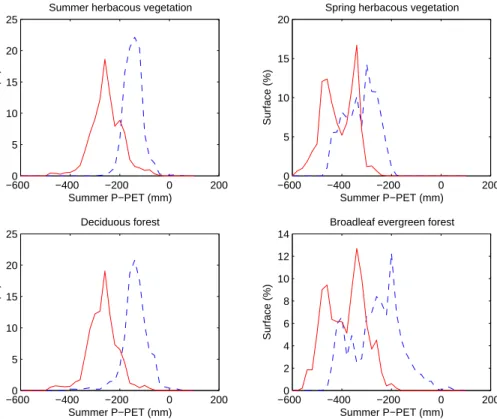
Because of their respective geographic distributions, the four considered vegetation
15
classes were under different anomalies of summer P-PET (Fig. 3). Deciduous for-est was the class for which conditions in summer 2003 were most exceptional, these forests were very much outside their normal range of P-PET. The situation was not as exceptional for broadleaf evergreen forests.
As shown in Fig. 4, a notorious negative anomaly of NDVI was observed in central
20
Spain and SE France in June. This anomaly diminished in most of the Iberian peninsula in July while expanded in France, to occupy the region to the SE of a virtual SW-NE diagonal. The NDVI anomaly became both more acute and more extensive in August, appearing again in Spain from the central part of its Cantabric coast, following the Central mountain range and reaching Portugal, where large scars of extensive fires
25
HESSD
2, 2025–2060, 2005 NDVI of vegetation classes during increased water deficit A. Lobo and P. Maisongrande Title Page Abstract Introduction Conclusions References Tables Figures J I J I Back CloseFull Screen / Esc
Print Version Interactive Discussion
Some areas showed a positive NDVI anomaly in summer 2003. A large one occurred between the North piedmont of the W Pyrenees and the Landes district, where abun-dant soil water and warmer temperatures fuelled vegetation productivity in June. Also, small, scattered patches of positive anomalies can be observed in the highest moun-tains, where temperature is the limiting factor and, despite a severe negative anomaly
5
of P-PET, water availability was still sufficient.
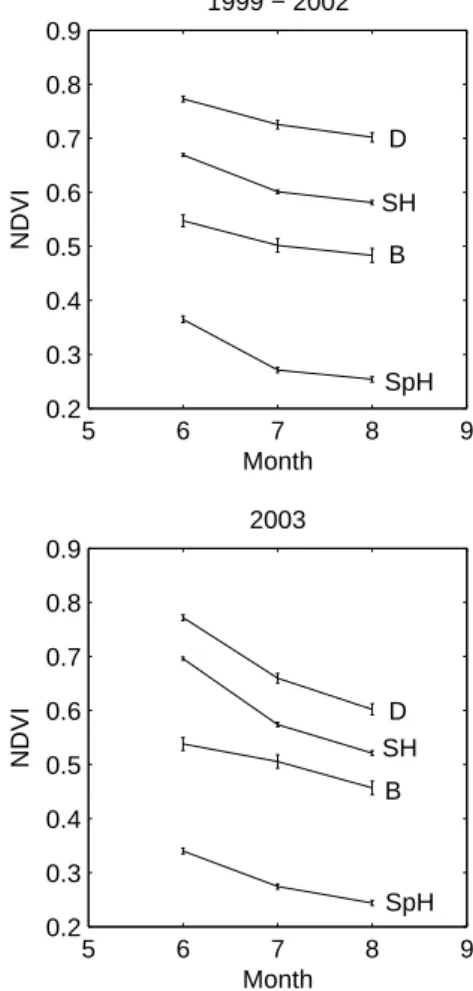
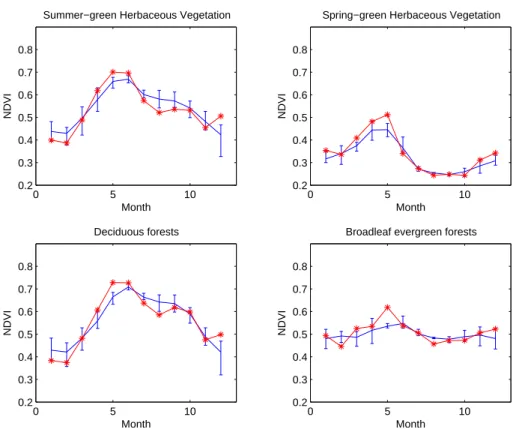
Monthly means of NDVI were different among the considered classes both in the 1999–2002 average summer and in summer 2003 (Fig. 5), which implies that the land cover map is an adequate partition of the NDVI fields. Figure 6 and Table 1 show the exceptional course of monthly NDVI values during summer 2003 averaged for each of
10
the four vegetation types. As we could only use four years (1999–2002) of monthly data of NDVI to establish a reference level, bars in Fig. 4 do not represent standard errors but absolute minimum and maximum values for each month in the period. Note that mean NDVI values in August 2003 were shorter than the minima for the same month in the period 1999–2002 for all vegetation classes, which is most noticeable for the
15
Mediterranean classes (Spring-green herbaceous vegetation and Broadleaf evergreen forest). In absolute terms, anomalies were largely negative for summer-green herba-ceous vegetation and deciduous forests and slightly negative for the Mediterranean classes. Anomalies were positive in June for the Euro-Siberian classes and turned into negative values in July and August. The average anomaly of NDVI of spring
herba-20
ceous vegetation was negative, and its absolute value decreased in July and August as a consequence of the normal decay of NDVI in such vegetation. This behavior is in accordance with the geographic description offered in the previous paragraph.
3.2. Relationship of NDVI to P-PET
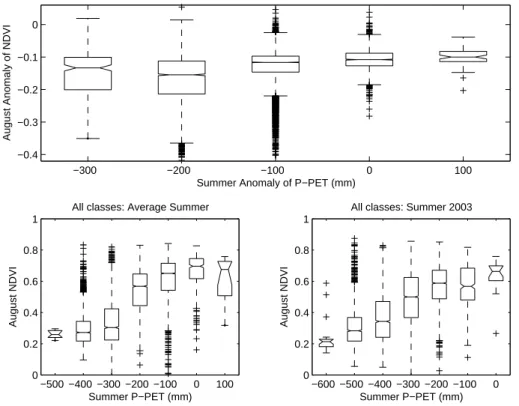
While geographic patterns of the anomaly of NDVI in August and of the anomaly of
25
summer P-PET are visually roughly similar, the regional relationship between both anomalies is weak (R2=0.103): in addition to the anomaly of summer P-PET, many other different factors influence the geographic distribution of the NDVI anomaly. As
HESSD
2, 2025–2060, 2005 NDVI of vegetation classes during increased water deficit A. Lobo and P. Maisongrande Title Page Abstract Introduction Conclusions References Tables Figures J I J I Back CloseFull Screen / Esc
Print Version Interactive Discussion
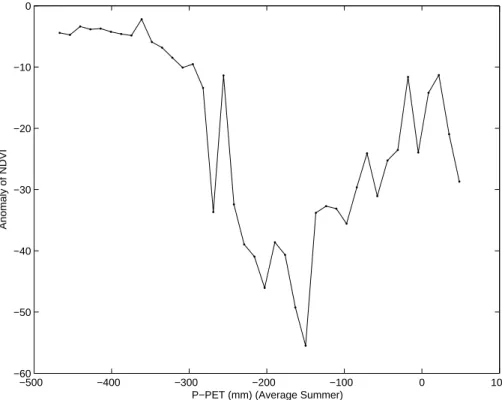
a result, for a given P-PET anomaly, surface responses can be very different and the mentioned relationship has a large scatter. Nevertheless, if values of NDVI anomaly are grouped by intervals of summer P-PET anomaly in a boxplot (Fig. 7), the medians show an increasing trend, except for the most negative P-PET anomalies. Note that two given medians significantly differ if notches in the boxplot do not overlap. We shall see in the
5
following paragraphs this relationship for the different vegetation classes. Beforehand, it is worthwhile noting the stronger linear relationship between actual values of summer P-PET and August NDVI (Fig. 7, R2=0.514), with a discontinuity between −300 and −200 mm that corresponds to the geographic boundary between Mediterranean and Euro-Siberian vegetation. This pattern was disrupted in 2003, when the value of August
10
NDVI that corresponded to a summer P-PET of around −300 mm was higher than would be in an average year. This fact is a consequence of part of the Euro-Siberian vegetation, with higher NDVI values, being under such low P-PET values.
For a given site, the actual NDVI anomaly depends not only on the value of the anomaly of summer P-PET, but also on the normal values of summer P-PET. Figure 8
15
plots the P-PET values of summer 2003 vs. the P-PET values of the average sum-mer, with the color coding being proportional to the NDVI anomaly in August 2003. In addition to the obvious fact that most of the data lie below the 1:1 line implying that P-PET values in 2003 were lower than expected, the color coding reveals that the im-pact in terms of NDVI was higher for areas where water deficit in summer is normally
20
moderate. As an example, NDVI anomalies of two sites with the same P-PET anomaly but with very different normal P-PET are highlighted in Fig. 8: site “A”, which has a P-PET close to −100 mm, has a more negative NDVI anomaly than site “B”, with a higher deficit of P-PET (−400 mm). This relationship between NDVI anomaly and nor-mal summer P-PET is also put in evidence in Fig. 9, which plots the most negative
25
NDVI anomaly values in August across normal P-PET values in summer: the impact of the P-PET anomaly is less acute for sites which are normally humid and for sites which are normally dry. In the first case, water resources were not heavily depleted despite the P-PET anomaly, while in the second case increased drought did not result
HESSD
2, 2025–2060, 2005 NDVI of vegetation classes during increased water deficit A. Lobo and P. Maisongrande Title Page Abstract Introduction Conclusions References Tables Figures J I J I Back CloseFull Screen / Esc
Print Version Interactive Discussion
in further decreased NDVI. 3.2.1. Herbaceous vegetation
Results presented in the Geographic Description highlight the importance of a strat-ified analysis considering the type of land cover. A bivariate histogram of August NDVI vs. summer P-PET made for herbaceous vegetation only (Fig. 10) shows two
5
distinct distributions with clearly different modes, strongly clumped in the geographic space. The lower-left distribution in the bivariate plot corresponds to herbaceous veg-etation with a maximum of NDVI in spring, typical of the Mediterranean region (Lobo et al., 1997): selecting these elements and representing this selection in the geographic space highlights those pixels of herbaceous vegetation that are in the Mediterranean
10
region. The upper-right distribution in the bi-variate plot corresponds to herbaceous vegetation with a summer maximum of NDVI, which is typical of the Western-Atlantic vegetation. As mentioned in Sect. 2, we have actually used this property to further split the herbaceous vegetation class derived from CLC2000 into “spring herbaceous veg-etation” and “summer herbaceous vegveg-etation”, with their names refering to the season
15
of maximum greenness.
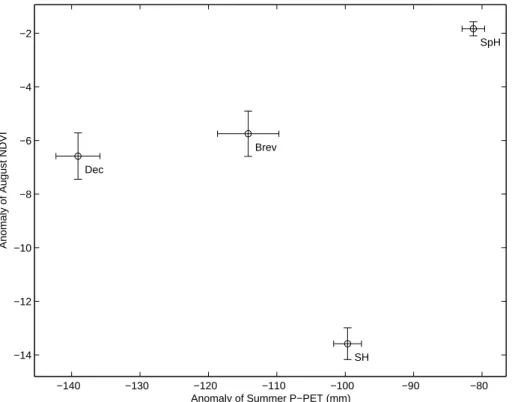
The plot of NDVI anomaly in August vs. anomaly of summer P-PET for each vege-tation class (Fig. 11) shows the contrast between the aforementioned mentioned low sensitivity of spring herbaceous vegetation and the notorious impact on summer herba-ceous vegetation. Such differences are further documented in Fig. 12, which shows a
20
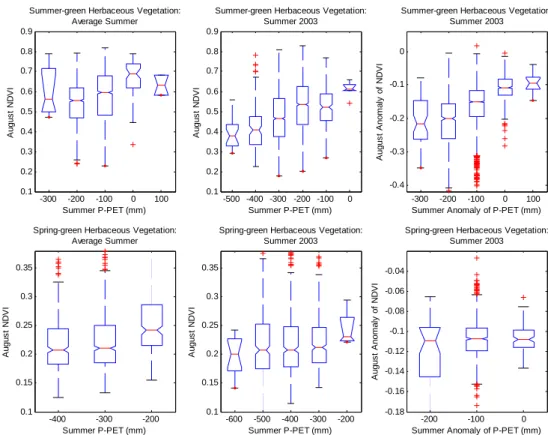
linear trend of NDVI anomaly against anomaly of summer P-PET (R2=0.252) for sum-mer herbaceous vegetation while there is no trend for spring herbaceous vegetation (R2=0.007). The lower sensitivity of spring herbaceous vegetation is an almost trivial consequence of the definition of spring herbaceous vegetation, which shows very low NDVI values in August in the average year and for which further reduced values of
25
summer rain have low impact in terms of August NDVI.
There are also significant differences between August NDVI values grouped by inter-vals of summer P-PET in average years for summer herbaceous vegetation (Fig. 12),
HESSD
2, 2025–2060, 2005 NDVI of vegetation classes during increased water deficit A. Lobo and P. Maisongrande Title Page Abstract Introduction Conclusions References Tables Figures J I J I Back CloseFull Screen / Esc
Print Version Interactive Discussion
although the trend is weakened by values at both extremes of the P-PET axis. Geo-graphically, the lowest box, which has NDVI values higher than expected from the linear trend of the three central medians, corresponds to a small proportion of pixels located in the Mediterranean region and is most likely due to inaccuracies in the discrimination between spring and summer herbaceous vegetation. The highest box, which has NDVI
5
values lower than expected from the linear trend, corresponds to sites in the Alps and the Pyrenees that are limited by temperature.
3.2.2. Broadleaf forests
Figure 11 also shows that, despite being the land cover category experiencing the high-est atmospheric water budget anomaly, the response of deciduous forhigh-ests in terms of
10
NDVI was more moderate than that of summer herbaceous vegetation, as corresponds to the higher resilience of trees and their access to more extensive water supplies. Broadleaf evergreen forests experienced a water budget anomaly higher than herba-ceous vegetation and lower than deciduous forest, with a NDVI response in August that, albeit lower than that of deciduous forests, was still higher than what we initially
15
expected for evergreen vegetation.
Boxplots in Fig. 13 show the relationship between NDVI in August and summer P-PET in average years (R2=0.139) for deciduous forests. The first box, the one for −400 mm, which does not follow the general trend, actually corresponds to semi-deciduous forests in the Iberian peninsula. In contrast to the case for summer
herba-20
ceous vegetation, the relationship between NDVI in August and summer P-PET was different in 2003 than in the average year: deciduous forests experiencing a decreased P-PET in summer 2003 did not simply adjust their NDVI to the corresponding values in the average year. The response was more complex. While there was still a re-lationship between both anomalies, the rere-lationship was weaker (R2=0.034) than for
25
the summer herbaceous vegetation. The most important NDVI impact according to the medians was produced by an anomaly of −100 mm in summer P-PET, but while the other three medians are ordered in accordance to the P-PET axis, they are not
HESSD
2, 2025–2060, 2005 NDVI of vegetation classes during increased water deficit A. Lobo and P. Maisongrande Title Page Abstract Introduction Conclusions References Tables Figures J I J I Back CloseFull Screen / Esc
Print Version Interactive Discussion
significantly different among them. Instead, note that the trend defined by the minima of the boxes (which are the lower quartiles of the distributions) is stronger that that of the medians. A reasonable conjecture for such a difference in the slopes defined by medians and lower quartiles would be that the NDVI response in deciduous forests is complicated by differences in access to soil water stocks: while medians would include
5
this dispersion, lower quartiles would represent the relationship between August NDVI and summer P-PET for those forests with shallower soils and reduced field capacity.
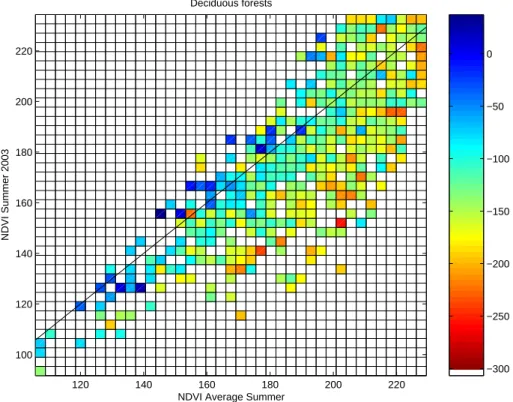
Figure 14 plots NDVI in August 2003 against NDVI of the average August, colored by the value of the summer P-PET anomaly. Sites whose NDVI values are close to the 1:1 line experienced less intense P-PET anomalies, except at the higher extreme
10
of the NDVI axis. Sites whose NDVI in August 2003 were lower than the 1999–2002 average tended to have suffered more intense atmospheric water deficit in 2003 than in the average summer, although the pattern is somewhat disperse. This dispersion is in agreement with the boxplot of anomalies (Fig. 13) and results from factors other than summer P-PET influencing the NDVI values.
15
NDVI values above the 1:1 line, indicating a positive anomaly for August 2003, con-centrate at the high extremes of the axes, for any value of P-PET. A plausible conjecture is again related to differences in soil water resources: forests normally exhibiting higher NDVI values would have access to larger soil water stocks and would have been, thus, unaffected by the decreased P-PET of summer 2003.
20
The dispersion of the response in terms of NDVI is also put in evidence by the trajec-tories in the NDVI vs. P-PET plane for a random sample of pixels of deciduous forests (Fig. 15). Each arrow in this figure starts at the point of the average summer and points towards the point corresponding to summer 2003. It is worthwhile noting that such dispersion of the NDVI response of deciduous forests occurs despite the fact that
sum-25
mer P-PET deficit attained exceptional values that put deciduous forests in the region very much outside their normal range (Fig. 3), suggesting again that soil water stocks buffered the impact of P-PET.
HESSD
2, 2025–2060, 2005 NDVI of vegetation classes during increased water deficit A. Lobo and P. Maisongrande Title Page Abstract Introduction Conclusions References Tables Figures J I J I Back CloseFull Screen / Esc
Print Version Interactive Discussion
August NDVI and summer P-PET in the average year (Fig. 13, R2=0.388). The ob-served relationship is actually tracking the gradient in canopy closure associated to annual P-PET, parallel to the pattern that is observed in other systems, such as along the Kalahari transect (Scholes et al., 2002). As was the case for deciduous forests, the relationship in the average year represents a structural gradient and is disrupted in
5
summer 2003. Our data do not show a relationship between August NDVI anomaly and summer P-PET anomaly for broadleaf evergreen forests, only the median of the box of the −200 mm interval is significantly different from the rest, and there is no ordering following the P-PET axis (R2=0.0218).
4. Discussion
10
It is interesting to note that, despite being small in absolute terms, mean NDVI values in August 2003 for both Mediterranean classes (spring herbaceous vegetation and broadleaf evergreen forests) are shorter (more negative) than the minimum for August in the 1999–2002 period. Also, relative values of the anomalies in August calculated in respect to the average August NDVI for the Mediterranean classes are of the same
15
order as the ones for the other two classes. These results indicate that Mediterranean vegetation actually showed a consistent negative anomaly in August 2003, although we have not found any trend between this anomaly and the one of summer P-PET for these classes.
In general, anomalies in time series of NDVI for evergreen vegetation are difficult to
20
analyze, as responses tend to be small and are, thus, difficult to separate from atmo-spheric, angular and other spurious variability in the NDVI time series. Nevertheless, the average anomaly detected in August for broadleaf evergreen forests is small but ro-bust, as it is the result of integrating geographically dispersed values, including different atmospheric conditions. This anomaly may actually have been a response of the
frac-25
tion of herbaceous plants within the areas labeled as broadleaf evergreen forest in the land cover map rather than a response of the evergreen trees and shrubs themselves.
HESSD
2, 2025–2060, 2005 NDVI of vegetation classes during increased water deficit A. Lobo and P. Maisongrande Title Page Abstract Introduction Conclusions References Tables Figures J I J I Back CloseFull Screen / Esc
Print Version Interactive Discussion
This hypothesis is supported by the fact that summer P-PET values in 2003 were not so exceptional for broadleaf evergreen vegetation, as shown by the large overlap between the density functions (Fig. 3). Also, broadleaf evergreen forests regularly suffer water stress in summer while keeping their green leaves, therefore the increased stress in summer 2003 may not have affected their NDVI, but the NDVI of the accompanying
5
herbaceous vegetation. Events in which leaves of evergreen trees have been seen to decay involve periods of drought in spring (i.e., Pe ˜nuelas et al., 2001). If the frac-tion of accompanying herbaceous vegetafrac-tion was constant, we could still have found a significant relationship between NDVI anomaly and summer P-PET anomaly, but as this fraction is geographically variable, such a relationship could only be detected if the
10
values of the fraction of herbaceous vegetation were known and factored out.
From the point of view of the impact of the NDVI anomaly for the survival of vege-tation, we must keep in mind that NDVI is not a good indicator of stress for broadleaf evergreens. The fact that NDVI anomaly was small for broadleaf evergreen vegeta-tion does not necessarily imply that these plants were not under stress, just that they
15
were keeping their capacity to intercept PAR. Actually, keeping LAI mostly intact de-spite drought is a fundamental competitive ability of broadleaf evergreen vegetation because these plants can make use of their leaves for light interception and photo-synthesis once the drought is over. Deciduous vegetation, on the other hand, has a limited period to photosynthesize. If leaves of deciduous vegetation fall or decay in
20
summer because of drought and depletion of soil water resources, the losses extend beyond the end of the drought: photosynthesis remains reduced when water becomes available again, this time because there is not sufficient LAI. In this regard, note that according to our data (Table 1) and assuming a normal distribution, an appreciable proportion (∼16%) of the total surface of deciduous forest in our area of study had a
25
NDVI anomaly in August 2003, one standard deviation below the mean anomaly. This implies an anomaly below −0.134, which is below −20.9% of the average NDVI value in August for the 1999–2002 period (0.642). We have to add to this consideration that NDVI is approximately proportional to the fraction of intercepted PAR of the forest, and
HESSD
2, 2025–2060, 2005 NDVI of vegetation classes during increased water deficit A. Lobo and P. Maisongrande Title Page Abstract Introduction Conclusions References Tables Figures J I J I Back CloseFull Screen / Esc
Print Version Interactive Discussion
that the reduction of interception experienced by the trees themselves was proportion-ally higher. Also, by the time leaves decayed because of drought trees had already been under severe stress. In short, at least for a part of deciduous forests, summer 2003 implied a reduction in their photosynthetic period, which could have resulted in a negative carbon balance, depleting their reserves and threatening their survival. We
5
are now approaching the impact on deciduous forests with more detail and are explor-ing by means of the physiologically-based model GOTILWA (Gracia et al., 1999) the medium-term impact of situations such as the one of summer 2003.
5. Conclusions
We have found large anomalies of NDVI in July and August 2003 in summer-green
10
herbaceous vegetation and deciduous forests, and in June for spring-green herba-ceous vegetation. We have also found small but significant anomalies in spring-green herbaceous vegetation and broadleaf evergreen forests in August. The later is no-table, as NDVI values of evergreen vegetation are quite constant. Nevertheless, there are reasons to think that such anomaly might be due to the NDVI of accompanying
15
herbaceous plants rather than a reduction of the NDVI of evergreens.
By comparing the variability of NDVI and P-PET within each vegetation class in 2003, we have found a relationship between the anomaly of August NDVI and the anomaly of summer P-PET for the Euro-Siberian classes but not for the Mediterranean classes. For the summer-green herbaceous vegetation, the relationship consisted in a linear
20
trend, while for the deciduous forests there was a significant difference between those areas under no anomaly and those under negative anomaly.
With the reserve of the short period covered by our NDVI series (1992–2002), we can take the values of average August NDVI and average summer P-PET as an approach to a climatic description of the relationships between vegetation and atmospheric water
25
balance. For herbaceous vegetation, there are two distinct modes in the plane defined by average NDVI in August and average summer P-PET. These two modes are
geo-HESSD
2, 2025–2060, 2005 NDVI of vegetation classes during increased water deficit A. Lobo and P. Maisongrande Title Page Abstract Introduction Conclusions References Tables Figures J I J I Back CloseFull Screen / Esc
Print Version Interactive Discussion
graphically segregated and correspond to spring-green herbaceous vegetation (in the Mediterranean region) and summer-green herbaceous vegetation (in the Euro-Siberian region). In summer 2003, an important part of the summer-green herbaceous vegeta-tion was under P-PET condivegeta-tions that approached those of the Mediterranean region. The response of summer-green herbaceous vegetation was fast, with greatly reduced
5
August NDVI and with a linear trend between both anomalies. NDVI of summer-green herbaceous vegetation did not attain values as low as those characteristic of spring-green herbaceous vegetation for equivalent P-PET, probably because NDVI values in the Mediterranean region are often lowered by incomplete vegetation cover. The reader should recall here the ambiguity that is inherent to NDVI, which combines both
vege-10
tation and soil responses. The relationship between vegetation cover and precipitation is also partially behind the trend relating average August NDVI to average summer P-PET that is present in spring-green herbaceous vegetation, even more so for broadleaf evergreen forests. While a fast response implies reduced plant greenness, a decrease in vegetation cover would be a more complex, longer term response coupled to land
15
use.
Among the four considered classes, deciduous forest was the class that was under the greatest atmospheric anomaly in summer 2003. Compared to herbaceous plants, trees are more stable and the access to more extensive soil water resources gives them a certain margin versus atmospheric water balance. The NDVI anomaly of
de-20
ciduous forests was not, in absolute terms, as notorious as the one of summer-green herbaceous vegetation. Also, there was more scatter in the relationship between the anomalies of August NDVI and summer P-PET in 2003. We hypothesize that such dis-persion is mainly due to the geographic variability of soil water availability. We consider the fact that the lower (more negative) parts of the NDVI anomaly having a more linear
25
relationship to the anomaly of summer P-PET than the medians as a clue for our con-jecture: forests with less soil water holding capacity were more dependent upon P-PET and, for equal P-PET anomaly, experienced a more negative anomaly of NDVI. We plan a direct testing of this conjecture by using regional soil maps and, to overcome the
un-HESSD
2, 2025–2060, 2005 NDVI of vegetation classes during increased water deficit A. Lobo and P. Maisongrande Title Page Abstract Introduction Conclusions References Tables Figures J I J I Back CloseFull Screen / Esc
Print Version Interactive Discussion
certainity that is present in these products, complementing them with more detailed soil information for selected forest sites.
The impact of summer 2003 on deciduous forests deserves further investigation. Our region of study includes the southern boundary of these forests in Europe, a bound-ary that coincides with the one between Euro-Siberian and Mediterranean vegetation
5
and that is under the control of the duration and intensity of water stress, particularly in summer. We have seen that increased water stress resulted in appreciable NDVI decrease and the buffer effect provided by soil water would be less important if sum-mer meteorological conditions such as the one of 2003 became more frequent and soil water was depleted. Such depletion would be accelerated by increased agricultural
10
irrigation. Elucidating the impact of increased water stress in summer for deciduous forests is a fundamental task for conservation management.
Our study indicates the importance of stratifying the analysis of time series of satel-lite observations. Time series of averages from extensive geographic amalgams that mix fundamentally different vegetation strategies may cloud important relationships
be-15
tween the surface and the atmosphere. The stratification created by land cover classes also calls for time series of satellite images with finer resolution, as the spatial grain of the land cover is very fine, at least for our region of study. Finally, our study contributes to emphasizing the relevance and the limitations of NDVI series, and the need of more advanced products derived from satellite imagery. A comparison of our results to those
20
obtained from MODIS imagery would be interesting, and we expect that studies based on Earth observation such as ours will benefit from products of multi-satellite origin such as those currently being developed (i.e., Bacour et al., 2003).
Acknowledgements. The authors thank C. Almarza (Instituto Nacional de Meteorolog´ıa) for
his help with meteorological data of Spain. This research has been supported by projects
25
AMFIBER (REN2001-1841/GLO) of the Ministerio de Educaci ´on y Ciencia of Spain, and HIDROLIM, of the Departament d’Universitats, Recerca i Societat de la Informaci ´o of the Gen-eralitat de Catalunya and R ´egion des Midi-Pyrin ´ees.
HESSD
2, 2025–2060, 2005 NDVI of vegetation classes during increased water deficit A. Lobo and P. Maisongrande Title Page Abstract Introduction Conclusions References Tables Figures J I J I Back CloseFull Screen / Esc
Print Version Interactive Discussion References
Akima, H.: Algorithm 761: scattered-data surface fitting that has the accuracy of a cubic poly-nomial, ACM Transactions on Mathematical Software, 22, 362–371, 1996.
Bacour, C., Baret, F., and Derive, G.: Cyclopes: algorithmic development for estimating bio-physical products from large swath sensors, Proceedings of the International Geoscience
5
and Remote Sensing Symposium (IGARSS), Toulouse, 21–25 July 2003.
Beniston, M.: The 2003 heat wave in Europe: A shape of things to come? An analysis based on Swiss climatological data and model simulations, Geophys. Res. Lett., 31, 18 857–18 861, 2003.
Black, E., Blackburn, M., Harrison, G., and Methven, J.: Factors contributing to the summer
10
2003 European heatwave, Weather, 59, 217–223, 2004.
Bohn, U., Gollub, G., Hettwer, C., Neuhauslova, Z., Schlueter, H., and Weber, H.: Karte der natuerlichen Vegetation Europas. Map of the natural vegetation of Europe, Federal Agency for Nature Conservation, Bonn, 2003.
B ¨uttner, G., Feranec, J., Jaffrain, G., Mari, L., Maucha, G., and Soukup, T.: The European
15
Corine Land Cover 2000 project. 20004, XXth Congress of the International Society for Pho-togrammetry and Remote Sensing, Istanbul, Turkey, 12–23 July 2004.
Chuine, I., Viovy, N., Seguin, B., Daux, V., and Le Roy Ladurie, E.: Historical phenology: grape ripening as a past climate indicator, Nature, 432, 289–290, 2004.
Custodio, E. and Llamas, M. R.: Hidrolog´ıa subterr´anea, Omega, Barcelona, 1983.
20
Eagleson, P.: Ecohydrology. Darwinian expression of vegetation form and function, Cambridge University Press, Cambridge, 2002.
Gagnard, M.: Normales Climatiques 1961/1990, http://perso.wanadoo.fr/meteolyonnaise/
introfrancint.htm, 1996.
Gracia C. A., Tello, E., Sabat ´e, S., and Bellot, J.: GOTILWA: An Integrated Model of Water
25
Dynamics and Forest Growth, in: Ecology of Mediterranean Evergreen Oak Forests, edited by: Rod `a, F., Retana, J., Gracia, C. A., et al., Ecological Studies, Vol. 137, Springer Verlag, Berlin Heidelberg, 163–179, 1999.
Hagolle, O., Nicolas, J. M., Fougnie, B., Cabot, F., and Henry, P.: Absolute Calibration of VEGETATION Derived from an interband method based on the sun glint over ocean, IEEE
30
Trans. Geosci. Remote Sensing, 42, 1–10, 2004.
HESSD
2, 2025–2060, 2005 NDVI of vegetation classes during increased water deficit A. Lobo and P. Maisongrande Title Page Abstract Introduction Conclusions References Tables Figures J I J I Back CloseFull Screen / Esc
Print Version Interactive Discussion and improvement of SPOT/VEGETATION level temporally composited products of remotely
sensed imagery by combination of VEGETATION 1 & 2 images, Remote Sensing of Environ-ment, 94(2), 172–186, 2005.
Holben, B. N.: Characteristics of maximum-value composite images from temporal AVHRR data, Int. J. Remote Sensing, 7, 1417–1434, 1986.
5
Lobo, A., Ib ´a ˜nez, J. J., and Carrera, C.: Regional Scale Hierarchical Classification of Temporal Series of AVHRR Vegetation Index, Int. J. of Remote Sensing, 18, 3167–3193, 1997. Lucht, W. I. Colin Prentice, W. I., Myneni,R. B., Sitch, S., Friedlingstein, P., Cramer, W.,
Bous-quet, P., Buermann, W., and Smith, B.: Climatic Control of the High-Latitude Vegetation Greening Trend and Pinatubo Effect, Science, 296, 1687–1688, 2002.
10
Myneni, R. B. and Williams, D. L.: On the relationship between FPAR and NDVI, Remote Sens. Environ., 49, 200–211, 1994.
Nemani, R. R., Charles, D. Keeling, C. D., Hashimoto, H., Jolly, W. M., Piper, S. C., Tucker, C. J., Myneni, R. B., and Running, S. W.: Climate-Driven Increases in Global Terrestrial Net Primary Production from 1982 to 1999, Science, 300, 1560–1563, 2003.
15
Pe ˜nuelas, J., Lloret, F., and Montoya, R.: Severe drought effects on Mediterranean woody flora in Spain, For. Sci., 47, 214–218, 2001.
R Development Core Team, R: A language and environment for statistical computing, http:
//www.R-project.org, 2004.
Rivas-Mart´ınez, S., Penas, A., and D´ıaz, T. E.: Biogeographic Map of Europe, Cartographic
20
Service. University of Le ´on, Spain,http://www.ucm.es/info/cif/form/maps.htm, 2004.
Rodr´ıguez-Iturbe, I. and Porporato, A.: Ecohydrology of water-controlled ecosysytems, Cam-bridge, 2004.
Scholes, R. J., Dowty, P. R., Caylor, K., Parsons, D. A. B., Frost, P. G. H., and Shugart, H. H.: Trends in savanna structure and composition on an aridity gradient in Kalahari, J. of Veg.
25
Sci., 13, 419–428, 2002.
Stott, P. A., Stone, D. A., and Allen, M. R.: Human contribution to the European heatwave of 2003, Nature, 432, 610–614, 2004.
Tarpley, J. P., Schneider, S. R., and Money, R. L.: Global vegetation indices from NOAA-7 meteorological satellite, J. Clim. Appl. Meteor., 23, 491–494, 1984.
30
Thornwaite, C. W. and Mather, J. R.: Instructions and tables for computing potential evapo-transpiration and water balance, Drexel Institute of Technology, Laboratory of Climatology, Publications in Climatology, 17, 231–615, 1957.
HESSD
2, 2025–2060, 2005 NDVI of vegetation classes during increased water deficit A. Lobo and P. Maisongrande Title Page Abstract Introduction Conclusions References Tables Figures J I J I Back CloseFull Screen / Esc
Print Version Interactive Discussion Zhou, L., Tucker, C. J., Kaufmann, R. K., Slayback, D., Shabanov, N., and Myneni, R. B.:
Variations in northern vegetation activity inferred from satellite data of vegetation index during 1981 to 1999, J. Geophys. Res., 106(D17), 20 069–20 083, 2001.
HESSD
2, 2025–2060, 2005 NDVI of vegetation classes during increased water deficit A. Lobo and P. Maisongrande Title Page Abstract Introduction Conclusions References Tables Figures J I J I Back CloseFull Screen / Esc
Print Version Interactive Discussion Table 1. Monthly anomalies of NDVI during summer 2003 for each vegetation type. Bolded
values indicate monthly means of NDVI in 2003 that were shorter than minimum values in 1999–2002 for the same month. SHV, summer-green herbaceous vegetation; SpHV, spring-green herbaceous vegetation; Dec, deciduous forests; Brdevg, broad-leaf everspring-green forests.
June June 2003 July July 2003 August August 2003
1999–2002 1999–2002 1999–2002
Anomaly Anomaly Anomaly
Vegetation Mean Mean Mean Mean Mean Mean Mean Mean Mean Mean Mean Mean
type NDVI NDVI (%) NDVI NDVI (%) NDVI NDVI (%)
SHV 0.669 0.696 0.027 4.0 0.601 0.574 −0.027 −4.5 0.581 0.521 −0.060 −10.3
SpHV 0.365 0.340 −0.025 −6.8 0.271 0.274 0.003 1.2 0.254 0.244 −0.010 −4.0
Dec 0.709 0.727 0.018 2.6 0.664 0.637 −0.027 −4.0 0.642 0.585 −0.057 −8.9
HESSD
2, 2025–2060, 2005 NDVI of vegetation classes during increased water deficit A. Lobo and P. Maisongrande Title Page Abstract Introduction Conclusions References Tables Figures J I J I Back CloseFull Screen / Esc
Print Version Interactive Discussion Fig. 1. Potencial Evapotranspiration for the summer (June to August) in mm. Left, average
HESSD
2, 2025–2060, 2005 NDVI of vegetation classes during increased water deficit A. Lobo and P. Maisongrande Title Page Abstract Introduction Conclusions References Tables Figures J I J I Back CloseFull Screen / Esc
Print Version Interactive Discussion Fig. 2. Anomaly of Potencial Evapotranspiration (summer 2003).
HESSD
2, 2025–2060, 2005 NDVI of vegetation classes during increased water deficit A. Lobo and P. Maisongrande Title Page Abstract Introduction Conclusions References Tables Figures J I J I Back CloseFull Screen / Esc
Print Version Interactive Discussion −6000 −400 −200 0 200 5 10 15 20 25 Summer P−PET (mm) Surface (%)
Summer herbacous vegetation
−6000 −400 −200 0 200 5 10 15 20 Summer P−PET (mm) Surface (%)
Spring herbacous vegetation
−6000 −400 −200 0 200 5 10 15 20 25 Summer P−PET (mm) Surface (%) Deciduous forest −6000 −400 −200 0 200 2 4 6 8 10 12 14 Summer P−PET (mm) Surface (%)
Broadleaf evergreen forest
Fig. 3. Density plots of the abundance of each vegetation class along the P-PET gradient. Continuous line, summer 2003; broken line, average summer (1999–2002).
HESSD
2, 2025–2060, 2005 NDVI of vegetation classes during increased water deficit A. Lobo and P. Maisongrande Title Page Abstract Introduction Conclusions References Tables Figures J I J I Back CloseFull Screen / Esc
Print Version Interactive Discussion Fig. 4. Anomaly of Normalizad Difference Vegetation Index for June to August 2003.
HESSD
2, 2025–2060, 2005 NDVI of vegetation classes during increased water deficit A. Lobo and P. Maisongrande Title Page Abstract Introduction Conclusions References Tables Figures J I J I Back CloseFull Screen / Esc
Print Version Interactive Discussion 5 6 7 8 9 0.2 0.3 0.4 0.5 0.6 0.7 0.8 0.9 1999 − 2002 Month NDVI 5 6 7 8 9 0.2 0.3 0.4 0.5 0.6 0.7 0.8 0.9 2003 Month NDVI D SH B SpH SpH B SH D
Fig. 5. Values of mean monthly NDVI in the average June, July and August for the period 1999–2002 and for 2003 for each vegetation class. Bars represent the 5% confidence interval of the mean of each vegetation class.
HESSD
2, 2025–2060, 2005 NDVI of vegetation classes during increased water deficit A. Lobo and P. Maisongrande Title Page Abstract Introduction Conclusions References Tables Figures J I J I Back CloseFull Screen / Esc
Print Version Interactive Discussion 0 5 10 0.2 0.3 0.4 0.5 0.6 0.7 0.8 Month NDVI
Summer−green Herbaceous Vegetation
0 5 10 0.2 0.3 0.4 0.5 0.6 0.7 0.8 Month NDVI
Spring−green Herbaceous Vegetation
0 5 10 0.2 0.3 0.4 0.5 0.6 0.7 0.8 Month NDVI Deciduous forests 0 5 10 0.2 0.3 0.4 0.5 0.6 0.7 0.8 Month NDVI
Broadleaf evergreen forests
Fig. 6. Annual courses on monthly NDVI for each vegetation class. Blue, average for the period 1999–2002; red, 2003. Bars represent maximum and minimum values observed in the 1999–2002 period.
HESSD
2, 2025–2060, 2005 NDVI of vegetation classes during increased water deficit A. Lobo and P. Maisongrande Title Page Abstract Introduction Conclusions References Tables Figures J I J I Back CloseFull Screen / Esc
Print Version Interactive Discussion −500 −400 −300 −200 −100 0 100 0 0.2 0.4 0.6 0.8 1 Summer P−PET (mm) All classes: Average Summer
August NDVI −600 −500 −400 −300 −200 −100 0 0 0.2 0.4 0.6 0.8 1 Summer P−PET (mm) All classes: Summer 2003
August NDVI −300 −200 −100 0 100 −0.4 −0.3 −0.2 −0.1 0
Summer Anomaly of P−PET (mm) All classes: Summer 2003
August Anomaly of NDVI
Fig. 7. Top, boxplots of the anomaly of NDVI in August 2003 by intervals of summer P-PET; bottom, boxplots of the NDVI in August by intervals of summer P-PET; left, average August and average summer (1999–2002); right, August and summer 2003. The central segment in each box marks the median; Notches represent a robust estimate of the uncertainty about the medians (two given medians can be considered different if their notches do not overlap); extremes of the boxes mark the lower and upper quartile; extreme horizontal segments mark the range;+ signs mark outliers.
HESSD
2, 2025–2060, 2005 NDVI of vegetation classes during increased water deficit A. Lobo and P. Maisongrande Title Page Abstract Introduction Conclusions References Tables Figures J I J I Back CloseFull Screen / Esc
Print Version Interactive Discussion Fig. 8. Plot of the P-PET in summer 2003 vs. P-PET in the average summer (1999–2002).
HESSD
2, 2025–2060, 2005 NDVI of vegetation classes during increased water deficit A. Lobo and P. Maisongrande Title Page Abstract Introduction Conclusions References Tables Figures J I J I Back CloseFull Screen / Esc
Print Version Interactive Discussion −500 −400 −300 −200 −100 0 100 −60 −50 −40 −30 −20 −10 0
P−PET (mm) (Average Summer)
Anomaly of NDVI
Fig. 9. Most negative NDVI anomalies in August 2003 across P-PET in the average summer (1999–2002).
HESSD
2, 2025–2060, 2005 NDVI of vegetation classes during increased water deficit A. Lobo and P. Maisongrande Title Page Abstract Introduction Conclusions References Tables Figures J I J I Back CloseFull Screen / Esc
Print Version Interactive Discussion Fig. 10. Bivariate histogram of NDVI in the average August vs. P-PET for the average summer
(1999–2002). Colors are proportional to abundance. 1, summer herbaceous vegetation; 2, spring herbaceous vegetation.
HESSD
2, 2025–2060, 2005 NDVI of vegetation classes during increased water deficit A. Lobo and P. Maisongrande Title Page Abstract Introduction Conclusions References Tables Figures J I J I Back CloseFull Screen / Esc
Print Version Interactive Discussion −140 −130 −120 −110 −100 −90 −80 −14 −12 −10 −8 −6 −4 −2
Anomaly of Summer P−PET (mm)
Anomaly of August NDVI
SH
SpH
Dec
Brev
Fig. 11. Plot of the mean values and standard errors (p=0.95) of the anomaly of NDVI in August 2003 vs. the anomaly of P-PET in summer 2003 for the four vegetation classes considered. Dec, deciduous forests; Brev, broadleaf evergreen forests; Spr, spring herbaceous vegetation; Sum, summer herbaceous vegetation.
HESSD
2, 2025–2060, 2005 NDVI of vegetation classes during increased water deficit A. Lobo and P. Maisongrande Title Page Abstract Introduction Conclusions References Tables Figures J I J I Back CloseFull Screen / Esc
Print Version Interactive Discussion EGU -300 -200 -100 0 100 0.1 0.2 0.3 0.4 0.5 0.6 0.7 0.8 0.9 Summer P-PET (mm) Summer-green Herbaceous Vegetation:
Average Summer Au g u s t N D VI -500 -400 -300 -200 -100 0 0.1 0.2 0.3 0.4 0.5 0.6 0.7 0.8 0.9 Summer P-PET (mm) Summer-green Herbaceous Vegetation:
Summer 2003 Au g u s t N D VI -300 -200 -100 0 100 -0.4 -0.3 -0.2 -0.1 0
Summer Anomaly of P-PET (mm) Summer-green Herbaceous Vegetation:
Summer 2003 A ugu s t A n o m al y o f N D V I -400 -300 -200 0.1 0.15 0.2 0.25 0.3 0.35 Summer P-PET (mm) Spring-green Herbaceous Vegetation:
Average Summer Au g u s t N D VI -600 -500 -400 -300 -200 0.1 0.15 0.2 0.25 0.3 0.35 Summer P-PET (mm) Spring-green Herbaceous Vegetation:
Summer 2003 Au g u s t N D VI -200 -100 0 -0.18 -0.16 -0.14 -0.12 -0.1 -0.08 -0.06 -0.04
Summer Anomaly of P-PET (mm) Spring-green Herbaceous Vegetation:
Summer 2003 A u gu s t A nom al y of N D V I
Figure 12. Boxplots of August NDVI by intervals of summer P-PET and their anomalies for herbaceous vegetation. See caption of Fig. 4 for the interpretation of the boxplots.
Fig. 12. Boxplots of August NDVI by intervals of summer P-PET and their anomalies for herba-ceous vegetation. See caption of Fig. 4 for the interpretation of the boxplots.
HESSD
2, 2025–2060, 2005 NDVI of vegetation classes during increased water deficit A. Lobo and P. Maisongrande Title Page Abstract Introduction Conclusions References Tables Figures J I J I Back CloseFull Screen / Esc
Print Version Interactive Discussion −400 −300 −200 −100 0 0.1 0.2 0.3 0.4 0.5 0.6 0.7 0.8 Summer P−PET (mm) Deciduous Forest: Average Summer August NDVI −500 −400 −300 −200 −100 0.1 0.2 0.3 0.4 0.5 0.6 0.7 0.8 Summer P−PET (mm) Deciduous Forest: Summer 2003 August NDVI −300 −200 −100 0 100 −0.4 −0.3 −0.2 −0.1 0
Summer Anomaly of P−PET (mm) Deciduous Forest:
Summer 2003
August Anomaly of NDVI
−400−300−200−100 0 100 0.1 0.2 0.3 0.4 0.5 0.6 0.7 0.8 Summer P−PET (mm) Broad−leaf Evergreen Forest:
Average Summer August NDVI −500 −400 −300 −200 0.1 0.2 0.3 0.4 0.5 0.6 0.7 0.8 Summer P−PET (mm) Broad−leaf Evergreen Forest:
Summer 2003 August NDVI −300 −200 −100 0 −0.4 −0.3 −0.2 −0.1 0
Summer Anomaly of P−PET (mm) Broad−leaf Evergreen Forest:
Summer 2003
August Anomaly of NDVI
Fig. 13. Boxplots of August NDVI by intervals of summer P-PET and their anomalies for forests. See caption of Fig. 4 for the interpretation of the boxplots.
HESSD
2, 2025–2060, 2005 NDVI of vegetation classes during increased water deficit A. Lobo and P. Maisongrande Title Page Abstract Introduction Conclusions References Tables Figures J I J I Back CloseFull Screen / Esc
Print Version Interactive Discussion 120 140 160 180 200 220 100 120 140 160 180 200 220
NDVI Average Summer
NDVI Summer 2003 Deciduous forests −300 −250 −200 −150 −100 −50 0
Fig. 14. Grid plot of NDVI in August 2003 vs. NDVI in the average August (1999–2002) for deciduous forests. Colors are proportional to the summer P-PET anomaly.
HESSD
2, 2025–2060, 2005 NDVI of vegetation classes during increased water deficit A. Lobo and P. Maisongrande Title Page Abstract Introduction Conclusions References Tables Figures J I J I Back CloseFull Screen / Esc
Print Version Interactive Discussion −450 −400 −350 −300 −250 −200 −150 −100 −50 0 50 0.4 0.45 0.5 0.55 0.6 0.65 0.7 0.75 0.8 0.85 0.9 Summer P−PET (mm) August NDVI
Fig. 15. Trajectories in the August NDVI vs. summer P-PET plane for a random sample of pixels of deciduous forests. Each arrow starts at the point of the average year (1999–2002) and ends at the point of values for 2003.