HAL Id: hal-00843356
https://hal-imt.archives-ouvertes.fr/hal-00843356
Submitted on 22 Jul 2013
HAL is a multi-disciplinary open access
archive for the deposit and dissemination of
sci-entific research documents, whether they are
pub-lished or not. The documents may come from
teaching and research institutions in France or
abroad, or from public or private research centers.
L’archive ouverte pluridisciplinaire HAL, est
destinée au dépôt et à la diffusion de documents
scientifiques de niveau recherche, publiés ou non,
émanant des établissements d’enseignement et de
recherche français ou étrangers, des laboratoires
publics ou privés.
Accuracy of Breast Density Estimation from
Mammographic Images
N. Geeraert, Rémy Klausz, Isabelle Bloch, S. Muller, H. Bosmans
To cite this version:
N. Geeraert, Rémy Klausz, Isabelle Bloch, S. Muller, H. Bosmans. Accuracy of Breast Density
Esti-mation from Mammographic Images. BHPA, Feb 2013, Mechelen, Belgium. pp.4. �hal-00843356�
2
Accuracy of Breast Density Estimation from
Mammographic Images
N.Geeraert
a,b,c, R.Klausz
b, I.Bloch
c, S.Muller
b, H.Bosmans
aa, KU Leuven,BELGIUM b, GE Healthcare, Buc,FRANCE c, Telecom Paristech,Paris,FRANCE
Introduction
Breast density has been defined as an important risk factor for the development of breast cancer [1] but the mechanisms of the impact on breast cancer development remain unsolved. One of the main discussions is the definition of breast density. Traditionally breast density is derived by dividing the area of the fibroglandular tissue in the image by the area of the total breast. From a physics point of view the ratio of volumes is a much more representative measure of the dense tissue in the breast. We evaluate the sensitivity of a method that computes the ratio of the volume of the fibroglandular tissue by the volume of the total breast from mammography projection images via a calibration procedure of the imaging system with breast phantom material and acquisition parameters of the image. The method was tested on phantoms with known density and thickness.
Methods and materials
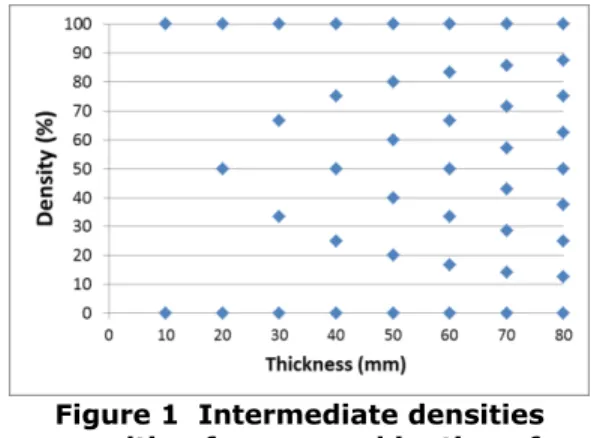
The model of the breast density computation from mammographic images was developed for a Senographe Essential (GE, Chalfont, UK). The calibration was done using breast equivalent plates (CIRS Inc, Norfolk, VA) of 12x24 cm and of 10 or 20 mm thick with a linear attenuation coefficient equivalent to adipose (0%) or to fibroglandular (100%) tissue [2]. The combination of the adipose and fibroglandular equivalent plates resulted in a limited number of intermediate breast density values as presented in Figure 1.
The thickness of the measured phantom combinations ranged from 10 to 80 mm. Images were made in manual mode, with tube potential between 23 kV and 32 kV for three anode/filter combinations (Mo/Mo, Mo/Rh and Rh/Rh) and thickness based kV selection compatible with an acceptable mammographic practise. The tube load (mAs) was taken equal to the tube load in automatic mode for the 0% density phantom with the same thickness. Pixel values of the measurement were determined as the average of all pixels in a region of interest (ROI) of 1 cm² in the middle of the plate at 6 cm from the chest wall.
Figure 1 Intermediate densities resulting from a combination of adipose and fibroglandular equivalent
3
The method we used to estimate the density is based on the centre of mass principle, with pixel value interpolations between the values of purely adipose and purely glandular breast equivalent material comparable to Kotre [3].The robustness of the method was analysed for the anode/filter-combination rhodium/rhodium. We investigated the sensitivity of these results for every variable known to have an impact on the calculations, namely tube voltage, thickness, pixel value and tube load. Therefore we simulated the deviations in breast density when adding an error to the input parameters of the model for the previous measurements.
Results
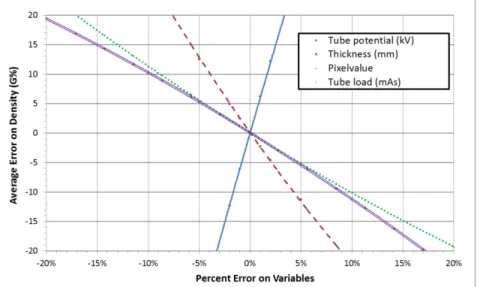
The average error when applying the breast density algorithm on images of known density was 0.07% density and the average of the absolute value of the error was 0.31% density with a 0.40% standard deviation. The sensitivity is shown in Figure 2.
Figure 2 Absolute error on density estimation from Relative error on variables: tube potential (full blue line), thickness (striped red line), pixel value (dotted green line),
tube load (double pink line)
Tube potential
Accuracy of tube potential results from the calibration of the high voltage-generator during production by the manufacturer, and is then checked during QC yearly tests. The distribution of tube potential deviations on GE-systems at manufacturing is at maximum 1.2%, which would generate 7.3% error on the density estimation. The European guidelines for quality control [4] accept an error smaller than ±1 kV (or 3.5% at 28 kV), with a reproducibility better than ±0.5 kV. The latter one leads to an average error of 10.6% on the density estimation.
Thickness
At routine clinical use of breast density algorithms, the estimation of the patient’s breast thickness would be retrieved from the DICOM-header. It is derived from the
4
position of the compression paddle. The error on the thickness indication [5][6] goes up to 3.8% and generates a 10% density estimation error.Tube load (mAs)
The tube load value is stored in the DICOM-header of each image with a precision of 0.1 mAs. This parameter is also calibrated at construction. The maximum error on the distribution of the tube load is 5% and the corresponding error on the density estimation is 5.3%.
Discussion and Conclusion
We compared the results of our method to the literature. Two different authors described the errors on their model for density measurements on phantoms. Highnam et al [7] found an average error of 1.11% for 5 times 5 plugged densities below 38% density and Pawluczyk, Yaffe et al [8] found an error below 5% for inserted phantom disks (1 cm, 100%, 75%, 50%, 25%, 0%), on digitized screen-film images.
The density model that we developed to compute the density estimation for phantoms has an accuracy equivalent to the best results in literature. The next step will be to improve the control of the influence of the breast thickness estimation in order to control the error of the density estimation for real breasts.
References
[1] McCormack, V.A., and dos Santos Silva, I.(2006) Breast Density and Parenchymal Patterns as Markers of Breast Cancer Risk: A Meta-analysis. Cancer Epidemiology, Biomarkers and Prevention 15: 1159-1169 [2] Geeraert, N., Klausz, R., Giudici, P., Cockmartin, L., Bosmans, H. (2012) Dual-energy CT characterization of x-ray attenuation properties of breast equivalent material plates. Society of Photographic
Instrumentation Engineers, SPIE Medical Imaging, San Diego
[3] Kotre, J.C. (2010) X-ray absorptiometry of the breast using mammographic exposure factors: application to units featuring automatic beam quality selection. British Journal of Radiology 83: 515-523
[4] European guidelines for quality assurance in breast cancer screening and diagnosis, Fourth Edition (2006) N. Perry, M. Broeders, C. de Wolf, S. Törnberg, R. Holland, L. von Karsa, E. Puthaar ISBN 92-79-01258-4 [5] Hauge, I.H.R, Hogg, P., Szczepura, K., Connolly, P., McGill, G., and Mercer, C. (2012) The readout thickness versus the measured thickness for a range of screen film mammography and full-field digital mammography units. Medical Physics 39:263-271
[6] Tyson, A.H., Mawdsley, G.E., and Yaffe, M.J. (2009) Measurement of compressed breast thickness by optical stereoscopic photogrammetry. Medical Physics 36: 569-576
[7] Highnam, R., Brady, S.M., Yaffe, M.J., Karssenmeijer, N., and Harvey, J.(2010)
Robust Breast Composition Measurement - Volpara In J. Martí et al. (Eds.): IWDM 2010, LNCS 6136: 342–349 [8] Pawluczyk, O., Augustine, B.J., Yaffe, M.J., Rico, D.,Yang, J., Mawdsley, G.E., and Boyd, NF. (2003)
A volumetric method for estimation of breast density on digitized screen-film mammograms. Medical Physics 30: 352-364