Université de Montréal
Using sensory substitution devices for a letter recognition task
Présenté par: Yaacov Cohen, B.Sc.
École d’Optométrie
Mémoire présenté à la Faculté des études supérieures en vue de l’obtention du grade de maitrise en sciences de la vision
option sciences fondamentales
Résumé
Les êtres humains exploitent de manière optimale leur sens de la vision dans le but d’interagir avec leur environnement. Ceux souffrant de cécité présentent évidemment un handicap, ainsi de nombreux scientifiques, tel que le Dr. Paul Bach-y-Rita, ont mis au point des appareils de substitution sensorielle ayant comme objectif l’amélioration de l’autonomie des personnes aveugles. Ce projet a impliqué huit sujets atteints d’une cécité congénitale et de huit sujets aux yeux bandés servant de contrôles dans une expérience d’entraînement de trois jours consécutifs sur une tâche de reconnaissance de caractère. Cette expérience a employé les plus récents appareils de substitution sensorielle, tel que le Tongue Display Unit (où une image est convertie en un patron de stimulation tactile sur la langue) et le vOICe (où l’image est cette fois convertie en sons). Nous avons mesuré les temps de réaction comme moyen d’évaluer la performance à la tâche de reconnaissance de lettre. Les lettres apparaissent sur un écran se situant devant les participants et une caméra, posée sur des lunettes, capture la scène et la convertit en sensations tactiles sur la langue, en sons ou les deux simultanément. Chaque sujet aveugle était comparé à un sujet aux yeux bandés de même âge et d’habilité musicale similaire. Les paires de participants ont été répartis dans trois groupes d’entrainements: un groupe audio (seulement le vOICe), un groupe tactile (seulement le TDU) et un groupe audio-tactile (vOICe + TDU simultanément). Nous avons découvert que les sujets atteints d’une cécité congénitale surpassaient les contrôles voyants dans le groupe audio seulement. Nous demeurons optimistes, vu les dernières
technologies disponibles aujourd’hui, que les prochaines percées scientifiques fourniront aux aveugles un meilleur sens d’autonomie.
Mots-clés: cécité congénitale, substitution sensorielle, substitution multi-sensorielle, reconnaissance de caractères, TDU, vOICe, MSSD, entraînement multi-sensorielle
Abstract
Humans use their sense of vision in order to interact with their environment in an optimal
manner. Those who suffer from blindness are therefore at a disadvantage, and so, scientists, such as Dr. Paul Bach-y-Rita have created sensory substitution devices (SSDs) with the purpose of providing the blind population with more independence. This project recruited eight congenitally blind (CB) and eight blindfolded sighted control (SC) subjects to engage in a training experiment on a letter recognition task on three consecutive days. The experiment made use of state-of-the-art sensory substitution devices, such as the tongue display unit (TDU) (where a visual scene is transformed into a pattern of tactile stimulations on the tongue), and the vOICe (where visual information is transformed into sounds). We measured performance on the letter recognition task using reaction times. The letters would appear on a screen in front of the participants and a camera, mounted onto glasses, would capture the scene and convert it into tactile sensations on the tongue, sounds, or both. Congenitally blind subjects and the blindfolded sighted controls were matched for age and musical experience. The pairs were then assigned to three different training conditions; an audio group (vOICe only), a tactile group (TDU only), and an audio-tactile group (vOICe + TDU simultaneously). We found that the congenitally blind subjects significantly outperformed the sighted controls in the audio group only. We remain optimistic in the breadth of new technologies available for the blind, as well as the potential breakthroughs that will, one day, provide blind individuals with an increased sense of autonomy.
Keywords: congenital blindness, sensory substitution, multisensory substitution, letter recognition, TDU, vOICe, MSSD, multisensory training
Table of Contents Résumé ... i Abstract ... ii List of figures ... v List of tables ... vi List of abbreviations ... vii Acknowledgments ... ix Chapter 1 Introduction ... 11 1.0 Sensory Substitution ... 11
1.1 Sensory Substitution: Touch ... 14
1.1.1 Fingertips ... 15
1.1.2 Tongue ... 19
1.2 Sensory Substitution: Audition ... 24
1.3 Multisensory Learning ... 27 1.4 The Project ... 29 Chapter 2 Methods ... 32 2.0 Participants ... 32 2.1 Ethics ... 32 2.2 Training Conditions ... 33 2.3 Equipment ... 33 2.3.1 Hardware ... 33
2.3.1.1 Tongue Display Unit ... 33
2.3.1.2 BrainPort v100 Handheld Remote ... 34
2.3.1.3 Speakers ... 35
2.3.1.4 Computer & Mouse ... 36
2.3.1.5 Wireless Keybord ... 37 2.3.2 Software ... 37 2.3.2.1 The vOICe ... 37 2.3.2.2 ePrime ... 37 2.3.2.3 vRemote ... 37 2.4 Procedure/Timeline ... 38 2.4.1 Day One ... 39 2.4.2 Day Two ... 40 2.4.2.1 Number of Bars ... 40 2.4.2.2 Arrow Direction ... 40 2.4.2.3 Shape identification ... 41 2.4.2.4 Letter Recognition ... 41 2.4.3 Day Three ... 41 2.4.4 Day Four ... 41 2.4.5 Day Five ... 42 2.5 TDU Cleaning ... 42 2.6 Analysis ... 42 Chapter 3 Results ... 44 3.0 Statistical Analysis ... 44
3.1 Other Factors and Interactions ... 46 3.2 The Letters ... 52 3.3 Musical Experience ... 54 Chapter 4 Discussion ... 55 Chapter 5 Conclusion ... 65 References ... 66
List of figures
Figure 1: Image of the TVSS ... 12
Figure 2: 3-D representation of the vOICe ... 14
Figure 3: Image of a homunculus ... 15
Figure 4: Image of the Optacon ... 16
Figure 5: Progression of tactile SSDs ... 23
Figure 6: Image of the TDU ... 34
Figure 7: Image of the BrainPort handheld remote ... 35
Figure 8: Speakers with complete set-up ... 36
Figure 9: Image of the v-Remote ... 38
Figure 10: Training Condition x Vision Interaction ... 45
Figure 11: Vision x Session x Training Condition Interaction ... 46
Figure 12: Vision x Session Interaction ... 47
Figure 13: Vision Factor ... 48
Figure 14: Training Condition Factor ... 49
Figure 15: Session Factor ... 50
List of tables
Table 1: Five-day timeline ... 38 Table 2: Selective statistics of significant letters ... 53
List of abbreviations
SSD Sensory Substitution Device TVSS Tactile Vision Substitution System CB Congenitally Blind
SC Sighted Control
TDU Tongue Display Unit SI Primary Somatic Cortex
TMS Transcranial Magnetic Stimulation
rTMS Repetitive Transcranial Magnetic Stimulation MOC Mid Occipital Cortex
fMRI Functional Magnetic Resonance Imaging VWFA Visual Word Form Area
PET Positron Emission Tomography rCBF Regional Cerebral Blood Flow AI Primary Auditory Field
MSSD Multisensory Substitution Device MT/V5 Middle Temporal Visual Area STP Superior Temporal Polysensory VIP Ventral Intraparietal Sulcus
Truth does not become more true by virtue of the fact that the entire world agrees with it, nor less so even if the whole world disagrees with it
Acknowledgments
First and foremost, I would like to thank Dr. Maurice Ptito for accepting me into his laboratory for the course of my Master’s degree. On the first day, he managed to make me feel at home and his positive outlook on life rubbed off on me, and surely anyone who knows him. The environment at the lab was a perfect mix of professionalism and humor, which allowed me to forge lasting relationships with my colleagues. Dr. Ptito has been an amazing mentor and always ensured my well-being, whether he was in Montreal or in Copenhagen. He shared many life stories with me that I will forever remember. I would also like to thank him for giving me the opportunity to travel to Copenhagen in order to conduct research with blind participants on a new sensory substitution device. You will always be dear to me and I am forever grateful.
Thank you to Laurent Elkrief for convincing me to do my Master’s degree at the School of Optometry. I am even more thankful that he introduced me to Dr. Ptito’s lab, where he was conducting research on the endocannabinoid system. I wish you the best finishing med school and I am convinced you will be the best doctor!
I would like to extend gratitude to Vanessa Harrar, who has acted as my research
supervisor throughout my academic journey. She allowed me to take part to her study pertaining to sensory substitution and blindness. She has always been kind, and sincerely wanted the best for me. She was always available whenever I had questions relating to our research study. Moreover, she took her time to teach me skills, such as analyzing statistics with advanced software, and scientific writing techniques, which I will carry with me throughout my professional career. Best of luck with your teaching career!
I consider myself to be lucky to have met Joseph Bouskila, who had been part of Dr. Ptito’s lab for many years prior to my arrival. When I first began my degree, he had been
finishing his Doctorate degree at the School. He always, and to this day, has my back whenever I have any questions or concerns. Hence, I knew I did not need to worry about much since he had already gone through this academic path, and knew everything you need to know about
successfully completing the program. His genuine personality and positive energy offered me a sense of security at the lab. Once again, thank you for everything you have done for me in the past two years. You are, and will always be considered a close friend of mine.
Most importantly, I would like to thank my parents for supporting me throughout my Master’s degree and far before that. They always had my best interest at heart and accepted every decision along my academic journey. They made sure that I never lacked anything and made me feel independent at a young age. The values and standards that I portray in my every-day life are solely thanks to them. I love you aba and ima for everything you have done for me.
Chapter 1 Introduction
1.0 Sensory SubstitutionDr. Paul Bach-y-Rita was a world-renowned neuroscientist who contributed greatly to the field of neuroplasticity. He was also the pioneer of sensory substitution, as he created several devices intended to treat individuals with neurological disorders. In 1967, Bach-y-Rita
consolidated his expertise in the field of neuroplasticity and began thinking of a device that could help blind persons “see”. He proposed that, in theory, designing a tactile to vision substitution system implies the concept of neuroplasticity, wherein subjects can experience visual sensations of light, texture, and shape obtained through an artificial receptor targeted at the skin receptors (Bach-y-Rita, 1967). However, brain plasticity, or adaptability, is the main factor in allowing the brain to filter irrelevant data and subjectively restructure the image captured by the sensory substitution device. He then sought to create the first tactile vision substitution system (TVSS).
In 1969, Bach-y-Rita invented the TVSS. He made use of a dentist’s chair and attached a 20x20 array of solenoid stimulators in the middle of the chair. Moreover, a camera, fixed on a tripod, was aimed at a screen displaying images. The image on the screen was relayed through a monitor, which then activated the 400 stimulators on the back of the chair. Lastly, the image would be translated into vibrations that were felt on the subject’s back.
Figure 1:Image of the TVSS including the dental chair, camera fixed on a tripod. The screen, where the objects would appear, is missing in this image. (Bach Y Rita, 1969).
In his first study using the TVSS, blind participants were asked to discriminate between vertical, horizontal, diagonal, curved lines, and other tasks, such as identifying common objects (i.e. telephone, chair, cup). Bach-y-Rita, along with his colleagues, found that with repeated presentations of the objects, the participants’ reaction times decreased markedly. Furthermore, the more the blind subjects became familiar with the objects presented, the easier it was to recognize them using minimal or partial cues felt on their backs (Bach-y-Rita et al., 1969). Meaning that even if the objects presented were overlapping or only partially visible, the subjects were capable of identifying them. This finding was replicated in a study conducted a year later by White and his colleagues. Seven congenitally blind (CB) participants were required to identify 25 different objects (i.e. telephone, stuffed animal, cup, etc.). On the first round of presentations of the objects, the subjects averaged approximately fifteen minutes per object until they correctly identified them. By the fifth round of object presentations, it took them roughly ten seconds to successfully identify an object using the stimulations on their backs as a reference
This study set the foundation of sensory substitution feasibility. Bach-y-Rita and his colleagues were successful in substituting vision with tactile stimulations on the back. The subjects reported that they perceived the sensory information coming from in front of the camera as opposed to the vibrotactors on their back (Bach-y-Rita et al., 1969). Later on in 2007, this phenomenon was coined as ‘exteroceptive’ information, meaning that the sensory information is perceived elsewhere in space, as opposed to the actual body part being stimulated (Auvray et al., 2007a). Additionally, Bach-y-Rita was able to provide novel information concerning brain plasticity, and sensory and motor coordination. Nevertheless, the mechanical vibrotactor system was using considerable amounts of energy, and therefore, he sought to create a new sensory substitution device that would be more cost and power efficient.
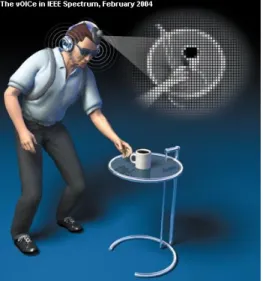
With the creation of the TVSS, Bach-y-Rita opened doors for other scientists and researchers to develop different SSDs. In 1992, Peter Meijer was the first to invent a sensory substitution device that could convert an image into sound patterns in real-time. It was a portable, low-power, and low-cost system. In comparison, the TVSS was not portable and was quite costly, as it required a dental chair, a camera, a tripod, and a monitor connecting the camera to the chair. Meijer’s auditory substitution device consisted of a camera integrated into a computer containing a specialized software that converted images into sounds. Moreover, the system was able to convert images into sounds up to a resolution of 64x64 pixels with sixteen gray-tones per pixel. The sixteen gray tones ensured sufficient information conservation in shading, causing smooth changes in brightness to be perceived as smooth changes in loudness (Meijer, 1992).
Before testing participants, Meijer wrote up an extensive review of the device where he specified that he only established the technical feasibility of the device. He knew that in order to draw more concrete conclusions, the next step would be to evaluate the system with blind
individuals. He wanted to analyze the differences between older and younger participants, as well as congenital versus late blind participants (Meijer, 1992). In 2008, Dr. Amir Amedi and colleagues, including Dr. Meijer, found that blind subjects were successful in object recognition tasks using when using the vOICe. Furthermore, the subjects recruited their ventral and dorsal ‘visual’ structures for shape versus localization tasks (Amedi et al., 2008).
Figure 2: 3-D representation of the vOICe. A camera captures the scene and converts it into sounds through earphones (Jones, 2004).
1.1 Sensory Substitution: Touch
The somatotopic arrangement of somatosensory inputs in the human cortex is called a homunculus (see Figure 3). The homunculus was the first illustration of cortical representation, accurately confirming the topography of cortical localizations (Penfield & Boldrey, 1937). The internal representation of the body within the homunculus does not duplicate the spatial
topography of the skin. Instead, the brain exaggerates particular body areas, notably the hand, and mouth. The representation of each body part in the brain is dependent on its relative
significance to sensory perception. In humans, a large number of cortical columns receive input from the hands, particularly the fingers (Pons et al., 1992). The primary somatic cortex (SI)
contains four areas: Brodmann’s areas 3a, 3b, 1, and 2. All four regions of the cortex differ functionally. However, they are extensively interconnected, so that both serial and parallel processing are involved in higher-order elaboration of sensory information (Pons et al., 1992). Their study found that tactile information is processed serially in higher primates (i.e. humans), meaning that humans process tactile information one item at a time, instead of processing many items at once (Pons et al., 1992). Numerous body parts have been the target of sensory
substitution studies, of relevance are the fingertips, back, and tongue.
Figure 3: Image of a homunculus with an exaggeration of the lips, tongue, and hands (Curtis High School Students, 2017).
1.1.1 Fingertips
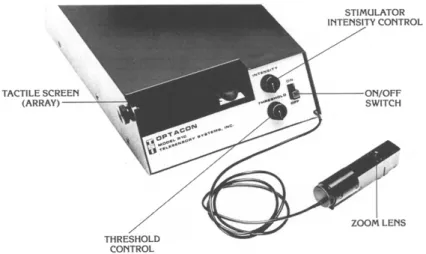
One of the first studies to employ a SSD to complete a letter recognition task using a SSD was conducted by Dr. James C. Craig in 1981. He tested a total of eight blindfolded sighted subjects who were required to identify vibrotactile patterns (i.e. letters of the alphabet) presented to their fingertips through a tactile display called the Optacon (Craig, 1981). The patterns were presented in five different modes, which produced five different feelings of the same object. Increasing the duration of the patterns on the fingertips resulted in improved performance in all
of the modes (Craig, 1981). However, the improvements were not uniform across modes, meaning that participants performed better under particular modes. The pattern durations varied from 4.3msec, 26msec, 100msec, and 400msec. In all of the modes, the 400msec duration yielded the highest number of correct answers (Craig, 1981). Moreover, they compared performances between two pattern durations, 400msec and 1000msec, and found that subjects performed equally well. Craig’s study showed that as of 400msec, performance on the letter recognition task was the best. By comparing performances between pattern durations of 400msec and 1000msec, they demonstrated that, after a particular duration, the results did not improve. Hence, it was important to ensure that the stimuli were adequate enough for participants to use the SSD in the most efficient manner possible.
Figure 4: Image of the Optacon. The device allows blind persons to read printed material, with their fingers, before being transcribed into Braille. The user puts his/her hand into the tactile screen (array). The zoom lens, which is connected to the Optacon, contains a camera that is manipulated by the user to read text. The camera transmits the text to the tactile screen, which then converts it into vibrations on the user’s hand. The threshold control is used to set the image
threshold between white and black. The users set the simulator intensity control knob to an intensity that is comfortable for them (Tan & Pentland, 1997).
Additionally, subjects have been tested on tasks requiring them to identify shapes. Kaczmarek et al., (1997), recruited six blindfolded subjects to participate in their study. They were tasked with identifying simple geometric patterns, such as squares, circles, and equilateral triangles, using a 49-point fingertip-scanned electrotactile display. The shapes were presented in four different pattern sizes: 4x4, 5x5, 6x6, and 7x7. They also tested the blindfolded participants on an array of Braille-like raised dots.
The raised dot performance of the subjects was much better (p<0.001) than their
performance on the electrotactile display (Kaczmarek et al., 1997). Furthermore, they showed that larger figures resulted in better performance. Although subjects performed better in the raised dot task, this study successfully demonstrate that tactile patterns can be identified on the fingertips, using electrical stimulation. This technology served as the groundwork for many other electrotactile devices, such as the TDU. For the experimenters, it surely was a remarkable
revelation, since subjects could “see” shapes using their fingertips.
Research has demonstrated that the occipital cortex is the area involved in processing visual information (Munk, 1890). It has been the subject of many studies attempting to better
understand its function. One study recruited eight blind and five late blind subjects, as well as ten sighted control (SC) participants. As evidence for cortical plasticity involved with braille
reading, they stimulated the entire occipital cortex using pulse transcranial magnetic stimulation (TMS) of all subjects (Ptito et al., 2008). They were seated in a chair designed to minimize head movements, and were required to verbally describe any subjective visual experience after every magnetic pulse. Ptito et al., (2008) found that out of the ten controls, nine reported phosphenes.
The term phosphene was first coined by J.B.H Savigny, and described them as spots of light that are produced by direct stimulation of the visual cortex other than by light (Savigny, 1838). On the other hand, the blind subjects reported tactile sensations on the fingers that were
somatotopically organized onto the visual cortex after TMS (Ptito et al., 2008). Thus, these results provided evidence for cross-modal plasticity following visual deprivation.
Ptito et al., (2008) demonstrated that proficient congenitally blind Braille readers interpret tactile sensations by recruiting their visual cortex, providing additional evidence for cross-modal plasticity. This is important to our present study since there are neural connections in blind individuals between their visual somatosensory cortices and their visual cortex, even though the congenitally blind population has never had any visual experience.
Before sensory substitution devices had been developed, the first sensory substitution system was braille (Maidenbaum et al., 2014). Congenitally blind persons learn Braille at a very young age and, therefore, Braille is an eminent task included in many studies conducted with the blind. For instance, Kupers et al., 2007 recruited eight early blind subjects, of whom five were
congenitally blind. All of them were proficient Braille readers, and underwent a reading task using five Braille lists, each containing 50 Finnish words. They read a list of words before the experiment to familiarize themselves with the stimuli. Then, the experimenters applied rTMS to the mid occipital cortex (MOC) at 1 Hz for 15 minutes, and had the subjects read through another list. The same process was used for rTMS of the primary somatosensory cortex (SI). Their results showed that the number of reading errors nearly doubled following occipital rTMS. However, rTMS to the SI cortex did not increase the number of mistakes. When subjects
underwent repetitive reading of the same word list, their reaction times decreased significantly, yet, this effect was abolished with occipital rTMS (Kupers et al., 2007). This study demonstrated
the imperative role of the visual cortex in repetition priming in the blind. Priming is an implicit memory function, and refers to a change in the ability to identify or produce an item that was previously perceived (Schacter & Badgaiyan, 2001). Thus, there is evidence pointing to the prominence of the visual cortex in a task that does not involve vision. Researchers have delved deeper into the brains of blind subjects in order to find critical structures that are associated with vision.
Another research experiment used fMRI to image the neural activity in eight congenital blind participants reading Braille (Reich et al., 2011). Reich et al., looked for the role of the visual word form area (VWFA) in Braille reading, and found that activation during Braille reading peaked in the VWFA and was the most significantly activated area in the entire brain. Reich et al., (2011) proposed that the VWFA was a meta-modal reading area developed particularly for reading, regardless of visual experience. They suggested the presence of a pathway linking the somatosensory cortex and the VWFA responsible for the processing of tactile information. The VWFA appears to be a multisensory integration area that has the ability to join simple features into more intricate shape descriptions (Reich et al., 2011).
1.1.2 Tongue
As seen in figure 3, the homunculus showed an exaggerated expression of the tongue. The somatotopic organization of the tongue illustrated that the tip was superiorly represented, while the back of the tongue was the least expressed over the post central gyrus (Picard & Olivier, 1983). Picard & Oliver (1983) thought that this type of representation may have been due to the greater need of cortical representation of the tip of the tongue in speech production, which serves as the most important role of the human tongue. After having created SSDs targeting the back and fingertips, scientists, and particularly Paul Bach-y-Rita, shifted their focus to the tongue. The
tongue is highly sensitive and mobile, and the saliva in the mouth assures great electrical contact (Bach-y-Rita et al., 1998). It was, therefore, a more power efficient system compared to the TVSS, since it required less current and voltage to operate. Moreover, they demonstrated that perception with electrical stimulation on the tongue was better than on the fingertips (Rita, 1998). Using a 49-point electrotactile stimulus array designed for a fingertip study, Bach-y-Rita et al., (1998) targeted the tongue to test five sighted participants on a shape discrimination task. The subjects were required to differentiate between a circle, square, and equilateral triangle. Moreover, the shapes were presented under four different pattern sizes (4x4, 5x5, 6x6, 7x7). Different shapes at different sizes affected the participants’ performances in a significant manner. In figure 3 of their article, they showed that for all four pattern sizes, as the object got bigger, the number of correct answers increased as well (Bach-y-Rita et al., 1998). Although this study was conducted with sighted subjects, the results validated the viability of perceptual systems for blind individuals using electrical stimulation to the tongue (Bach-y- Rita et al., 1998).
Bach-y-Rita’s study, in 1998, led many researchers to pursue the tongue as a sensory substitute. He was part of a research experiment that developed a new human-machine interface, which was composed of a videoconferencing camera, a video capture card, a laptop, a tongue display unit, an electrode array, and a custom image processing software (Sampaio, Maris, & Bach-y-Rita, 2001). The TDU was composed of a 10x10 electrode array, and any image captured by the camera was converted into electrotactile stimulations on the user’s tongue (see figure 5). Six congenitally blind and six blindfolded sighted controls were tested. The task consisted of the random presentation of the Snellen E in six different sizes and four orientations. The Snellen E task was composed of several rows containing the letter E rotated in different angles. The letter E
was the biggest on the first row, and decreased in size with each subsequent row. The experimenters quantified acuity by subjects’ performances at, or near, 100% correct
identification of the letter E (Sampaio et al., 2001). Before training, the average acuity for both groups was 20/860, wherein the blind outperformed the sighted, however, it was not statistically significant. After training the participants, they found a significant effect for the Snellen E size (p<0.0000001). Furthermore, both the blind subjects and sighted controls improved in terms of correct answers, as the Snellen E got smaller, compared to their baseline results. Both groups scored 100% in the 20/430 Snellen ratio (i.e. the second largest ratio used in the study), and 75% on the 20/240 Snellen ratio (i.e. the largest ratio used in the study). For example, someone who has 20/20 vision means that he/she can see the exact amount of detail of a certain scene, at 20 feet, compared to the average person who does not need corrective eyewear. Thus, an individual with 20/240 vision can see at 20 feet what an average person, who does not need corrective lenses, can see at 240 feet. In the United States, someone with a 20/240 ratio is considered to be legally blind (Lobo et al., 2018).
The Sampaio et al., (2001) study was the first to utilize the TDU and generate promising results. They were able to quantify ‘visual’ acuity with a sensory substitution system. The TDU designed by BrainPort, used in our project, is composed of a 20x20 electrode array. Even though the number of electrodes increased from the previous 10x10 array, it is still limited since it cannot properly fit every object onto the display, making it difficult for users to exploit.
The neural mechanism mediating sensory substitution using the TDU was pioneered by Dr. Maurice Ptito’s laboratory using brain imaging. In the first study of this type, Ptito et al., (2005) tested six congenitally blind subjects and five sighted blindfolded controls. They used positron emission tomography (PET) to record regional cerebral blood flow (rCBF) and to study
cross-modal plasticity using electrotactile stimulation of the tongue with the TDU (Ptito et al., 2005). The participants were PET scanned before and after they were trained to use their tongue in an orientation detection task. Both groups learned the orientation task after seven one-hour training sessions. Prior to training, there were no significant changes in rCBF in the occipital cortex in either group. However, activity in the occipital cortex increased, after practice, for all six of the blind subjects. Interestingly, this was not true for the sighted controls, hence providing evidence for training-induced plasticity in the blind (Ptito et al., 2005). They also showed that the blind subjects got more correct grating identifications and logged lower reaction times than their sighted counterparts.
Ptito et al., (2005) study was highly relevant since it revealed that cross-modal plasticity developed apace. Moreover, the occipital cortex, only in the blind, was part of a functional neural network for tactile discrimination (Ptito et al., 2005). More importantly, their results confirmed that the tongue can act as a portal to convey somatosensory information to the visual cortex. This remained true only for the blind and not for sighted people, hence, providing evidence of neuro-cognitive differences between blind and sighted individuals. One year later, Kupers et al., (2006) found that blind participants, who were proficient users of the TDU, reported somatotopically organized tactile sensations on their tongue when TMS was applied over their occipital cortex. These sensations were only true for the blind, whereas the blindfolded sighted controls reported visual phosphenes and not tactile sensations. This finding was
fascinating since blind subjects felt tactile sensations in the absence of direct tactile input (Kupers et al., 2006). A recent review found that neuronal cross-modal plasticity underlies the training effects with the TDU in CB individuals but not in sighted individuals (Ptito et al., 2018; Harrar et al., 2018).
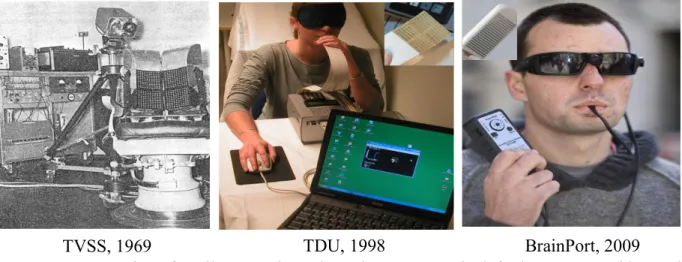
Figure 5: Progression of tactile SSDs throughout the years. On the left, the TVSS used by Paul Bach-y-Rita. In the middle is an image of the first model of the TDU, also known as the
“shoebox”. On the right is the newest version of the TDU, created by BrainPort, which is used in our project (Bach-y-Rita, 1969; Ptito et al., 2008; “Blind British Soldier”, 2010).
Moreover, another study found that six hours of training on a letter recognition task, using the TDU, showed activation in several visual areas such as the cuneus, fusiform gyrus, and inferior medial and superior occipital gyri (Kupers et al., 2003).
Exploring a different type of task, Chebat et al., (2007) also used the TDU to test the visual acuity of early blind subjects and blindfolded sighted controls with the Snellen tumbling E. The participants wore a head-mounted camera, and the TDU was composed of a 10x10 electrode array. In this study, as part of a training procedure before the real experiment, they had
participants distinguish between horizontal and vertical bars that were placed on a wall in front of them, and also had them walk toward the stimuli and touch them. No significance was found concerning the visual acuity thresholds of both groups. However, they did show different visual acuity frequency distributions between groups, where a larger proportion of early blind
participants had the highest visual acuity (Chebat et al., 2007). The smallest letter they were able
to distinguish was 2.5mm on the tongue, which corresponded to 1/90 visual acuity, being the highest score.
All of the tactile SSDs, such as the TVSS, TDU, and Optacon have proven to be feasible in certain tasks, especially for blind persons. Meanwhile, Dr. Peter Meijer focused on the auditory cortex and created a device, known as the vOICe, with the intention of capturing scenes with a camera and translating them into sounds using a specialized software.
1.2 Sensory Substitution: Audition
The auditory cortex is defined by the pattern of input connections, and type of sensory inputs provided by the thalamus (Ehret, 1997). In 1990, Lindsay Aitkin affirmed that the primary auditory field (AI) was present in all studied mammals. The AI was characterized by a solid connection with the ventral nuclei of the medial geniculate body, strong responses to tone bursts, and a tonotopy that emulated the gradient of cochlear frequency representation (Aitkin, 1990). Many of the studies conducted on auditory plasticity used only pure tones as stimuli, and therefore, the results may not have been representative of complex sounds, which are supposed to produce a spatially diverse activity pattern in the AI (Ahissar et al., 1992; Ehret, 1997).
In 1995, Kujala tested five early blind individuals using a whole-scalp magnetometer in order to study the activity in their visual cortex. The tasks included pitch changes wherein the subjects needed to either count the changes or ignore the stimuli. Magnetic resonance images were also obtained for two of the five subjects. Their magnetic responses to counting the changes in pitch were detected at the visual and temporal cortices (Kujala, 1995). Additionally, in two of the other three blind subjects, the visual cortex activation was noticeable in the auditory counting task. Kujala’s study was highly relevant to sensory substitution since the visual cortices of the blind
participants were activated in an auditory task, similarly to the activation of the visual cortex of blind participants in the aforementioned tactile tasks. Thus, Kujala showed that the human brain can rearrange its functions across different sensory modalities (Kujala, 1995).
Researchers sought to locate active brain regions while experimenting with auditory tasks using auditory SSDs. Striem-Amit et al., (2012) recruited seven congenitally blind subjects, and seven sighted controls. The congenitally blind participants all learned braille around the age of six, and therefore, were considered proficient Braille readers. They used the vOICe to teach participants how to read and recognize complex images using “soundscapes”, which were sounds that topographically represented images (Striem-Amit et al., 2012). They then used functional magnetic resonance imaging (fMRI) to assess fundamental topics regarding the visual word form area (VWFA). For instance, the VWFA has a higher selectivity for letters when compared to other visual types (Cohen & Dehaene, 2004; Dehaene & Cohen, 2011; Dehaene et al., 2010; Szwed et al., 2011). Moreover, this region is known for its plasticity of scripts, locations, and fonts learned in adulthood (Bolger et al., 2005, Dehaene et al., 2010).
The VWFA is located in the ventral occipito-temporal cortex, which is a critical area for reading acquisition (Dehaene et al., 2015). The congenitally blind group showed bilateral activation of the occipito-temporal cortex for letters emitted by the vOICe. Striem-Amit and her colleagues also found robust auditory cortex activation in the blind. The significant finding of the study was the preference of the VWFA to letters and words (Striem-Amit et al., 2007). This study illustrated that SSDs, such as the vOICe, allowed users to recognize many complex visual categories as well as activate their visual areas. Previously, we explained that SSDs used in tactile tasks activated the visual cortex, and now we know that SSDs used in auditory tasks activate these same areas. Striem-Amit et al., (2007) have successfully demonstrated that
congenitally blind individuals could activate areas that are associated with vision, even though they lack vision.
As aforementioned in the tongue studies, such as that of Chebat et al., (2007) the TDU has been very efficient in locomotor guidance, and so, researchers sought to find out if the same effect can be replicated using an auditory sensory substitution device (Auvray et al., 2007b). A total of six sighted participants were tested in four different experiments. Before undergoing the experiments, the participants had an extensive training session of three hours with the vOICe. The first experiment consisted of identifying a target by moving a hand-held camera, pointing at it, and then walking toward it. The second experiment tested their localization abilities in a constrained pointing task. The third experiment explored their ability to recognize ten natural objects, such as a shoe, book, spoon, handbag, and several more. The last experiment tested their ability to discriminate objects belonging to the same category.
The results showed that the subjects were successful in using the vOICe for locomotor guidance, localization of objects, and for pointing (Auvray et al., 2007b). Throughout the trials, their performance improved in retrieving depth information. Moreover, the participants were able to distinguish between different 3-D objects and discriminate among objects belonging to the same category (e.g. two different kinds of shoes). With training, the vOICe became more intuitive and thus, their overall processing time decreased (Auvray et al., 2007b).
The findings in the Auvray et al., (2007b) study were very promising since they showcased the efficiency of the vOICe in helping sensory impaired individuals complete every-day tasks. Nevertheless, the number of active users of the vOICe is unknown, and so, we cannot give a concrete answer as to how this device may be superior to others.
We are now aware of the feasibility of both the TDU, and the vOICe, individually, in
particular tasks. Combining both devices into a multisensory substitution device (MSSD) would allow us to compare the efficiencies of the MSSD and unisensory substitution devices. Our perceptual and attentional systems are naturally inclined to cross-modal associations, which is consistent with the critical role of multisensory integration in our conscious perception (Chiou & Rich, 2012).
1.3 Multisensory Learning
Much of the literature pertaining to multisensory learning emphasized its advantage over unisensory learning. The following is a brief summary of critical elements and brain regions associated to multisensory learning.
The neocortex is involved in sight and hearing in mammals and is said to be multisensory (Kaas, 1987; Ghanzafar & Shroeder, 2006). One study stated that we should reconsider thinking about neural processing in unisensory terms, since there was a multitude of evidence pointing to the multisensory nature of most of the neocortex (Ghanzafar & Shroeder, 2006).
Schroeder & Foxe (2002), focused on three main regions associated with multisensory integration: the posterior auditory association cortex, superior temporal polysensory area (STP), and the ventral intraparietal sulcus area (VIP). All of these regions were associated with
multisensory convergence receiving “feedforward” projections from two or more senses (Schroeder & Foxe, 2002). They found that the posterior auditory association cortex received converging auditory, somatosensory, and visual inputs. Therefore, those who trained in the audio-tactile training condition in our project must have been activating their posterior auditory association cortex.
Another study conducted by Seitz et al., (2006) tested 15 subjects with normal vision and hearing, on motion detection tasks. They were split into three groups: multisensory, unisensory, and direction-control. The multisensory group was trained in an audiovisual motion-detection task, and the unisensory group was trained with a visual motion-detection task. The objective was to detect and differentiate between the audiovisual and visual motion stimuli. The subjects’ performances were compared across ten days of training.
Both groups showed improvements of visual sensitivity with training (Seitz, Kim, & Shams, 2006). However, those who trained with multisensory stimuli showed significantly more learning both within and across training sessions (p<0.01). An interesting finding showed that the
multisensory group did better than the unisensory group in the unisensory trials.
The results were consistent with the findings that auditory motion modulated visual area MT/V5 (Lewis, 2000). One of the chief functions of area MT/V5 is visual motion (Zeki et al., 1991), although recent studies showed that area MT/V5 contributes also to tactile motion (Ptito et al., 2009; Matteau et al., 2010; Amemiya et al., 2017). Thus, subjects navigating with the TDU and/or the vOICe must be recruiting this particular cerebral region. The performance of area MT/V5 is heightened when moving stimuli are presented as opposed to stationary stimuli (Tootell et al., 1995). This study stresses the efficiency of multisensory training compared to unisensory training, even though the tasks might be considered to be mediated by low-level visual brain areas (Seitz et al., 2006).
Multisensory paradigms gained much excitement, and therefore, many scientists sought to test the benefits and implications of multisensory learning. Shams & Seitz, (2008) demonstrated that multisensory training was more effective than similar unisensory training paradigms. Moreover, the findings indicated that learning mechanisms operated optimally under
multisensory conditions. The main difference between unisensory and multisensory training existed during priming, where a larger set of processing brain regions, notably the visual word form area, were activated in the multisensory paradigms (Shams & Seitz, 2008). It was evident that the VWFA was critical in learning experiments, whether they were unisensory or
multisensory. This project will expectantly shed light on the utility of sensory substitution devices and identify most optimal SSD letter recognition.
1.4 The Project
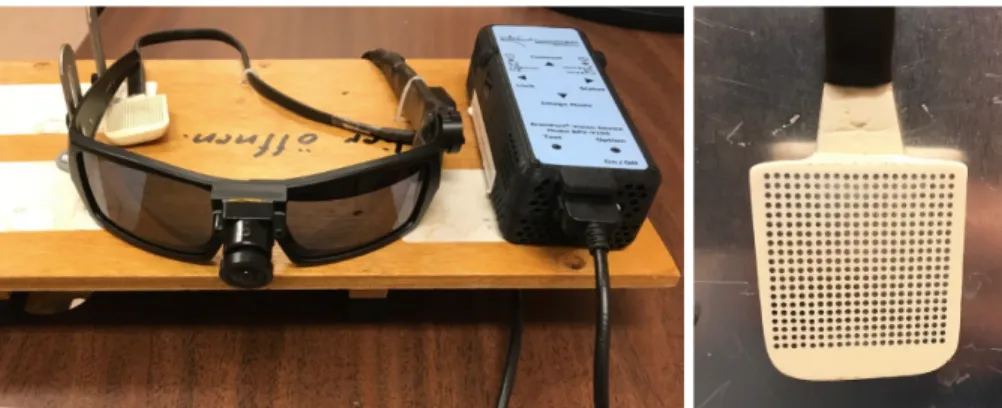
This project employed unisensory and multisensory training concepts to train participants on state-of-the-art sensory substitution devices, such as the tongue display unit (where a visual scene is transformed into a pattern of tactile stimulations on the tongue), and the vOICe (where visual information is transformed into sounds). The objectives of the study were to compare unisensory and multisensory learning, as well as to investigate whether congenitally blind subjects would outperform their blindfolded sighted counterparts, on a letter recognition task. The TDU used in our project was developed by BrainPort in 2009, and is currently the newest version of the device (see Figure 5, right). Earlier versions of the TDU, such as that created by Bach-y-Rita were composed of a 10x10 electrode array (e.g. the “shoebox” as seen in Figure 5, middle). BrainPort developed a device that was portable, and they also doubled the number of electrodes on the array to 20x20, allowing for more optimal tactile sensations. Additionally, the camera was designed to be small and mounted onto a pair of sunglasses. The BrainPort TDU integrated many new features such as controlling the camera zoom, array intensity manipulation, and setting different contrast sensitivities. All of these features allowed for a more user friendly experience, wherein the user could control all of the settings in order to feel as comfortable as
possible. The cost of the BrainPort TDU is set at 10,000$. The second SSD used in our project, the vOICe, was very similar to the TDU, in that it consisted of glasses with a mounted camera, and a software converting a scene. However, this scene was being transformed into sounds instead of tactile sensations on the tongue. Moreover, our study made us of the newest software update of the vOICe. Purchasing the entire kit of the vOICe costs 500$. Throughout our project, we recruited congenitally blind and sighted controls, and assigned them to one of three training conditions: audio (vOICe only), tactile (TDU only), and audio-tactile (simultaneous use of vOICe and TDU). They were then trained for three days on a letter recognition task, which consisted of all 26 letters of the alphabet being presented in random sequence, and in capital form. Thus, there were 26 trials for the letter recognition task. The letters would appear on the screen at a font size of 400, and the subject would be sitting 50cm away from the computer. The camera would scan the letter on the screen and convert it, either into electrotactile stimulations on the tongue, or into sounds emitted through two speakers. In this project, the stimuli were displayed for three seconds, and remained on a continuous loop until the subject stated the correct answer. The experimenter would record all of the incorrect answers until the right answer was given. The participants who trained with the vOICe, or with the combination of the
TDU+vOICe were required to be very attentive to the sounds emitted by the speakers since they were composed of complex tones. The letter recognition task was a combination of several pure tones, with the exception of the letter ‘I’, which was simply a pure tone. Missing one subtle sound would cause confusion and the participant would resort to guessing.
Throughout each training session reaction times (RTs) were recorded for every letter. We analyzed which letters were the easiest and those most difficult. One of our predictions was that the combination of both devices being used simultaneously (i.e. MSSD) would be more efficient
than the unisensory SSDs. We also predicted that average RTs would significantly decrease from day to day, and that those who trained in the audio-tactile training condition would yield the best results. Additionally, we hypothesized that the CB subjects would outperform the sighted
Chapter 2 Methods
2.0 Participants
Nine congenitally blind and eight sighted controls participated in this study. Yet, one CB subject was considered an outlier and removed from the sample since the results extrapolated from that same participant were hindering the data analysis (i.e. results were showing negative values with the application of standard error bars). The experiment took place at the School of Optometry, University of Montreal. Subjects were matched for age, musical experience, and prior experience with the TDU. The blind subjects were recruited from the INLB (Institut Nazareth et Louis Braille), located in the lobby of the School of Optometry. Flyers were posted in several public centers around the school in order to recruit most of our control subjects. The remainder of the controls were students and researchers enrolled at the School of Optometry.
Before scheduling participants, an eligibility questionnaire was administered over the phone. Questions included date of birth, age, sex, overall health, medications, visual condition, auditory sensitivity, tongue sensitivity, smoking, musical experience, and past multisensory training experience. Non-eligibility depended upon the medical history of certain subjects, and their sensory conditions. All of our subjects had normal hearing and tongue sensitivity. Moreover, some participants, especially elders, were already taking certain medications. We then asked to know what type of medication they were taking. None of the subjects’ medications conflicted with our non-eligibility protocol.
2.1 Ethics
Prior to beginning the research project, all subjects were handed out a consent form explaining, in detail, all of the aspects of the study and then proceeded with signing the form. All
aspects of the study were approved by the CRIR (Center for Interdisciplinary Research in Rehabilitation of Greater Montreal) research ethics board.
2.2 Training Conditions
Males (n=5 blind & n=4 sighted) and females (n=3 blind & n=4 sighted), with a mean age of 51.18 years, were assigned to one of three training conditions. Since the experiment was being conducted as participants were being recruited, the subjects were not randomly assigned to one of the three groups. We tried to have an even number of participants in each condition.
Moreover, the blind participants were the first to be recruited, and so, the first two subjects were randomly assigned to a particular condition, whereas the third one was placed in the remaining, untested, group. Thus, every third subject was not randomly assigned. Each blind participant was paired with a sighted control subject for age, musical experience, and prior experience with the TDU. Therefore, the controls were not randomly assigned. The three training conditions were classified as follows:
1) Audio à training with the vOICe exclusively (three blind & three controls) 2) Tactile à training with the TDU exclusively (three blind & three controls)
3) Audio-tactile à training with both vOICe+TDU simultaneously (two blind & two controls)
2.3 Equipment
The research experiment required the combination of hardware and software systems working together in order to carry out the letter recognition task.
2.3.1 Hardware
A pair of glasses, comprised of a mounted camera, was pointed at a computer screen placed 50cm away from the participant. The camera was connected to a 20x20 electrode array
converting the stimuli present on the computer screen into electrotactile vibrations on the tongue. The size of the TDU’s electrode array was 27mm x 27mm, and the diameter of each electrode is 1.55mm. Since we only employed a letter recognition task, the array was never fully occupied. It was difficult to quantify the size of each letter on the TDU array. However, an easy
quantification, given the known dimensions of the array, would be for the letter ‘I’. The letter ‘I’ was a single band of stimulations in the middle of the array, spanning from the top electrode to the bottom one. Thus, the letter ‘I’ occupied 20 electrodes, and the length of the stimulus was 27mm while the width was 1.55mm. The letter would appear on the screen for one second, and then the stimulations on the tongue would occur for two seconds. The camera was also connected to the BrainPort v100 handheld remote.
Figure 6: Image of the TDU. On the left are the glasses with a mounted camera, and right next to it is the BrainPort v100 remote. On the right is the 20x20 electrode array that subjects would place on their tongue.
2.3.1.2 BrainPort v100 Handheld Remote
stimuli. The TDU works optimally with black and white scenes, and so, we never needed to change the contrast sensitivity. Although there were two modes, high and normal (i.e. default) contrast sensitivity, we always kept the normal sensitivity. Changing the contrast to high sensitivity would be necessary if the stimuli were lighter colors, or not bold enough.
Figure 7: BrainPort Handheld remote. The aspects of the remote that we manipulated were zoom, stimulation intensity, contrast, and invert. On the right side of the remote there is the wheel/dial for zoom, and on the left side is the wheel/dial to manipulate the vibration intensity. There were two contrast settings, default and high contrast, which would allow for a sharper feeling of the image on the tongue. The invert button was used to invert the image seen on the screen in order for it to be correctly represented on the tongue.
2.3.1.3 Speakers
The sounds created by the vOICe software were emitted through two speakers, both
equidistant from the participant. The volume was set to 55% through the computer settings, and no complaints were made by any subject regarding the loudness of the speakers (see figure 8).
Figure 8: Speakers with complete set-up (as seen by subject). A) Computer screen where the letters of the alphabet appeared. B) Keyboard used by experimenter to key in correct/incorrect responses. C) Glasses with mounted camera pointed directly to the screen. The camera would capture the letter and transmit it to the 20x20 electrode array, which would create tactile
sensations on the user’s tongue. D) BrainPort v100 handheld remote manipulated by the user in order to enhance their experience with the electrode array. E) Blindfold (used by sighted
controls) and one of the two speakers. 2.3.1.4 Computer & Mouse
The computer was used to run the software that displayed the stimuli associated with the letter recognition task. The computer used was a 500 PC Series Hewlett-Packard (HP) and was running on the Windows 7 Entreprise operating system. The mouse was used for an orientation
A
B
E C D
grating task, where the left mouse click was associated with a grating tilted to the left, and vice versa.
2.3.1.5 Wireless Keybord
The keyboard was used by the experimenter in order to key in the subjects’ responses to the different tasks, and notably the letter recognition task. The brand of the keyboard was Hewlett-Packard (HP).
2.3.2 Software
2.3.2.1 The vOICe
Specialized software that converted images into sounds. It was very similar to the TDU, in that the participant wore the same glasses with the mounted camera, and there was a software converting an image, however, this image was converted into soundscapes instead of
electrotactile stimulations on the tongue. The vOICe was used to pre-record audio of all the stimuli used in our project (e.g. letters of the alphabet). The letter would appear on the screen for one second and then the audio was played for two seconds.
2.3.2.2 ePrime
This was the software used to create all of the tasks comprised in the experiment, such as the letter recognition task. Once the experiment was completed, all of the data (i.e. reaction times) were automatically recorded into the software. ePrime claims to have millisecond accurate response times and stimulus presentation.
2.3.2.3 vRemote
This software was especially designed for the TDU and was installed on a second computer. The vRemote allowed the experimenter to have live-time access to the image captured by the camera connected to the TDU. When the subject would manipulate the BrainPort handheld
remote (e.g. increasing or decreasing the intensity of the vibrations on the tongue), the
experimenter would be able to see the changes through the vRemote application. The intensity manipulation of the TDU was set by the user, on the first day only, and remained constant throughout the five-day experiment.
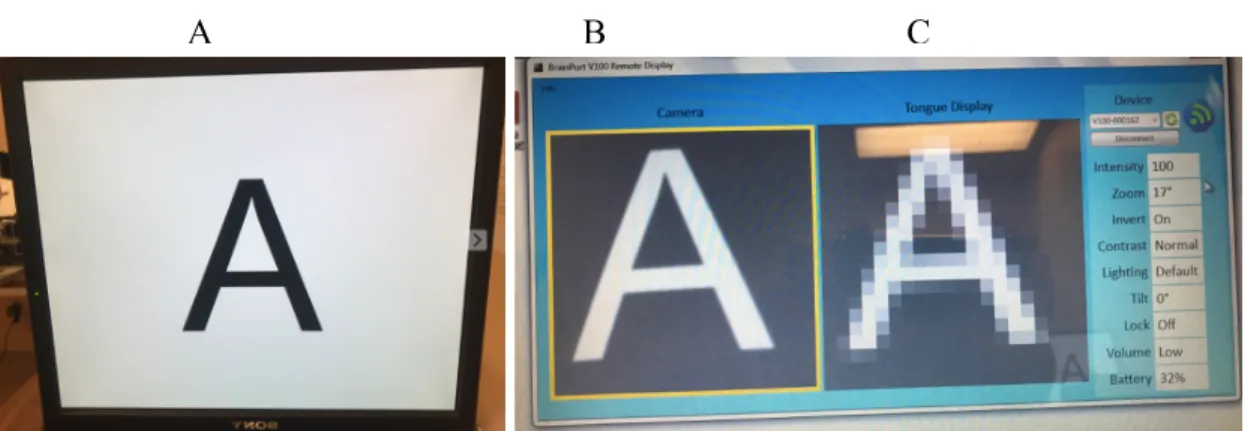
Figure 9: A) The letter A displayed on the computer screen (in front of the subject). B) This is the display created by the vRemote software. Thus, we see the vRemote display of the letter A captured by the glasses’ camera. C) This is the conversion of the letter A into electrotactile vibrations on the TDU, again through the vRemote software. The BrainPort v100 remote controlled all of the features found in C.
2.4 Procedure/Timeline
Table 1: Five-day timelineDay 1 Consent form and pre-orientation grating task
Day 2 Training #1
Day 3 Training #2
Day 4 Training #3
Day 5 Post-orientation grating task and payment
The experiment was conducted on five consecutive days. One night of sleep was required between each day in order to ensure memory consolidation. The focus of this thesis was on the letter recognition task exclusively, as the rest of the research experiment was part of a bigger project that has not yet been analyzed. Thus, the following timeline will explain, in some detail, some of the tasks that our participants underwent throughout the experiment.
2.4.1 Day One
Participants were greeted at the School of Optometry and accompanied to the laboratory. Before beginning the tasks, they were asked to read and sign a consent form. They were then familiarized with the equipment, and underwent an orientation grating task under all three training conditions. The orientation grating task was composed of fourteen differently angled gratings presented ten times in random order (totalling 160 trials in each of the three conditions). The gratings varied from ± 64, 32, 16, 12, 8, 6, 4, and 2 degrees. The smaller the angle, the harder the task became since the angle was closer to the midpoint and, therefore, it would be challenging to differentiate between left and right. On the other hand, with regards to both the TDU and the sounds emitted by the vOICe, the larger the angle the simpler it was.
Before the task began, participants were required to complete a practice session. The practice session made use of two gratings, +64 (see Figure 10) and –64 degrees (see Figure 11). They were randomly presented and the session ended after the sixth grating presentation. Since these were the easiest gratings, the subjects solely needed to distinguish between two distinct sounds, or two feelings on the tongue (depending on the training condition). The +64 grating had a distinct sound increasing in pitch, whereas the -64 grating had a clear sound decreasing in pitch. A mouse was handed to the participants, and every time they heard, or felt, a grating tilted to the right, they were supposed to click right, and vice versa. Once the participants scored over 80%
on the practice session, they were considered ready to begin the actual experiment, containing all of the angles. Therefore, on day one, every subject underwent a practice session followed by the experiment, for every training condition.
2.4.2 Day Two
This was the first day of training. The blind subjects were tested before the controls, and therefore, they were randomly assigned to train in one of the three training conditions. Our controls underwent the same exact training condition order as their corresponding match, hence eliminating any confounding variables. The training consisted of four different tasks:
2.4.2.1 Number of Bars
Horizontal, vertical, and diagonal bars were presented randomly. There were up to four bars on the screen in a given trial. The participants had to correctly mention how many bars they heard, or felt on the tongue. If they provided the incorrect answer, the same trial continued until they got the correct one. The stimulus would appear for approximately two seconds and would reappear, in a looping fashion, until the correct answer was uttered. In this task there was a total of 22 trials. The same trial may have appeared more than once throughout the task.
2.4.2.2 Arrow Direction
Participants were presented with arrows pointing up, down, left, right, top-left, top-right, bottom-left, and bottom-right, for a total of six different directions. They had to correctly identify the direction of the arrow. Again, if they got it wrong, they continued until they got the right answer. This task was comprised of 16 trials. The same trial may have appeared more than once throughout the task.
2.4.2.3 Shape identification
Participants were presented with four shapes: circle, triangle, rectangle, and lozenge (i.e. diamond). The shapes were either hollow or filled in. Once again, they had to correctly identify the shape, however, they were not required to specify if it was hollow or filled in. If they got the wrong answer, they were asked to continue until they got the right one. There were 26 trials in this task. The same trial may have appeared more than once throughout the task.
2.4.2.4 Letter Recognition
Each letter of the alphabet was presented once and in random order. All of the letters were in capital form at a font size of 500. Participants were told that the letters may appear more than once. If their answer was false, it was noted by the experimenter and the participant would have another try at it. After three incorrect responses, the answer would be revealed. Moreover, if participants got stuck on a letter and started guessing, they were provided with the correct answer. The objective of revealing the answer was to allow them to feel, and/or listen to, the letter one more time in order to recognize their mistake, and not repeat it again on the upcoming training days. On average, it took participants 40 seconds to identify a letter.
2.4.3 Day Three
The tasks were identical to day two and followed the same order. However, the sequence of the bars, arrows, shapes, and letters were different since they were randomly presented.
2.4.4 Day Four
2.4.5 Day Five
The last day was identical to day one, in that the participants underwent the orientation grating task again, along with the practice sessions associated to each of the three training conditions. The order of the training conditions was exactly the same as day one. For instance, if the order for one participant on day one was: tactile, audio, and audio-tactile, then on day five, the order was the same. At the end of the experiment, the participant was paid for the total amount of time they were present at the lab. Usually, it took participants close to an hour to complete each training session. Some subjects were faster than others and completed the training sessions in 30 minutes, and so we would ask them to run through the experiment one more time. A receipt was signed, confirming that the money was paid.
2.5 TDU Cleaning
Between each participant, and between each day, the TDU was washed and sterilized. BrainPort provided clear guidelines on how to proceed with cleaning the device.
2.6 Analysis
Before beginning the data analysis, we needed to remove the letters that were too difficult for subjects (i.e. those where the experimenter gave the answer). Trials were considered outliers if the experimenter gave the subject the answer, and/or if the reaction time for a given letter was greater than two times the standard deviation per subject per session. Reaction time values were extracted from the ePrime software. Depending on the participant, many letters were considered outliers, especially in the first session. With regards to the controls, across all three sessions, a total of 41 data points, out of 624 trials, (6.6%) were removed from the statistical analysis. As per the congenitally blind subjects, 63 data points were removed (10%).
Analysis of the reaction times was conducted using the SPSS software to run a 2x3x3 mixed model ANOVA. Mean reaction times were calculated in seconds (s). All of the outliers that were removed, and were now empty cells, were filled in by calculating the average reaction times, per session, and adding them accordingly into the corresponding empty cells. More importantly we analyzed the data from the three training days exclusively.
Chapter 3 Results
3.0 Statistical Analysis
Average reaction times on the letter recognition task, for the congenitally blind (CB) and sighted control (SC) subjects, were calculated for each training condition across every session. A 2 (vision: Blind or Control) x 3 (session) x 3 (training condition) mixed model ANOVA was employed in order to analyze the data. In this model, vision and session were within-subjects factors, while training condition was the between-subjects factor.
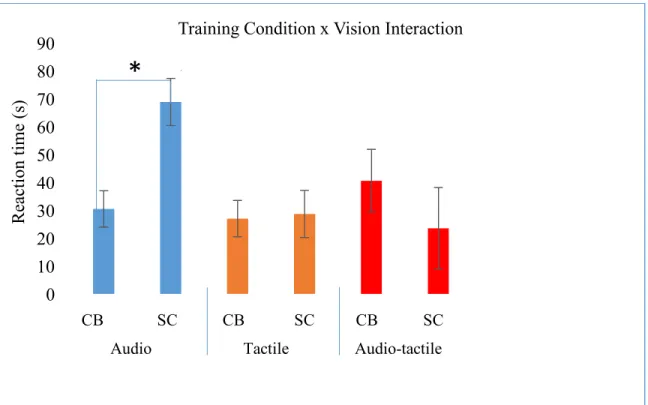
The three-way interaction between vision, session, and training condition yielded no significant results. However, the ANOVA revealed a significant main effect for training condition (F(1,4)=48.89; p=0.002). Post-hoc analysis confirmed there was an interaction effect between training condition and vision, wherein, throughout the experiment, the blind participants outperformed the sighted controls in the audio training condition only (F(2,4)=47.35; p=0.002). Hence, in every session, the blind participants were able to better utilize the vOICe, and had significantly lower RTs than the controls (see Figure 10). Furthermore, standard error bars were added to each significant average, and were represented in the text with the ± symbol. The blind had a mean reaction time, for each letter, of 30 ± 6.5 seconds, when training with the vOICe. By comparison, the controls had an average reaction time of 68.8 ± 8.5 seconds. There were no other significant main effects or interaction effects.
Figure 10: Interaction between training condition (audio, tactile, & audio-tactile) and vision (CB= congenitally blind & SC= sighted control). Average reaction times of congenitally blind and sighted control subjects, during training, are displayed for all three training conditions. The blue bars represent the audio training condition (those who trained with the vOICe). The orange bars represent the tactile training condition (those who trained with the TDU). Lastly, the red bars represent the audio-tactile training condition (those who trained with the MSSD).
0 10 20 30 40 50 60 70 80
90 Training Condition x Vision Interaction
R ea ct ion ti m e (s )
*
CB SC CB SC CB SC3.1 Other Factors and Interactions
The sample size in this project was small due to the difficulty in recruiting congenitally blind participants in Montreal. Therefore, statistical significance was only apparent in one instance. The original prediction was to find a significant reduction in average RTs across sessions for all of the subjects in all three training conditions. Yet, this three-way interaction did not produce any significant effect (F(4,8)=1.24; p=0.37).
Figure 11: Average reaction times of blind and control participants, training with their
respective sensory substitution device (SSD) across the three days of training. Sessions 1,2, and 3 are represented by s1, s2, and s3 respectively. The audio group trained with the vOICe, in blue, the tactile group trained with the tongue display unit (TDU), in orange, and the audio-tactile group trained with the multisensory substitution device (MSSD), in red. The MSSD consisted of the TDU and vOICe operating simultaneously. No significant difference was found in this
three-The ANOVA did not yield any significant interaction between vision and session (F(2,8)= 0.26; p=0.78). Figure 11 indicated that the pattern of improvement across sessions was in line with the original prediction, in that all subjects improved with each training day, even though these improvements were not statistically significant.
Figure 12: Changes in average RTs for congenitally blind (CB) and sighted control (SC) subjects across training sessions (s1, s2, s3). The green bars represent the reaction times throughout the three sessions for the congenitally blind participants. On the other hand, the navy bars represent the RTs throughout all three sessions for the sighted controls.
0 10 20 30 40 50 60
Vision x Session Interaction
R ea ct ion T im e (s ) s1 s2 s3 s1 s2 s3 CB SC Congenitally blind RTs per session Sighted control RTs per session
Several patterns found in the following figures are in line with the aforementioned predictions. For instance, one of the predictions was that the congenitally blind would
outperform the sighted controls on the letter recognition task. After calculating average reaction times for both participant groups, the CB had an average RT of 32.66 seconds, with a standard error of ±4.83 seconds. On the other hand, the SC subjects had a mean RT of 40.33 seconds, with a standard error of ±6.31 seconds. Although no statistical significance could be established (F(1,4)=3.413; p=0.138) Figure 13 shows a trend towards lower reaction times for the blind compared to the controls.
Figure 13: Average RTs comparing blind subjects and controls. Congenitally blind (CB), in green, and sighted control participants (SC), in navy, were compared by analyzing their average reaction times on the letter recognition task. No significance was found between the mean reaction times for the congenitally blind and sighted control subjects.
0 5 10 15 20 25 30 35 40 45 50 R ea ct ion Ti m e (s ) Blind Control CB SC Vision Factor
Furthermore, a prediction was also made concerning the advantage of multisensory training over unisensory training. Thus, subjects who trained with the multisensory substitution device should have had faster RTs than those who trained with either the vOICe or the TDU alone. However, looking at Figure 14, the trend pointed toward the TDU yielding the lowest average RT. Post-hoc analysis revealed that the average RTs for those who trained in the audio, tactile, and audio-tactile training conditions were 49.63s, 27.80s, and 32.01s respectively.
Standard error was accounted for as well. The audio and tactile conditions had standard errors of ±7.02s, whereas the audio-tactile condition had a standard error of 12.13 seconds. Keeping in mind there was no significant difference between training conditions (F(2,4)=2.56; p=0.192), increasing the number of participants in the study may have shifted the advantage to the audio-tactile group.
Figure 14: Average reaction times for all three training conditions. Reaction times, measure in seconds, of subjects training on either the vOICe (in blue), TDU (orange), or MSSD (red) yielded no significant differences in the letter recognition task. As stated in the introduction, subjects training in the audio-tactile training condition (using the MSSD) should have significantly outperformed those training in the unisensory conditions.
0 10 20 30 40 50 60
Audio Tactile Audio-tactile
R ea ct ion Ti m
e Training with vOICe
Training with TDU
Training with vOICe+TDU